. 2019 Aug;572(7769):335-340.
doi: 10.1038/s41586-019-1406-x. Epub 2019 Jul 17.

Activation of PDGF pathway links LMNA mutation to dilated cardiomyopathy

Affiliations

Activation of PDGF pathway links LMNA mutation to dilated cardiomyopathy

Jaecheol Lee et al. Nature. 2019 Aug.

Abstract

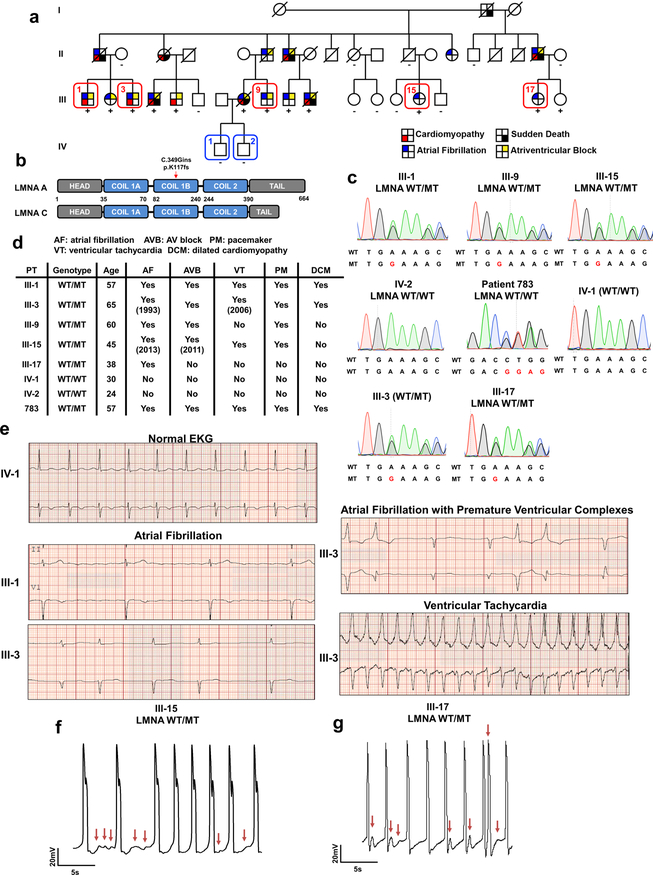
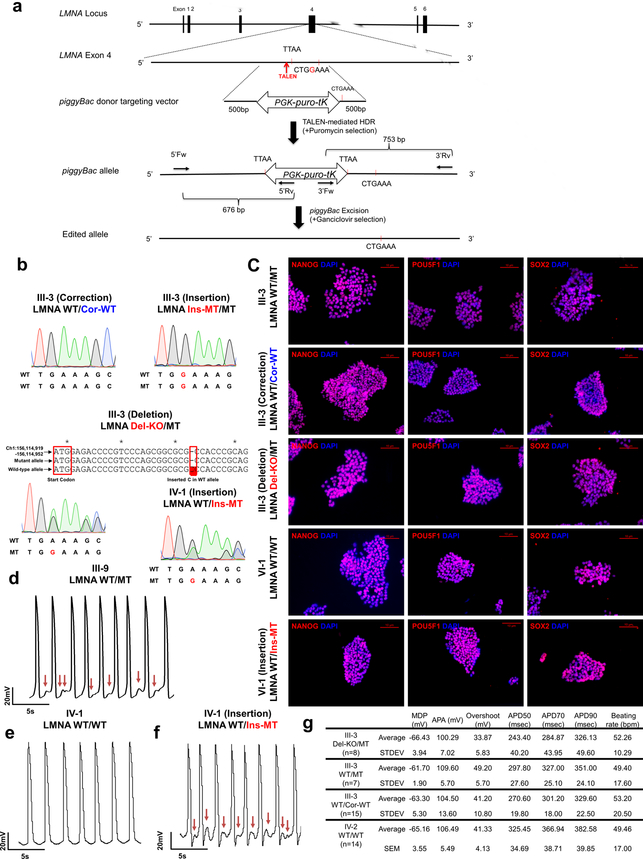
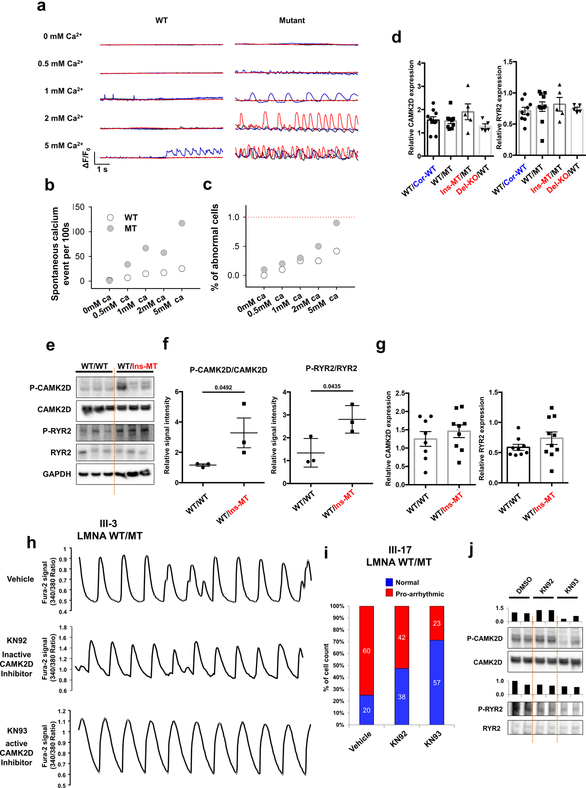
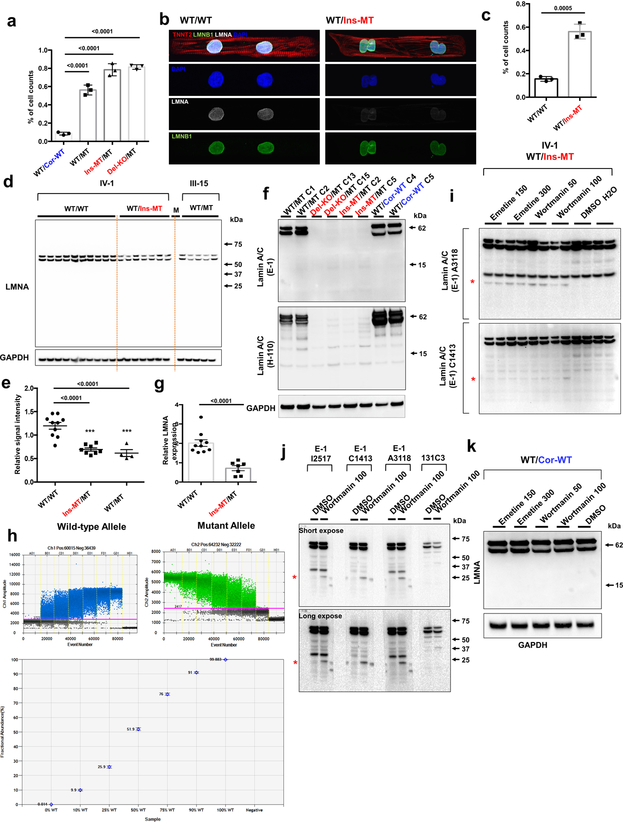
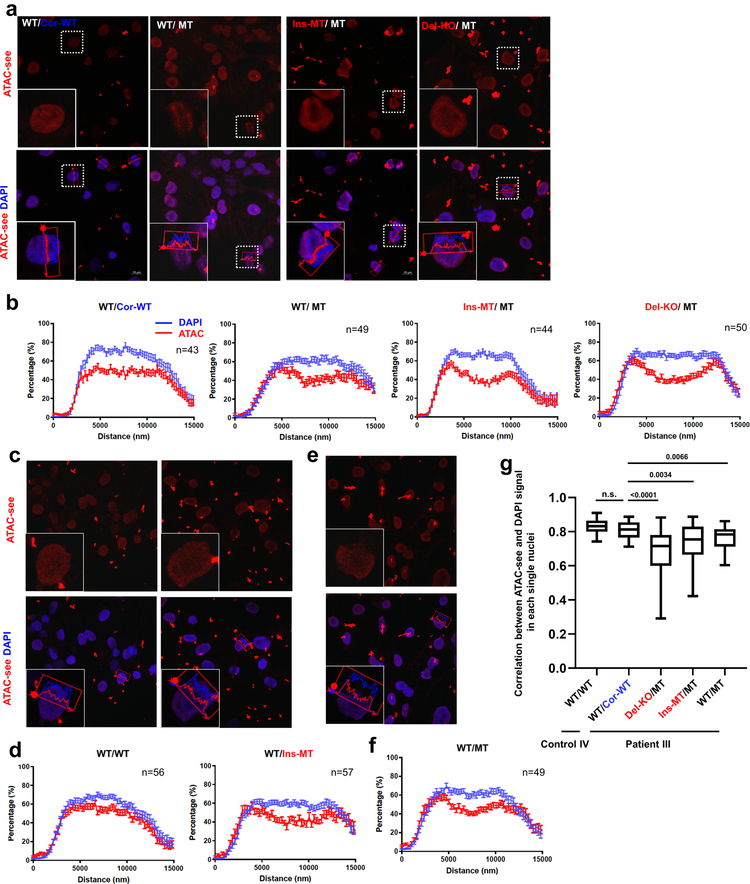
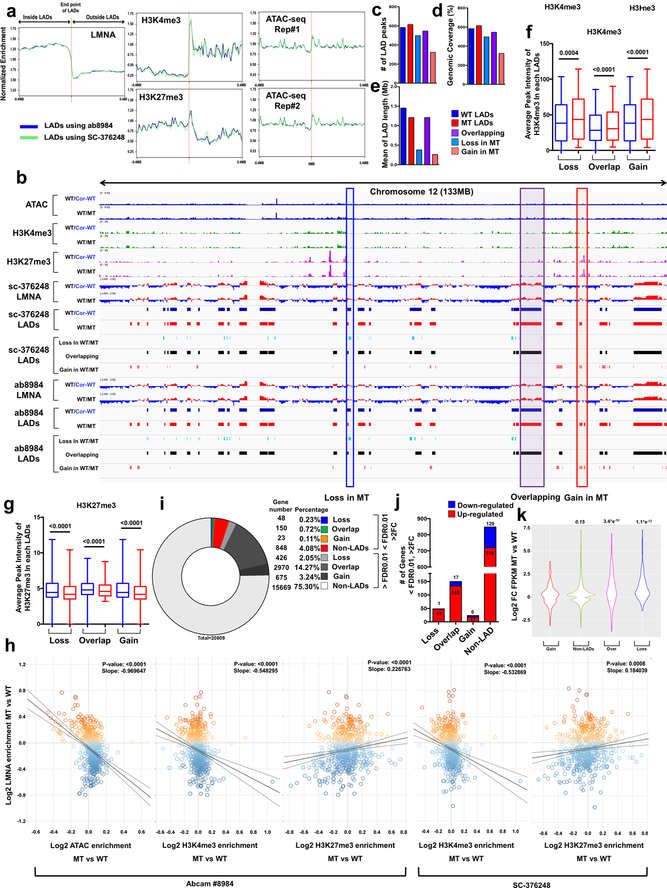
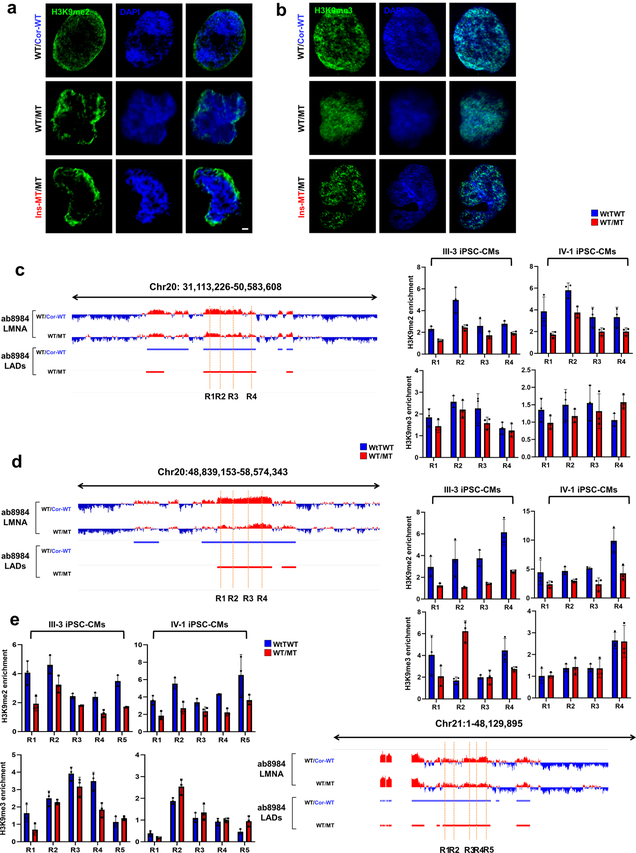
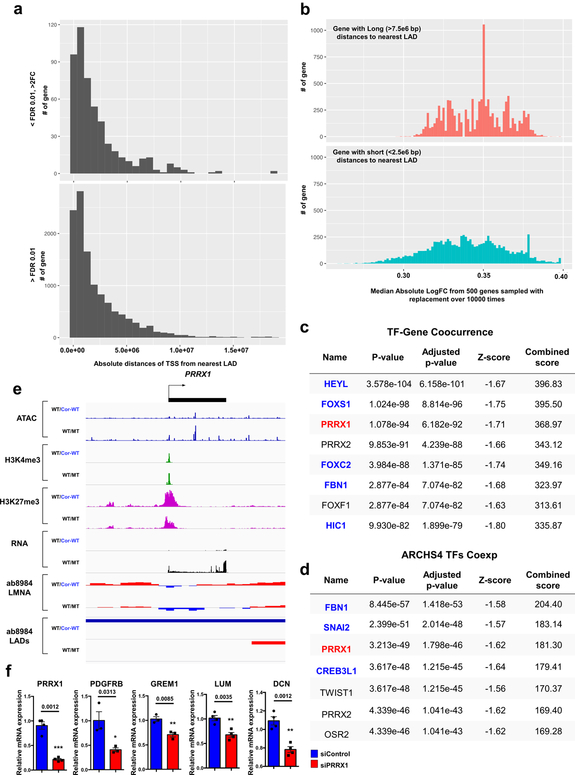
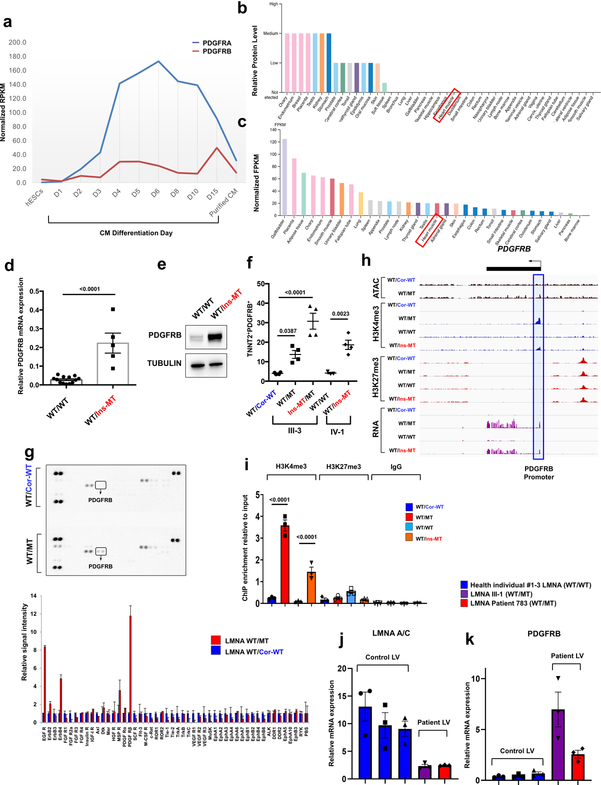
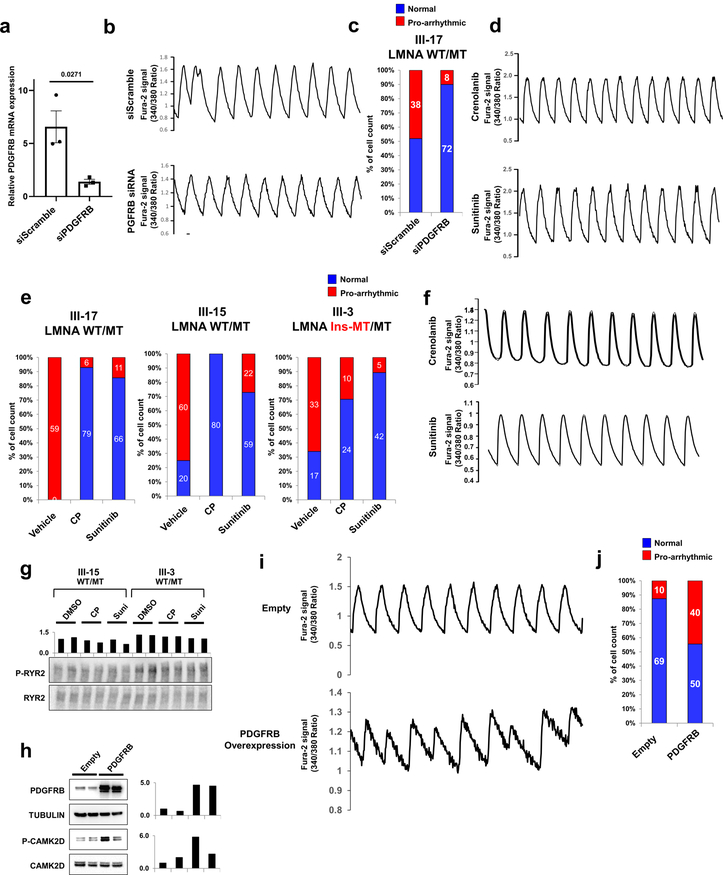
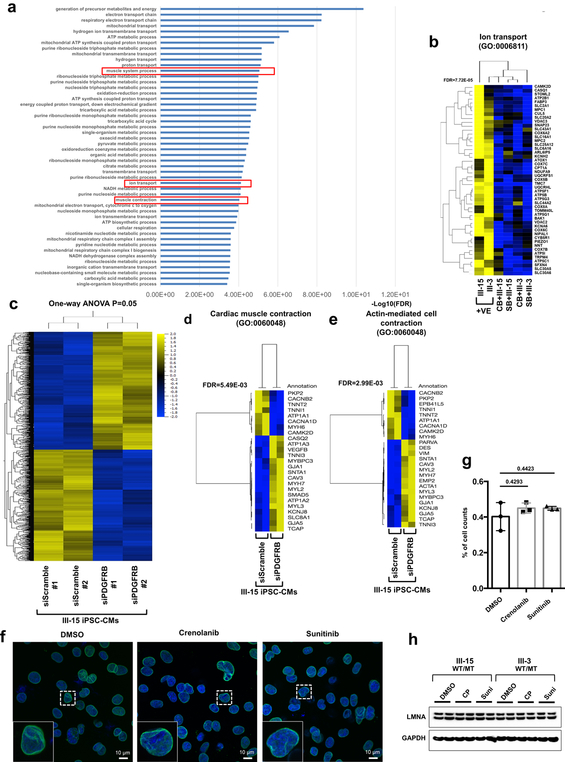
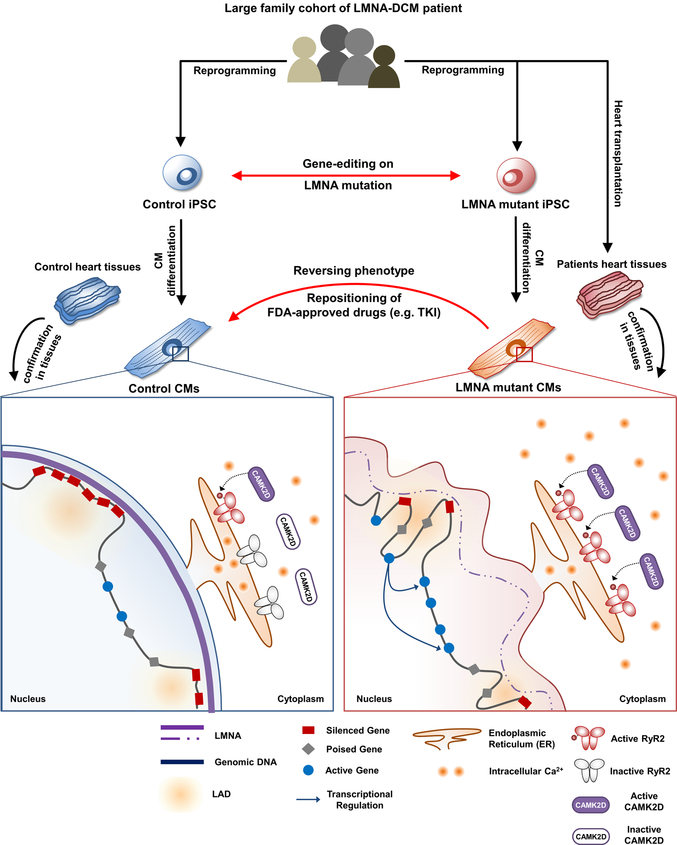
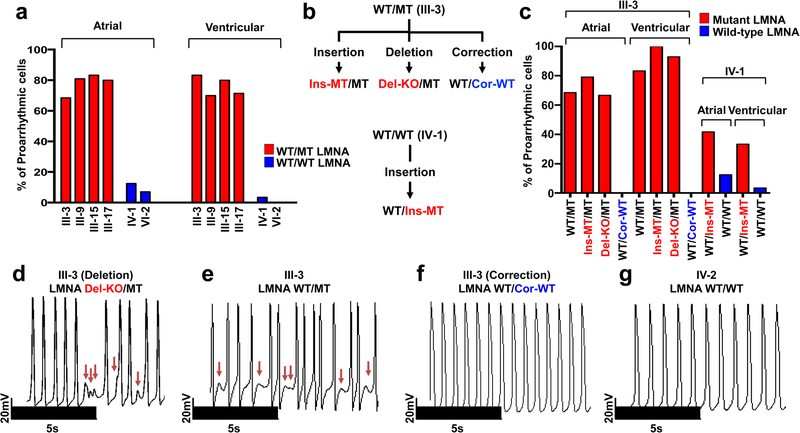
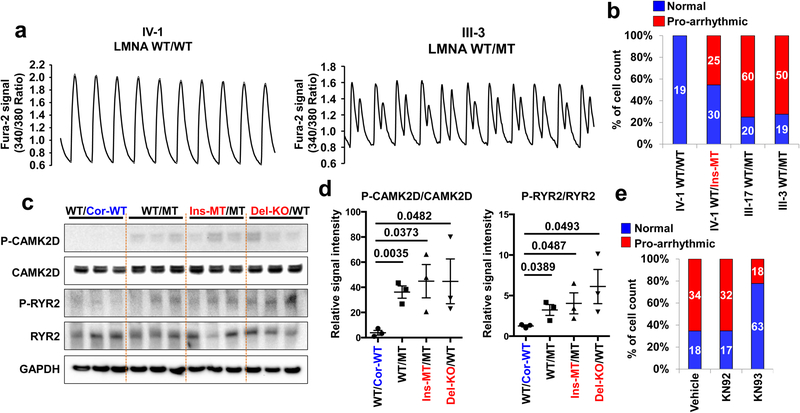
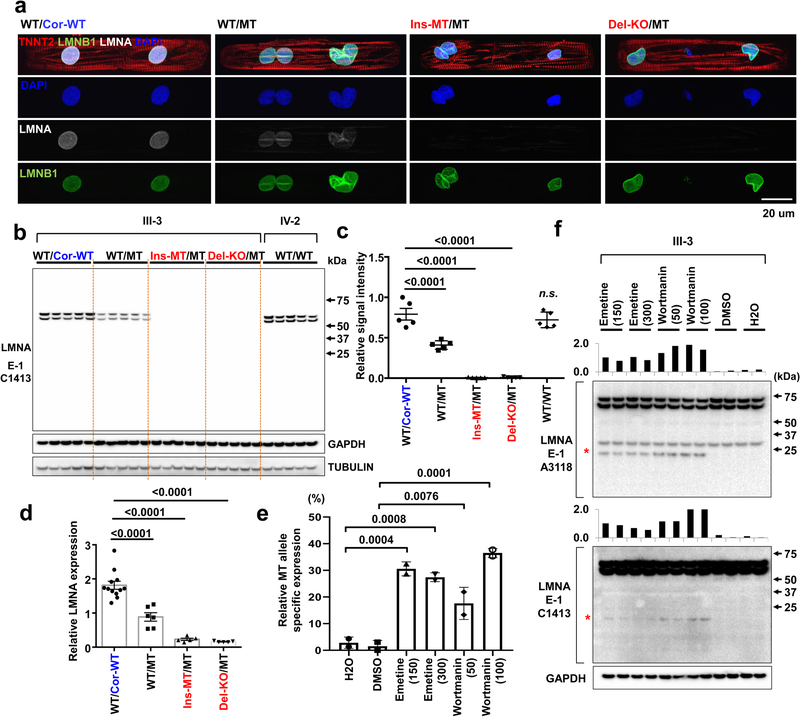
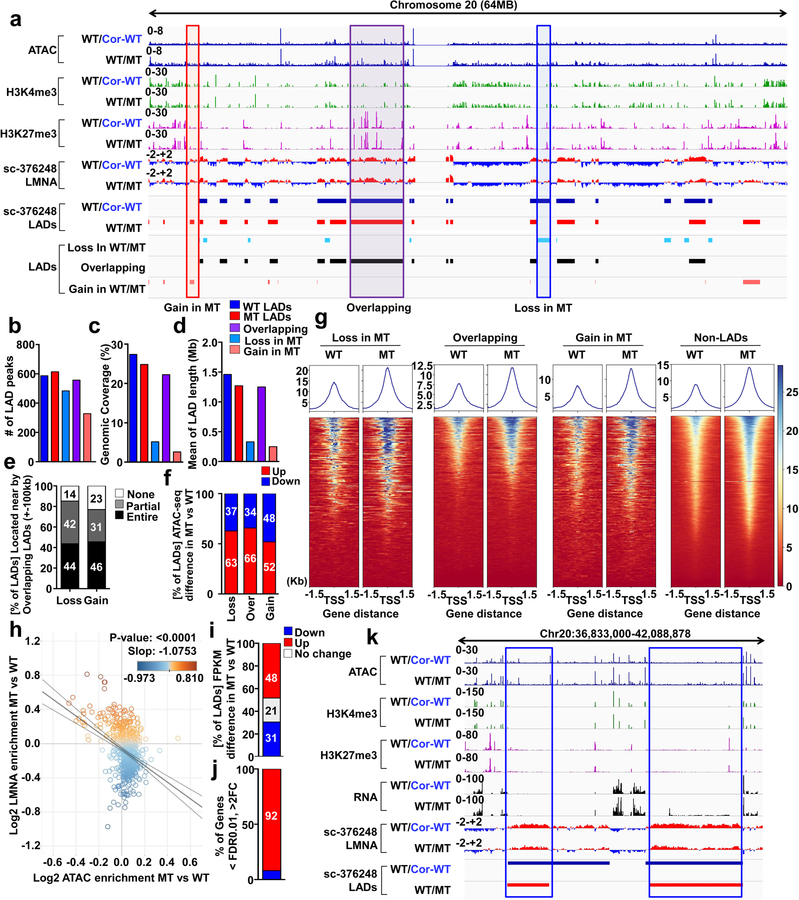
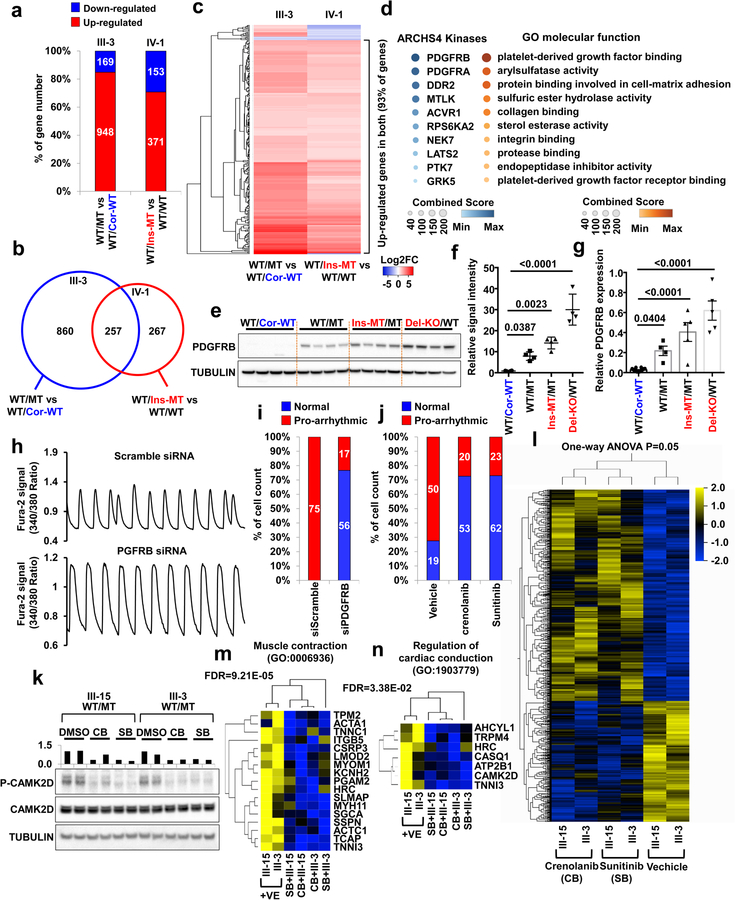
Lamin A/C (LMNA) is one of the most frequently mutated genes associated with dilated cardiomyopathy (DCM). DCM related to mutations in LMNA is a common inherited cardiomyopathy that is associated with systolic dysfunction and cardiac arrhythmias. Here we modelled the LMNA-related DCM in vitro using patient-specific induced pluripotent stem cell-derived cardiomyocytes (iPSC-CMs). Electrophysiological studies showed that the mutant iPSC-CMs displayed aberrant calcium homeostasis that led to arrhythmias at the single-cell level. Mechanistically, we show that the platelet-derived growth factor (PDGF) signalling pathway is activated in mutant iPSC-CMs compared to isogenic control iPSC-CMs. Conversely, pharmacological and molecular inhibition of the PDGF signalling pathway ameliorated the arrhythmic phenotypes of mutant iPSC-CMs in vitro. Taken together, our findings suggest that the activation of the PDGF pathway contributes to the pathogenesis of LMNA-related DCM and point to PDGF receptor-β (PDGFRB) as a potential therapeutic target.


Figures

Extended Data Fig. 1.
Extended Data Fig. 1.. LMNA mutant iPSC-CMs can recapitulate arrhythmic phenotype of LMNA-DCM patient.
a, Schematic pedigree of the family carrying LMNA mutation. Patients (III-1, III-3, III-9, III-15, and III-17) and healthy individuals (IV-1 and IV-2) recruited for this study are numbered. Circles represent female family members and squares represent males. “+” and “-” signs underneath family members indicate the presence or absence of the LMNA mutation, respectively. b, Schematic view of C349Gin frameshift mutation in LMNA gene. c, Genotyping of fibroblasts derived from patients and healthy controls. d, Clinical features of patients and healthy individuals. e, Electrocardiogram (EKG) of patients (III-1 and III-3) and healthy individual (IV-1). The EKG data was measured one time for each patient. f, g, Electrophysiological measurements of spontaneous action potentials in mutant iPSC-CMs (III-15 and III-17) recorded by patch clamp in current-clamp mode. The experiments were repeated three times independently with similar results.
Extended Data Fig. 2.
Extended Data Fig. 2.. LMNA mutation as a cause of arrhythmic phenotype in LMNA mutant iPSC-CMs.
a, Gene editing strategy using TALEN method. The piggyBac system was utilized to generate isogenic lines as previously described,. b, Genotyping of gene-edited isogenic lines (III-3; corrected, insertion, deletion) (IV-1 insertion). For LMNA Del-KO/MT, we utilized TALEN pairs that target the start codon of the LMNA gene. Genotyping showed C insertion in wild-type allele that reads early stop codon. c, Immunostaining of NANOG (Red), POU5F1 (Red), and SOX2 (Red) in iPSC lines. Blue signal represents DAPI. Scale bar, 10 μm. The experiments in c were repeated twice independently with similar results. d-f, Electrophysiological recordings of spontaneous action potentials in control (IV-1) and mutant iPSC-CMs (III-9, isogenic IV-1; WT/Ins-MT) measured by patch clamp in current-clamp mode. Red arrows indicate DAD-like arrhythmias. The experiments were repeated three times independently with similar results. g. EP parameters. MDP: maximal diastolic potential; APA: action potential amplitude; APD: action potential duration at 50%, 70%, 90% of repolarization; bpm: beats per minute.
Extended Data Fig. 3.
Extended Data Fig. 3.. Abnormal calcium handling in LMNA mutant iPSC-CMs.
a, Confocal imaging of Fluo-4AM calcium events in control (III-3; WT/Cor-WT) and mutant (III-3; WT/MT) iPSC-CMs while being treated with increasing extracellular Ca2+ concentration. All representative traces were the recordings from 3 individual cells (presented as red, blue, and black). b, Spontaneous calcium event per 100s of control and mutant iPSC-CMs in each different extracellular Ca2+ concentration. c, Summary of the percentage of cells exhibiting spontaneous SR Ca2+ release events in control and mutant iPSC-CMs. d, Real-time analysis of CAMK2D and RYR2 expression in control and mutant iPSC-CMs. Data are expressed as mean ± s.e.m. e, f, Immunoblot analysis of phospho-RYR2, RYR2, phospho-CAMK2D, and CAMK2D protein levels in control and mutant iPSC-CMs. Data are expressed as mean ± s.e.m., and a two-tailed Student’s t-test was used to calculate P values. n=3. Numbers above the line show significant P values. g, Real-time PCR analysis of CAMK2D expression in control and mutant iPSC-CMs. Expression level of GAPDH was used as control. Data are expressed as mean ± s.e.m., and a two-tailed Student’s t-test was used to calculate P values. n=8. h, Representative Ca2+ transients of mutant iPSC-CMs (III-3; WT/MT) treated with 1 uM of KN92 or KN93 for 24 hr. i, Quantification of the percentage of cells exhibiting arrhythmic waveforms in mutant iPSC-CMs (III-17 and WT/MT) at basal level, as well as after the treatment with 1 uM of KN92 or KN93 for 24 hr. j, Immunoblot analysis of phospho-RYR2, RYR2, phospho-CAMK2D and CAMK2D protein levels with treatment of DMSO, KN92 or KN93 for 24 hr. The experiments in a were repeated twice independently with similar results. The Ca2+ transients in h were repeated as described in figure 2e independently with similar results. The Immunoblot data in e and j was repeated twice independently with similar results.
Extended Data Fig. 4.
Extended Data Fig. 4.. Down-regulation of mutant mRNA through NMD pathway in LMNA-mutant iPSC-CMs.
a, Quantification of cells showing abnormal nuclear structure in control and mutant iPSC-CMs. The images were recorded from three differentiation batches. n=215 (WT/Cor-WT), n=286 (WT/MT), n=222 (Ins-MT/MT), n=280 (Del-KO/MT). b, Representative confocal images of control and mutant lines. Micro-patterned CMs were stained with specific antibodies for TNNT2 (Red), LMNA (White) and LMNB1 (Green). Blue signal represents DAPI. Scale bar, 20 μM. The experiments were repeated three times independently with similar results. c, Quantification of cells showing abnormal nuclear structure in control and mutant iPSC-CMs. The images were recorded from three differentiation batches. Data are expressed as mean ± s.e.m., and a two-tailed Student’s t-test was used to calculate P values. n=3. Total counted cell numbers are 175 (WT/WT) and 203 (WT/Ins-MT). Numbers above the line show significant P values. d, Immunoblot analysis of LMNA protein level in control and mutant iPSC-CMs. e, Quantification of signal intensity of LMNA band in (d). Data are expressed as mean ± s.e.m., and statistical significance was obtained using one-way ANOVA. Numbers above the line show significant P values. n=10 (WT/WT), n=7 (WT/Ins-MT), n=5 (WT/MT). f, Immunoblot analysis of LMNA protein level in two different clones of control and mutant iPSC-CMs. Two different antibodies recognizing N-terminal of LMNA were used. GAPDH was used as loading control. g, Relative mRNA expression of total LMNA in control and mutant iPSC-CMs. Data are expressed as mean ± s.e.m., and a two-tailed Student’s t-test was used to calculate P values. Numbers above the line show significant P values. n=10 (WT/WT), n=7 (WT/Ins-MT). h, Confirmation of allele-specific primers using plasmid carrying wild-type LMNA or mutant LMNA. Digital PCR using allele specific primers detected the ratio of wild-type/mutant-type LMNA, which was consistent with ratio of wild-type/mutant-type plasmids. Data are expressed as mean ± s.d. n=3 i, Immunoblot analysis of cell lysates from mutant iPSC-CMs treated with emetine and wortmannin. Two different batches of antibodies were used. Red asterisk represents truncated LMNA protein having 14 kD size. j, Immunoblot analysis of cell lysates from mutant iPSC-CMs treated with wortmannin. Three different batches of E-1 antibody detect the N-terminal of LMNA, and 131C3 antibody detects the C-terminal. k, Immunoblot analysis of cell lysates from control iPSC-CMs treated with emetine and wortmannin. The experiments in f, i-k were repeated twice independently with similar results.
Extended Data Fig. 5.
Extended Data Fig. 5.. Haploinsufficiency of LMNA results in abnormal distribution of open chromatin in LMNA-mutant CMs.
a-f, Representative images and normalized signal intensity of ATAC-see and DAPI of control and mutant iPSC-CMs. Data were obtained from different patient lines, including Patient III-3 and its isogenic lines (a, b); Control IV-1 and its isogenic line (c, d); and Patient III-15 (e, f) for normalized signal intensity of ATAC-see and DAPI. Data are expressed as mean ± s.e.m. g, Correlation of signal distribution between ATAC-see and DAPI. n=42 (WT/WT), n=28 (WT/Cor-WT), n=33 (Del-KO/MT), n=32 (Ins-WT/WT), n=25 (WT/MT) for normalized signal intensity of ATAC-see and DAPI. Data are mean and minima to maxima, and two-tailed Student’s t-test was used to calculate P values. The experiments in a, c, and e were repeated three times independently with similar results.
Extended Data Fig. 6.
Extended Data Fig. 6.. Genomic and chromatin features of LADs in control and mutant iPSC-CMs.
a, Normalized enrichment of LMNA ChIP-seq signals, histone markers (H3K4me3 and H3K27me3), and ATAC-seq signals within ± 0.4 mb of mapped LAD borders. The genomic locations of LADs were obtained from ChIP-seq on LMNA using two different antibodies (Abcam #8984; blue line, SC-376248; green line) in control iPSC-CMs (III-3). b, Representative images of ChIP-seq, ATAC-seq, and RNA-seq of chromosome 12 (133 MB). Red box represents LAD explicitly called in mutant iPSC-CMs (Gain). Purple box represents LADs called in both control and mutant iPSC-CMs (Overlapping). Blue box represents LADs explicitly called in control iPSC-CMs (Loss). c-e, (c) Number, (d) Genomic Coverage, and (e) Mean of length of LADs in control, mutant, gain, overlapping and loss LADs. ChIP-seq on LMNA (Abcam #8984) was used for data analysis. f, g, Average peak intensity of H3K4me3 and H3K27me3 of each LAD. n=184 (Loss), n=370 (Overlap), n=184 (Gain) for H3K4me3. n=273 (Loss), n=504 (Overlap), n=273 (Gain) for H3K27me3. Data are mean and minima to maxima, and Wilcoxon matched pairs signed rank test was used to calculate P values. h, Scatter plot of normalized LMNA, ATAC and histone markers (H3K4me3 and H3K27me3) enrichment of each LAD. Y-axis represents log2 relative normalized LMNA enrichment of each LAD in mutant iPSC-CMs as compared to control iPSC-CMs. X-axis represents log2 relative normalized ATAC and histone marks enrichment of each LAD in mutant iPSC-CMs as compared with control iPSC-CMs. Each data point represents one LAD. The statistical significance was obtained using one-way ANOVA. n=587 for SC-376248 and n=585 for Abcam #8984. i, percentage of differentially expressed gene in mutant iPSC-CMs as compared to control iPSC-CMs. j, Number of differentially expressed genes located in mutant iPSC-CMs as compared to control iPSC-CMs. (FDR <0.01; Log2FC >1 or <−1). k, Distribution of Log2 fold-change of FPKM in control and mutant iPSC-CMs. Statistical tests: Non-parametric Kruskal Wallis (testing for two-sided differences) followed by Dunn’s post-hoc for multiple comparison adjustment. n=266 (Gain), n=8171 (Non-LADs), n=835 (Overlap), n=206 (Loss).
Extended Data Fig. 7.
Extended Data Fig. 7.. Abnormal distribution of H3K9methylation in mutant iPSC-CMs.
a, b, Representative images of IF staining of control mutant iPSC-CMs. iPSC-CMs were stained with specific antibodies for H3K9me2 or H3K9me3 (Green). Blue signal represents DAPI. Scale bar, 1000 nM. The experiments were repeated three times independently with similar results. c-e, Representative images of LMNA enrichment and LAD distribution of ChIP-seq data. ChIP-qPCR analysis of H3K9me2 and H3K9me3 enrichment on LAD region. Data are expressed as mean ± s.d. n=3.
Extended Data Fig. 8.
Extended Data Fig. 8.. TFs altered by haploinsufficiency of LMNA contribute to the activation of genes located outside LADs.
a, Distribution of absolute distances to the nearest LAD (by nucleotide distance) from the TSS of genes that are differentially expressed (upper) or that show no significant difference in expression between mutant and control iPSC-CMs. b, Distribution of median absolute log2FC from genes with relatively long (>7.5e6 bp) distances to the nearest LAD (upper) and genes with relatively short (<2.5e6 bp) distances to the nearest LAD (lower). In each category, 500 genes were sampled with replacement over 10,000 times. c, d, TF-Gene Co-occurrence and ARCHS4 TFs Coexpression analyses of differentially expressed genes located in non-LADs. Blue color represents gene located in non-LADs. Black color represents no significant gene expression difference between control and mutant iPSC-CMs. Red color represents genes located in LADs and highly expressed in mutant iPSC-CMs as compared with control iPSC-CMs. Top 200 differentially expressed genes located in non-LADs were used for the analysis. e, Representative images of ChIP-seq, ATAC-seq, and RNA-seq of PRRX1 genomic region. f, Relative mRNA expression of PRRX1, PDGFRB, GREM1, LUM and DCN in mutant iPSC-CMs treated with scramble or PRRX1 siRNA. Data are expressed as mean ± s.e.m., and a two-tailed Student’s t-test was used to calculate P values. n=3 (PDGFRB, GREM1), n=4 (DCN, LUM, PRRX1). Numbers above the line show significant P values.
Extended Data Fig. 9.
Extended Data Fig. 9.. PDGFRB is up-regulated in LMNA-mutant iPSC-CMs.
a, Expression levels of PDGFRA and PDGFRB during human iPSC-CM differentiation process. The data were adapted from GSE76523. b, c, Protein and RNA levels of PDGFRB in human tissues. The data were adapted from Protein and RNA Atlas Database. d, Real-time PCR analysis of PDGFRB expression in LMNA-mutant and control iPSC-CMs. Data are expressed as mean ± s.e.m., and a two-tailed Student’s t-test was used to calculate P values. n=13 (WT/WT), n=5 (WT/Ins-MT). Numbers above the line show significant P values. e, Immunoblot analysis of PDGFRB protein levels in control versus mutant iPSC-CMs. GAPDH was used as loading control. The experiments were repeated twice independently with similar results. f, Flow cytometry analysis of TNNT2+ and PDGFRB+ cells in control and mutant iPSC-CMs. n=4. g, Kinase array of control and mutant iPSC-CMs. Fifty different protein kinases were presented in each chip. Raw images of blotting membrane (left). Two dots carried same antibody for technical duplicate. Quantification of signal intensity of each spot (right). h, Representative images of ChIP-seq, ATAC-seq, and RNA-seq on the genomic regions of PDGFRB. Blue box represents the promoter region of PDGFRB. i, ChIP-qPCR of H3K4me3 and H3K27me3 enrichment at the promoter region of PDGFRB in control and mutant iPSC-CMs. n=3. j, k, Real-time PCR analysis of LMNA and PDGFRB expression levels in left ventricle heart tissue from health controls (n=3) and LMNA-DCM patients (n=2). Data are expressed as mean ± s.e.m. The Kinase data in g was repeated twice independently with similar results. f, i, Data are expressed as mean ± s.e.m., and statistical significance was obtained using one-way ANOVA. Numbers above the line show significant P values.
Extended Data Fig. 10.
Extended Data Fig. 10.. Arrhythmic phenotype in mutant iPSC-CMs is dependent on the activation of PDGFRB pathway.
a, Real-time PCR analysis of PDGFRB expression levels in mutant iPSC-CMs (WT/MT) treated with siRNA of scramble or PDGFRB. The siRNA treated for 48 hr. Data are expressed as mean ± s.e.m., and a two-tailed Student’s t-test was used to calculate P values. n=3. Numbers above the line show significant P values. b, Representative Ca2+ transients of mutant iPSC-CMs (III-17; WT/MT) treated with scrambled siRNA or PDGFRB-specific siRNA. c, Quantification of the number of cells exhibiting arrhythmic waveforms in (b). d, Representative Ca2+ transients of mutant iPSC-CMs treated with PDGRB inhibitors, crenolanib (100 nM) and sunitinib (500 nM), for 24 hr. All traces were recorded for 20 sec. e, Quantification of mutant iPSC-CMs (III-17, III-15, and III-3) exhibiting arrhythmic waveforms with or without the treatment of PDGRB inhibitors, crenolanib (100 nM) and sunitinib (500 nM), for 24 hr. f, Representative Ca2+ transients of mutant iPSC-CMs (III-17; WT/MT) treated with PDGFRB inhibitors. g, Immunoblot analysis of phospho-RYR2 and RYR2 protein levels with treatment of DMSO, Crenolanib or Sunitinib. The data were repeated twice independently with similar results. h, immunoblot analysis of PDGFRB, Tubulin, phospho-CAMK2D, and CAMK2D protein levels in control iPSC-CMs expressing Empty and PDGFRB constructs. The experiments were repeated twice independently with similar results. i, Representative Ca2+ transients of iPSC-CMs expressing Empty and PDGFRB constructs. j, Quantification of arrhythmic waveforms of iPSC-CMs in (i). The Ca2+ transients in b, d, f and i were repeated as described in c, e and j independently with similar results.
Extended Data Fig. 11.
Extended Data Fig. 11.. Gene expression profile of PDGFRB inhibition in LMNA-mutant iPSC-CMs.
a, GO analysis of down-regulated genes (n=352) in LMNA-mutant iPSC-CMs treated with PDGFRB inhibitor, crenolanib (100 nM) and sunitinib (500 nM), for 24 hr. b, Heat-map of expression profile of gene set related with GO function of Ion transport. The FDR values were obtained from GO enrichment analysis tool. c, Hierarchical clustering of AmpliSeq RNA-sequencing data under one-way ANOVA (p = 0.05) (n=230). Two different siRNAs for PDGFRB and scramble in LMNA-mutant iPSC-CMs (III-15; WT/MT). d, e, Heat-map of expression profile of gene (n=25) sets related with GO function of cardiac muscle contraction and actin-mediated cell contraction. The FDR values were obtained from GO enrichment analysis tool. f, No significant changes in abnormal nuclear structure of mutant iPSC-CMs by inhibition of PDGFRB were found. Representative images of mutant iPSC-CMs treated with PDGFRB inhibitor, crenolanib (100 nM) and sunitinib (500 nM), for 24 hr. iPSC-CMs were stained with specific antibodies for LMNB1 (Green). Blue signal represents DAPI. Scale bar, 10 μM. The experiments were repeated three times independently with similar results. g, Quantification of cells showing abnormal nuclear structure in mutant iPSC-CMs treated with PDGFRB inhibitor. The images were recorded from three differentiation batches. n=90 (DMSO), n=69 (Crenolanib), n=79 (Sunitinib). Data are expressed as mean ± s.e.m., and statistical significance was obtained using one-way ANOVA. Numbers above the line show P values. h, Immunoblot analysis of LMNA and GAPDH protein levels in mutant iPSC-CMs treated with PDGFRB inhibitor. The experiments were repeated twice independently with similar results.
Extended Data Fig. 12.
Extended Data Fig. 12.. Proposed disease model of LMNA-DCM.
We recruited a large family cohort with DCM and generated patient-specific induced pluripotent stem cells (iPSCs) from several patients (n=5) and healthy individuals (n=2). We next utilized gene-edited isogenic iPSC lines (n=4) and patient heart tissues to address the intriguing question why patients with LMNA-DCM have increased manifestation of cardiac arrhythmias. The electrophysiological studies of mutant iPSC-derived cardiomyocytes (iPSC-CMs) demonstrated that LMNA mutation was the cause of increased arrhythmogenicity in LMNA-mutant iPSC-CMs. We also found that the LMNA mutation caused haploinsufficiency in LMNA, which led to abnormal calcium homeostasis in mutant iPSC-CMs through up-regulation of calcium handling genes. Whole transcriptome profiling (RNA-seq) further demonstrated an abnormal activation of PDGF pathway in mutant iPSC-CMs. The inhibition of PDGF signal pathway by treatment of siRNA or FDA-approved drugs such as sunitinib and crenolanib could rescue the arrhythmic phenotype of LMNA-mutant iPSC-CMs. Cross-analysis of various ChIP-seq, ATAC-seq, and RNA-seq revealed a possible underlying mechanism that haploinsufficiency of LMNA could disrupt global chromatin conformation, resulting in abnormal gene expression of mutant iPSC-CMs. These findings were further corroborated by studies in cardiac tissues from healthy and LMNA-DCM patients, thus validating a novel mechanism of LMNA-DCM pathogenesis both in vitro and in vivo.
Figure 1.
Figure 1.. LMNA mutation causes arrhythmic phenotype in patient specific iPSC-CMs.
a, Quantification of arrhythmic occurrence in control and mutant iPSC-CMs. b, Schematic view of genome editing strategy. c, Quantification of arrhythmic occurrence in isogenic iPSC-CMs. d-g, Electrophysiological measurements of spontaneous action potentials in parental mutant iPSC-CMs (III-3; WT/MT), isogenic mutant iPSC-CMs (III-3; Del-KO/MT), isogenic control iPSC-CMs (III-3; WT/Cor-WT), and control iPSC-CMs (IV-2; WT/WT). The experiments were repeated three times independently with similar results.
Figure 2.
Figure 2.. Abnormal calcium handling as a cause of arrhythmic phenotype in LMNA-mutant iPSC-CMs.
a, Representative Ca2+ transients of control and mutant iPSC-CMs. b, Quantification of cells exhibiting arrhythmic waveforms in control and mutant iPSC-CMs. c, d, Immunoblot analysis of phospho-RYR2, RYR2, phospho-CAMK2D, and CAMK2D levels in control and mutant iPSC-CMs. Data are expressed as mean ± s.e.m., and a two-tailed Student’s t-test was used to calculate P values. n=3. Numbers above the line show significant P values. e, Quantification of cells exhibiting arrhythmic waveforms in mutant iPSC-CMs (III-3; WT/MT) treated with 1 uM of KN92 or KN93 for 24 hr. All traces were recorded for 20 sec. The Ca2+ transients in a were repeated as described in b independently with similar results. The Immunoblot data in c were repeated twice independently with similar results.
Figure 3.
Figure 3.. NMD pathway-mediated suppression of LMNA-mutant mRNA leads to haploinsufficiency of LMNA in mutant CMs.
a, Representative confocal images of control and mutant lines. Micro-patterned CMs were stained with specific antibodies for TNNT2 (Red), LMNA (White), and LMNB1 (Green). Blue color represents DAPI. Scale bar, 20 uM. The IF data were repeated 3 times independently with similar results. b, Immunoblot analysis of LMNA protein level in control and mutant iPSC-CMs. c, Quantification of signal intensity of LMNA band in (b). n=4. d, Relative mRNA expression of total LMNA in control and mutant iPSC-CMs. n=12 (WT/Cor-WT), n=6 (WT/MT), n=5 (Ins-MT/MT and Del-KO/MT). e, Digital PCR analysis of allele specific expression of LMNA in mutant iPSC-CMs treated with emetine (150 or 300 mcg/mL for 6 hr) and wortmannin (50 or 100 mM for 6 hr). n=2. Data are expressed as mean ± s.d., and statistical significance was obtained using one-way ANOVA. f, Immunoblot analysis of cell lysates from mutant iPSC-CMs treated with emetine and wortmannin. Two different batches of antibodies were used. Red asterisk represents truncated LMNA protein (about 14 kD size). Bar graph represents of signal intensity of truncated LMNA protein. The IB data in b and f were repeated twice independently with similar results. c-e, Data are expressed as mean ± s.e.m., and statistical significance was obtained using one-way ANOVA.
Figure 4.
Figure 4.. Haploinsufficiency of LMNA results in reduced LMNA enrichment and increased open chromatin formation of each LAD.
a, Representative images of ChIP-seq, ATAC-seq, and RNA-seq of chromosome 20. b-d, (b) Number, (c) Genomic Coverage, and (d) Mean of length of LADs in control, mutant, Gain, Overlapping and Loss LADs. e, Location of LADs of Loss or Gain category. LADs located within ±100 kb of overlapping LADs are showed as “Entire”. LADs partially shared with ±100kb of overlapping LADs are showed as “Partial”. LADs located outside of ±100kb of overlapping LADs are shown as “None”. f, Comparison of normalized ATAC enrichment of each LAD in control and mutant iPSC-CMs. Red represents the percentage of LADs showing up-regulated normalized ATAC enrichment in mutant iPSC-CMs as compared to control iPSC-CMs. g, Normalized ATAC-seq signal intensity around the TSS of genes located in each LAD category. h, Scatter plot of normalized LMNA and ATAC enrichment of each LAD (n=588). Y-axis represents log2 relative normalized LMNA enrichment of each LAD in mutant iPSC-CMs as compared to control iPSC-CMs. X-axis represents log2 relative normalized ATAC enrichment of each LAD in mutant iPSC-CMs as compared to control iPSC-CMs. One dot represents one LAD. i, Comparison of normalized FPKM of each LAD in control and mutant iPSC-CMs. Red represents the percentage of LADs showing up-regulated normalized FPKM in mutant iPSC-CMs as compared to control iPSC-CMs. j, Percentage of differentially expressed genes located in LADs. (FDR <0.01; Log2FC >1 or <−1). k, Representative images of ChIP-seq, ATAC-seq, and RNA-seq. Blue box represents the LAD showing lower LMNA enrichment and higher expression in mutant iPSC-CMs as compared to control iPSC-CMs.
Figure 5.
Figure 5.. Abnormal activation of PDGFRB is required for arrhythmic phenotype in mutant iPSC-CMs.
a, Number of differentially expressed genes in mutant iPSC-CMs as compared to control iPSC-CMs. LMNA WT/MT and LMNA WT/Cor-WT were derived from patient III-3. LMNA WT/WT, and WT/Ins-MT were generated form health control IV-1. b, Venn diagram of differentially expressed genes in mutant iPSC-CMs as compared to control iPSC-CMs. c, Heatmaps of log2 fold-change of 257 differentially expressed genes in mutant iPSC-CMs as compared to control iPSC-CMs. d, Gene ontology and ARCHS4 Kinase Coexpression analysis of differential expressed genes. Color code indicates combined score of FDR and Z-score. e, Immunoblot analysis of PDGFRB in control and mutant iPSC-CMs. f, Quantification of signal intensity of LMNA in (e). n=4. g, Real-time PCR analysis of PDGFRB expression levels in control and mutant iPSC-CMs. n=8 (WT/Cor-WT), n=4 (WT/MT), n=5 (Ins-MT/MT, Del-KO/MT). h, Representative Ca2+ transients of mutant iPSC-CMs treated with siRNA for scramble or PDGFRB. All traces were recorded for 20 sec. i, Quantification of cells exhibiting arrhythmic waveforms of (h). j, Quantification of cells exhibiting arrhythmic waveforms of Ca2+ transients of mutant iPSC-CMs treated with PDGRB inhibitors, crenolanib (100 nM) and sunitinib (500 nM), for 24 hr. k, Immunoblot analysis of phospho-CAMK2D and CAMK2D protein levels with treatment of DMSO, Crenolanib or Sunitinib. The data were repeated twice independently with similar results. l, Hierarchical clustering of Ampli-Seq data under one-way ANOVA (p=0.05). Two different LMNA-mutant iPSC-CMs lines treated with crenolanib, sunitinib or vehicles were subjected to RNA-seq. Total number of genes is 915. m, n, GO analysis identified set of genes that related with muscle contraction and regulation of cardiac conduction. f, g, Data are expressed as mean ± s.e.m., and statistical significance was obtained using one-way ANOVA. The Ca2+ transients of h were repeated as described in i independently with similar results.

Comment in

References

    1. Carmosino M et al. Role of nuclear Lamin A/C in cardiomyocyte functions. Biol. Cell 106, 346–358 (2014). - PubMed
    1. Fatkin D et al. Missense Mutations in the Rod Domain of the Lamin A/C Gene as Causes of Dilated Cardiomyopathy and Conduction-System Disease. New England Journal of Medicine 341, 1715–1724 (1999). - PubMed
    1. Krohne G & Benavente R The nuclear lamins. Experimental Cell Research 162, 1–10 (1986). - PubMed
    1. Hershberger RE & Morales A LMNA-Related Dilated Cardiomyopathy in GeneReviews(®) (eds. Pagon RA et al.) (University of Washington, Seattle, 1993).
    1. Hershberger RE, Hedges DJ & Morales A Dilated cardiomyopathy: the complexity of a diverse genetic architecture. Nat Rev Cardiol 10, 531–547 (2013). - PubMed

Publication types

MeSH terms