. 2019 Sep;573(7772):75-82.
doi: 10.1038/s41586-019-1404-z. Epub 2019 Jul 17.

Neuronal vulnerability and multilineage diversity in multiple sclerosis

Affiliations

Neuronal vulnerability and multilineage diversity in multiple sclerosis

Lucas Schirmer et al. Nature. 2019 Sep.

Abstract

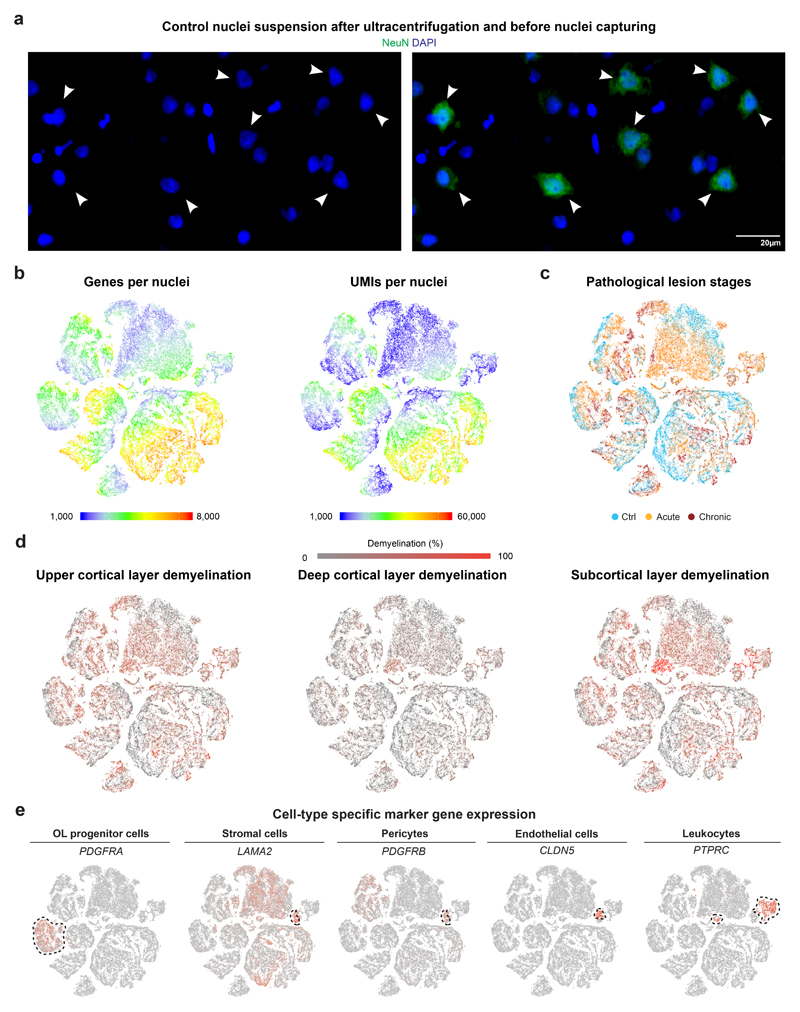
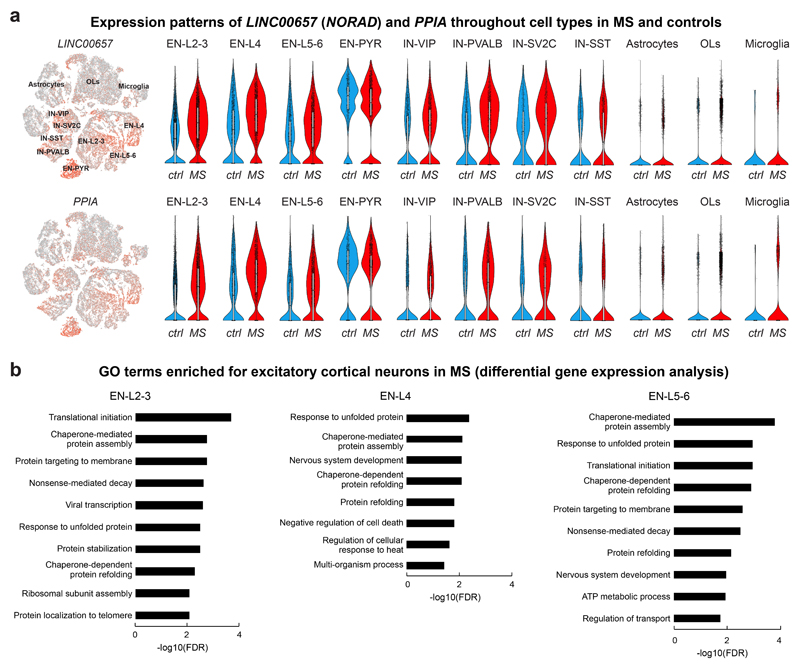
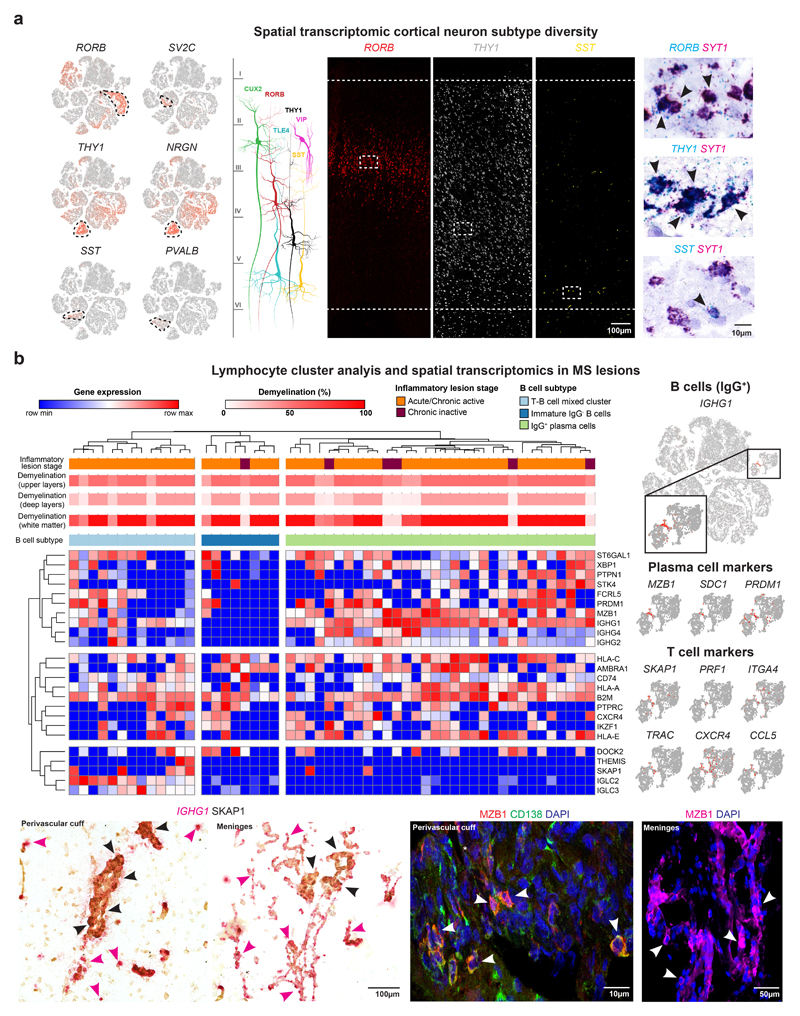
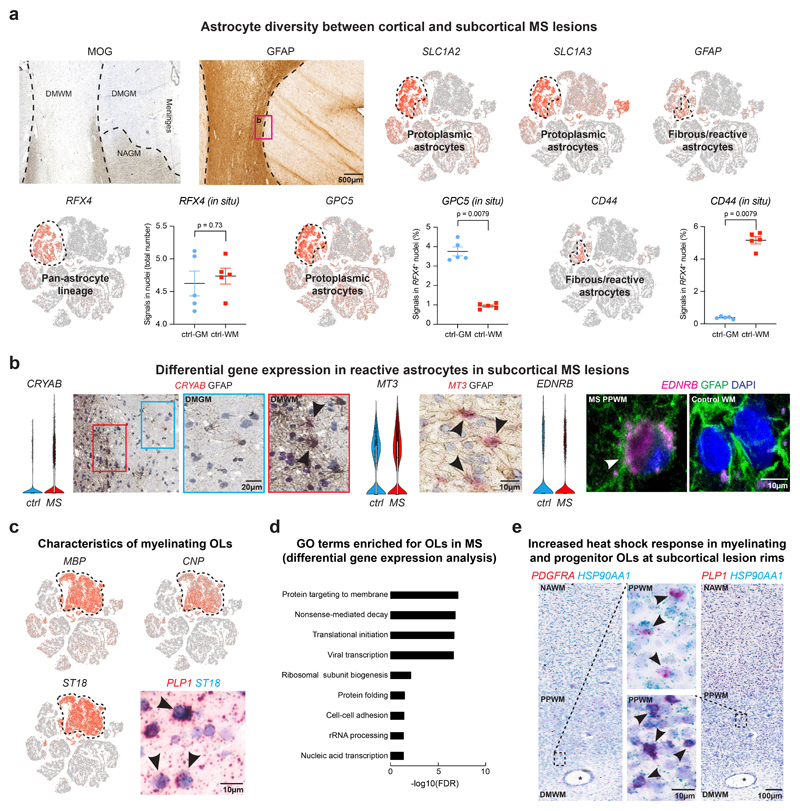
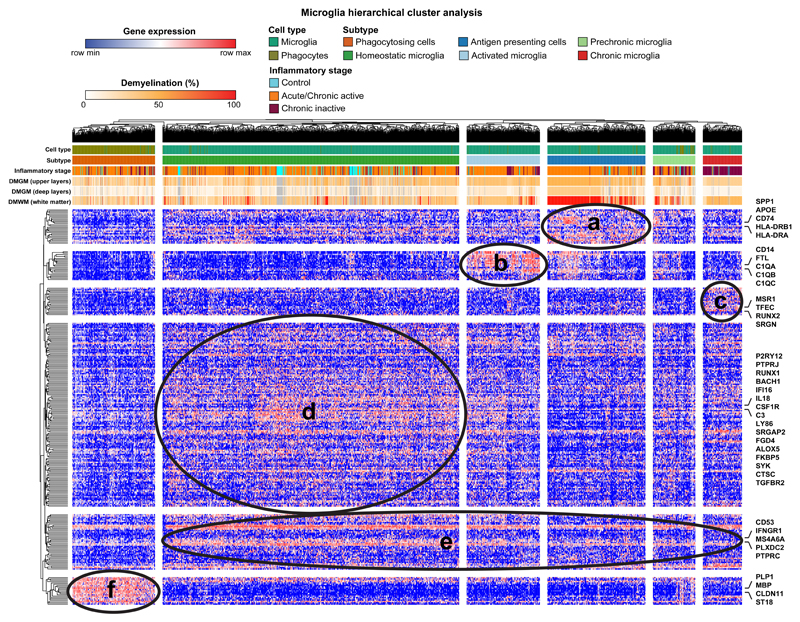
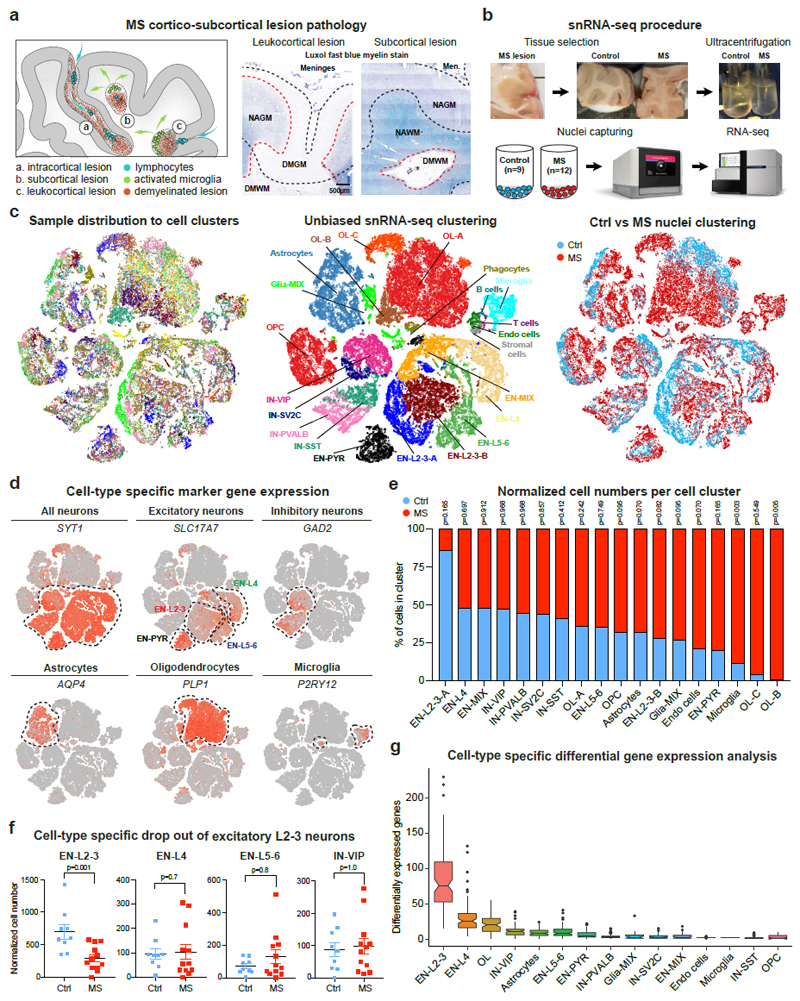
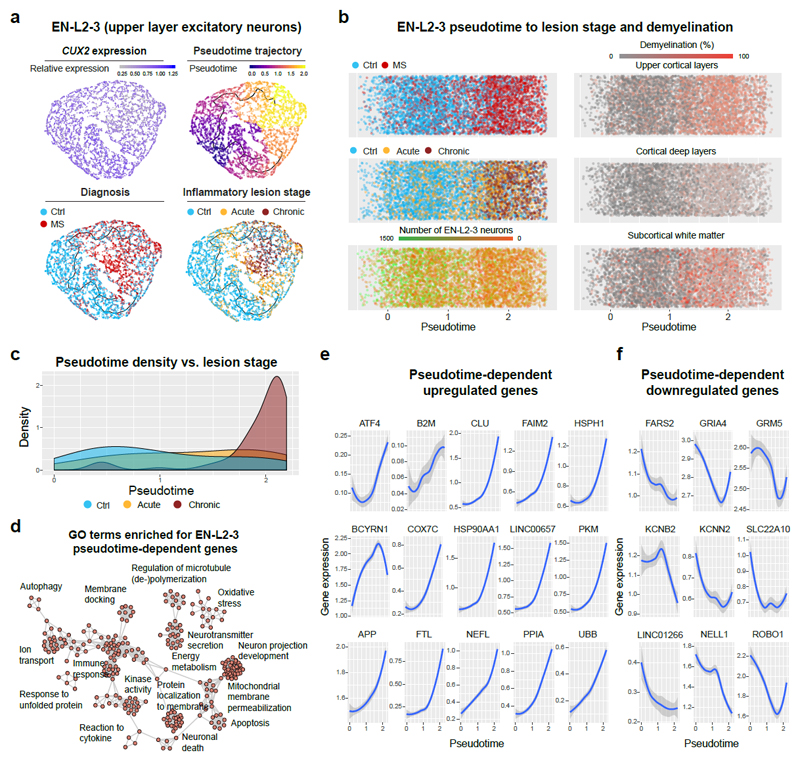
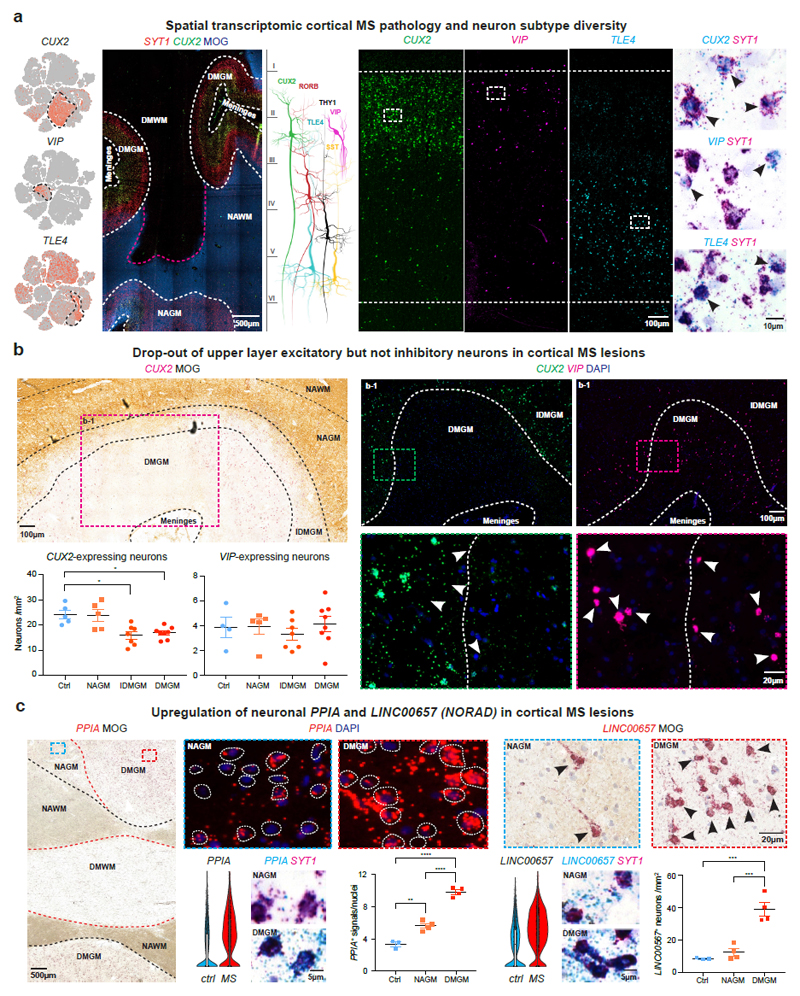
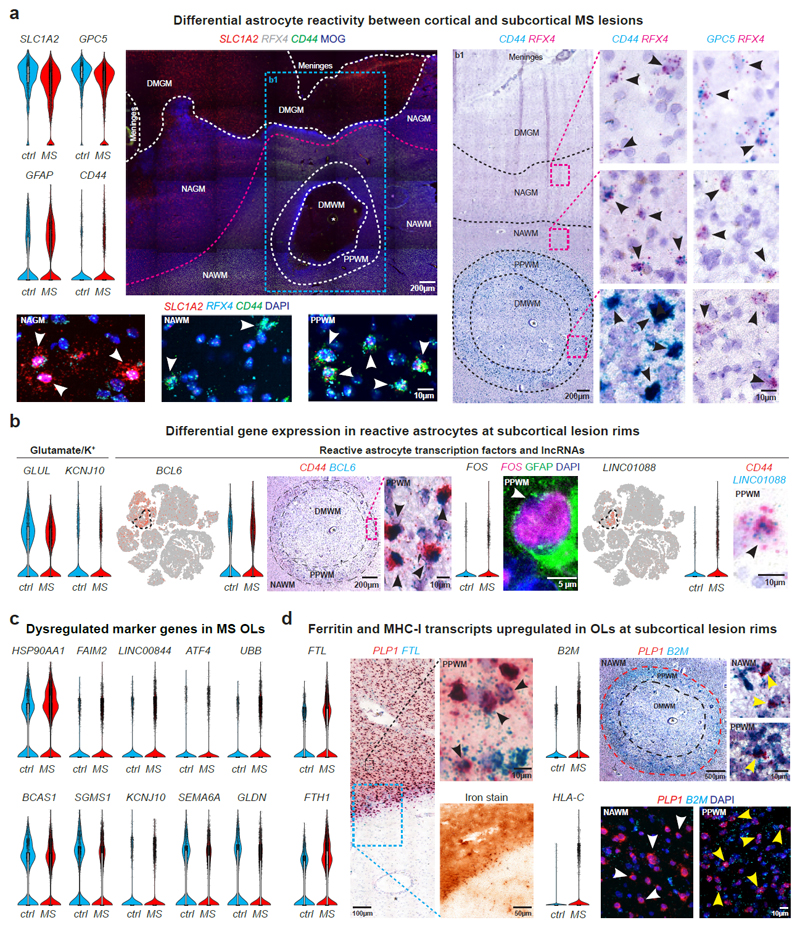
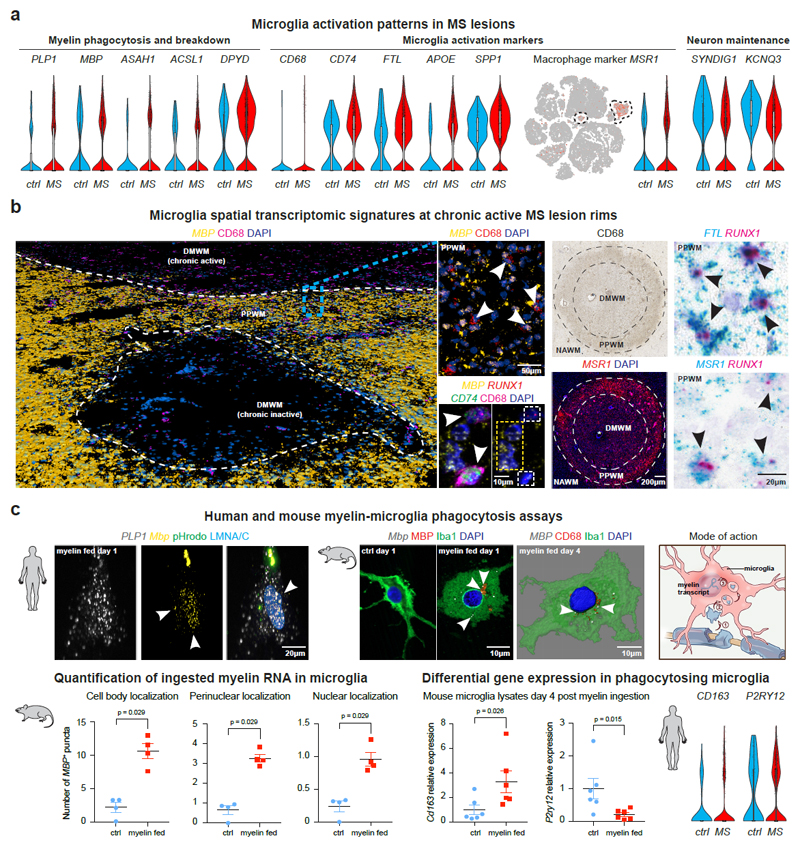
Multiple sclerosis (MS) is a neuroinflammatory disease with a relapsing-remitting disease course at early stages, distinct lesion characteristics in cortical grey versus subcortical white matter and neurodegeneration at chronic stages. Here we used single-nucleus RNA sequencing to assess changes in expression in multiple cell lineages in MS lesions and validated the results using multiplex in situ hybridization. We found selective vulnerability and loss of excitatory CUX2-expressing projection neurons in upper-cortical layers underlying meningeal inflammation; such MS neuron populations exhibited upregulation of stress pathway genes and long non-coding RNAs. Signatures of stressed oligodendrocytes, reactive astrocytes and activated microglia mapped most strongly to the rim of MS plaques. Notably, single-nucleus RNA sequencing identified phagocytosing microglia and/or macrophages by their ingestion and perinuclear import of myelin transcripts, confirmed by functional mouse and human culture assays. Our findings indicate lineage- and region-specific transcriptomic changes associated with selective cortical neuron damage and glial activation contributing to progression of MS lesions.


Conflict of interest statement

Author information

The authors state no relevant competing interests or disclosures.

Figures

Extended Data Fig. 1
Extended Data Fig. 1. Sample and disease contribution of cell types captured by snRNA-seq.
(a) Representative images selected from nuclei suspensions (ctrl, n=9; MS, n=12) after ultracentrifugation and before capturing by 10X Genomics confirming DAPI nuclear counterstaining with presence of smaller and larger DAPI+ nuclei. Note that larger nuclei are co-stained with anti-NeuN antibody confirming neuronal origin (white arrowheads). (b) Colored t-SNE plots showing numbers of genes (left) and UMIs (right) per captured nuclei from control and MS samples. (c) Colored t-SNE plot visualizing nuclei from different lesion stages based on classic pathological MS lesion staging. (d) Colored t-SNE plots visualizing nuclei from samples with different levels of upper and deep layer cortical demyelination as well as subcortical demyelination. (e) Representative tSNE plots with cell-type specific marker genes for OL progenitor cells, stromal cells including pericytes, endothelial cells, and leukocytes. For tSNE plots, data shown from 9 control and 12 MS samples and a total of 48,919 nuclei.
Extended Data Fig. 2
Extended Data Fig. 2. Molecular changes in cortical neuron subtypes in MS lesions.
(a) NORAD and PPIA expression patterns in cortical neurons and selected glial subtypes. Note baseline expression of NORAD and PPIA in neuronal versus glial subtypes and preferential upregulation of both NORAD and PPIA in upper cortical layer excitatory neurons (EN-L2-3 and EN-L4) in MS lesion tissue versus deep cortical layer excitatory and inhibitory neurons (EN-L5-6 and IN-SST). For all tSNE and violin plots, data are shown from 9 control and 12 MS samples. For tSNE plots, data from 48,919 nuclei are shown. For EN-L2-3, EN-L4 and EN-L5-6 violin plots, data shown from 6,120, 3,125 and 3,058 nuclei. Box plots inside violin plots represent median and standard deviation of gene expression. (b) Visualization of enriched GO terms in EN-L2-3, EN-L4 and EN-L5-6 cells based on differential gene expression analysis (linear mixed model regression). Binomial test with FDR correction was utilized to calculate FDR-corrected p values using genes differentially expressed in EN-L2-3, EN-L4 and EN-L5-6 nuclei (n= 428, 364 and 327).
Extended Data Fig. 3
Extended Data Fig. 3. Cortical neuron and lymphocyte subtype analysis in MS lesions.
(a) tSNE plots for neuron subtype specific expression of RORB, THY1, NRGN, SST, SV2C and PVALB (left). LaST (ctrl, n= 5) showing layer-specific expression of neuronal RORB in intermediate cortical layer 4 and widespread expression of pyramidal neuron marker THY1 with enrichment in layer 5; note that SST-expressing interneurons preferentially map to deep cortical layers. Co-expression studies (ctrl, n= 5) with SYT1 confirm neuronal expression of RORB, THY1 and SST (black arrowheads). (b) Heatmap with hierarchical clustering of lymphocyte-associated transcripts allowing sub clustering of lymphocytes in T cells, B cells and plasma cells based on marker gene expression (upper left). tSNE plots for typical B/plasma cell and T cell marker genes enriched in lymphocyte clusters (upper right). IHC for T cell marker SKAP1 (black arrowheads mark SKAP1+ T cells) together with spatial transcriptomics for B cell-associated IGHG1 encoding immunoglobulin G1 (IgG1) (magenta-colored arrowheads; lower left); note preferential clustering of plasma cell-associated MZB1+ and IGHG1-expressing B cells (white arrowheads, lower right) in inflamed meningeal tissue versus mixed T and B cell infiltration in perivascular cuffs of subcortical lesions (lower panels). One caveat to these findings is the relatively small number of MS cases samples, which limited our ability to cluster T cell populations. For tSNE plots (a, b) and hierarchical clustering (b), data shown from 9 control and 12 MS samples. For tSNE plots, data shown for all 48,919 nuclei; for hierarchical clustering, data shown from 53 nuclei in the B cell cluster. For ISH and IHC experiments in b, representative images shown from individual tissue sections (ctrl, n= 4; MS, n= 7).
Extended Data Fig. 4
Extended Data Fig. 4. Astrocyte and oligodendrocyte cluster analysis and spatial transcriptomics in MS lesions.
(a) Differential spatial expression patterns of astroglial GFAP in subcortical versus cortical demyelination by IHC (left); tSNE plots visualizing astrocyte specific genes corresponding to all (RFX4) protoplasmic (SLC1A2, GPC5) and fibrous/reactive astrocytes (GFAP, CD44). Quantification of RFX4+ ISH signals per nuclei in GM and WM of control samples validates RFX4 as a canonical astrocyte marker (ctrl, n= 5); quantification of GPC5+ and CD44+ ISH signals per RFX4+ astrocytes confirms validates GPC5 as protoplasmic GM and CD44 as fibrous WM marker. Two-tailed Mann-Whitney tests were performed. Data presented as mean ± SEM. (b) Upregulation of astroglial CRYAB, MT3 (black arrowheads) and endothelin type B receptor transcript EDNRB (white arrowhead) in reactive astrocytes in subcortical lesions. (c) tSNE plots showing OL-specific expression of myelin genes MBP, CNP and transcription factor ST18; note co-expression of ST18 with PLP in control WM by ISH. (d) Visualization of enriched GO terms in myelinating OLs based on differential gene expression analysis. Binomial test with FDR correction was utilized to calculate FDR-corrected p values using 151 genes differentially expressed in OLs. (e) Co-expression spatial transcriptomic studies confirming upregulation of heat shock protein 90 transcript HSP90AA1 in both progenitor (PDGFRA-expressing) and myelinating (PLP1-expressing) OLs at lesion rims (PPWM, black arrowheads). For tSNE and violin plots, data shown from 9 control and 12 MS samples. For astrocyte violin plots, 1,571 control and 3,810 MS nuclei are shown. Box plots inside violin plots represent median and standard deviation of gene expression. For ISH and IHC experiments, representative images from from 3 control and 4 MS individual tissue sections are shown.
Extended Data Fig. 5
Extended Data Fig. 5. Cluster analysis of activated and phagocytosing microglia subtypes.
Hierarchical cluster analysis identifies several homeostatic and activated MS-specific microglia subtypes according to inflammatory lesion stages allowing transcriptomic staging of microglia subtypes. Clusters with enriched genes are marked and annotated a-f (see Supplementary Table 8 for gene list). Note that phagocytosing cells are identified by presence of OL/myelin genes (cluster “f” on bottom of heatmap).
Extended Data Fig. 6
Extended Data Fig. 6. PCR for rat Mbp from myelin preparation.
(a) Representative Coomassie stain of brain homogenate (Hom.) and purified myelin (P.M.) from adult rat brain (left). Western blots for myelin basic protein (Mbp), myelin oligodendrocyte glycoprotein (Mog), synaptophysin (Syp) and neurofilament heavy molecular weight (NF-H) (center). PCRs of myelin basic protein (Mbp) and synaptophysin (Syp) transcripts in brain homogenate and purified myelin fractions (right). (b) Densitometric quantification of myelin and homogenates prepared from n= 4 independent rat hemispheres for Coomassie (total protein), Western blot proteins and PCRs shown in (a) of purified myelin fractions normalized to their respective homogenates. Data is shown as median and error bars ± standard error of the mean of the 4 biological replicates. Similar results were obtained with Hom. and P.M. fractions not used in this study. P values calculated from Students’s two tailed t-test with Welch's correction and p values less than 0.05 considered significant.
Fig. 1
Fig. 1. Experimental approach and characteristics of snRNA-seq using frozen MS tissue.
(a) Cortical and subcortical control tissue and MS lesion types (DM = demyelination, NA = normal appearing). (b) Experimental approach for isolating nuclei from postmortem snap-frozen brain samples of MS and control patients. (c) Cell types from individual samples (left), cell-type specific clusters (center; ctrl, n= 9; MS, n= 12) and sample contribution to individual clusters (right). Note separation of EN-L2-3 and OL cells into MS-specific clusters EN-L2-3-A/B and OL-B/C. (d) tSNE plots highlight marker genes for neurons, astrocytes, OLs and microglia. (e) Bar chart shows contributions of normalized control and MS cell numbers to major cell-type clusters. Note that EN-L2-3-A cell enrichment and concomitant decrease in EN-L2-3-B in control samples over MS was not statistically significant (p = 0.165 and 0.082). (f) Specific loss of EN-L2-3 versus EN-L4, EN-L5-6 or IN-VIP neurons based on normalized cell numbers. (g) Differential gene expression (DGE) analysis showing highest number of dysregulated genes in EN-L2-3 followed by EN-L4 and OL cells; least differentially expressed genes were found in SST INs and OPCs. Box plots represent median and interquartile range (IQR) of differentially expressed gene number calculated after downsampling (100 DGE analyses per cell cluster; ctrl, n= 9; n= 12 MS). Wiskers extend to the largest values within 1.5 IQR from box boundaries, outliers shown as dots, notches represent a 95% confidence interval around the median. Two-tailed Mann-Whitney tests performed in e and f (ctrl, n= 9; MS, n= 12); *P ≤ 0.05. Data presented as mean ± SEM. For tSNE plots, data shown from a total of 48,919 nuclei (ctrl, n= 9; n= 12 MS).
Fig. 2
Fig. 2. Pseudotime trajectory analysis of upper layer excitatory projection neurons.
(a) Trajectory analysis of CUX2-expressing EN-L2-3 cells (upper left). Unsupervised pseudotime trajectories within the EN-L2-3 (upper right) cluster reflected cellular origin from MS samples or controls (lower left) and inflammatory lesion stage (lower right). (b) EN-L2-3 pseudotime trajectories showed similar features as (a) and suggested loss of normalized EN-L2-3 numbers (lower left). Strongest association with EN-L2-3 trajectories found for upper cortical layer demyelination (upper right) versus deep cortical layer (center right) and subcortical demyelination (lower right). (c) Note selective enrichment of dysregulated genes in EN-L2-3 cells from samples with late chronic inactive lesions versus acute/chronic-active and control samples. (d) Visualization of GO terms (enrichment calculated using GSEA, FDR adjusted p ≤ 0.05, no terms significantly decreased) in genes significantly regulated in EN-L2-3 in a pseudotime-dependent manner (Moran’s I test, FDR adjusted p ≤ 0.0001). Note enrichment of severe cell stress processes. (e) Trajectory-dependent upregulated (f) and downregulated EN-L2-3 genes of interest. Grey shading represent 95% confidence interval based on gene expression in all (n= 5,938) sampled EN-L2-3 nuclei.
Fig. 3
Fig. 3. Cellular and molecular neuronal pathology in cortical MS lesions.
(a) tSNE plots CUX2, VIP and TLE4-expressing neurons (left). Spatial transcriptomics showing layer-specific expression of CUX2 in lesion (indicated by loss of MOG) versus non-lesion areas (center left). Schematic illustrates layer-specific neuron subtype diversity (center). Note CUX2 and VIP expression in upper and TLE4 in deep cortical layers by smFISH (center right; ctrl, n=5), and validation of neuronal expression by SYT1 ISH (black arrowheads; ctrl, n=5). (b) CUX2 and VIP smFISH demonstrate reduction of CUX2- but not VIP-expressing upper layer neurons in DMGM underlying meningeal inflammation (upper left and right) versus incomplete demyelinated (IDMGM), NAGM and control cortical GM (bottom left). ANOVA with Kruskal Wallis multiple comparison tests were performed (ctrl, n=5 (CUX2), n=4 (VIP); MS, n=8; *P ≤ 0.05; different samples with NAWM, IDMGM and DMGM MS lesion areas from same sections; representative images). (c) Upregulation of neuronal PPIA in DMGM and NAGM versus control GM (left, white circles indicate perinuclear areas of PPIA quantification). Neuronal upregulation and cytoplasmic accumulation of LINC00657 (NORAD) in DMGM versus NAGM and control areas (right, black arrowheads). ANOVA with Tukey’s multiple comparison tests were performed (ctrl, n=3; MS, n=4; **p ≤ 0.01, ***p ≤ 0.001, ****p ≤ 0.0001; different samples with NAWM and DMGM areas from same sections; representative images). Data presented as mean ± SEM. For tSNE plots, data shown from a total of 48,919 nuclei (ctrl, n = 9; n = 12 MS). Violin plots represent DGE (normalized log transformed UMIs) in EN-L2-3 (EN-L2-3-A and EN-L2-3-B) nuclei (ctrl, n = 3,481; n = 2,639 MS); box plots represent median and standard deviation of gene expression.
Fig. 4
Fig. 4. Transcriptomic changes in astrocytes and myelinating oligodendrocytes in cortical and subcortical MS lesions.
(a) Downregulation of SLC1A2 and GPC5 and upregulation of GFAP and CD44 in MS astrocytes (upper left). LaST ISH experiments confirm SLC1A2 downregulation in DMGM underlying meningeal inflammation, whereas CD44 shows ubiquitous expression in NAWM and PPWM (periplaque white matter, center left) and upregulation in reactive astrocytes at lesion rims in b1 (center right). Note CD44 and GPC5 co-expression with pan-astrocyte marker RFX4 (white/black arrowheads, lower left and right) and association of CD44 with fibrous/reactive WM astrocytes and GPC5 with protoplasmic cortical GM astrocytes (black arrowheads; right; white star indicates blood vessel). (b) Downregulation of GLUL and KCNJ10 in MS astrocytes (left). Note differential upregulation of BCL6 and FOS in reactive astrocytes at PPWM (center, black arrowheads) and LINC01088 in fibrous/reactive WM astrocytes (right, black arrowhead). (c) Violin plots for selected genes linked to cell stress (upregulated, top), myelin biosynthesis and axon maintenance (downregulated, bottom) in MS OLs. (d) FTL and FTH1 upregulation in PLP1-expressing OLs at iron-laden lesions rims (left, black arrowheads). Note differential upregulation of B2M and HLA-C in PLP1-expressing OLs at PPWM (right; yellow arrowheads [white arrowheads mark OLs without B2M ISH signals in NAWM]). For ISH, representative images shown (ctrl, n = 3; n = 4 MS). For tSNE plots, data shown from a total of 48,919 nuclei (ctrl, n = 9; n = 12 MS). Violin plots represent DGE (normalized log transformed UMIs) in nuclei (astrocytes: ctrl, n = 1,571; n = 3,810 MS; OLs [OL-A, OL-B and OL-C]: ctrl, n = 3,070; n = 9,324 MS;); box plots represent median and standard deviation of gene expression.
Fig. 5
Fig. 5. Transcriptomic changes in activated and phagocytosing microglia subsets.
(a) Violin and tSNE plots for upregulated genes in MS microglia linked to myelin phagocytosis/breakdown (left), microglia activation and iron handling (center); note downregulation of genes encoding for synapse function (SYNDIG1) and potassium homeostasis (KCNQ3) (right). (b) Pseudo low resolution 3D rendering of confocal images showing subcortical WM lesions of different inflammatory stages by MBP smFISH and CD68 IHC; white arrowheads indicate CD68+ cells with MBP+ ISH signals; note colocalization of MBP, CD74 and RUNX1 in CD68-positive cells (center left, white arrowheads). CD68 IHC identifies WM lesion (blood vessel, black star; upper right) with upregulation of MSR1 at lesion rims, co-expressed with RUNX1 (lower right) and FTL (upper right, black arrowheads); representative images from different tissue sections (ctrl, n=3; MS, n=4). (c) Human (upper left; n=3 individual biopsies) and mouse (upper center right; n=4 independent cultures) myelin-microglia engulfment assays confirming ingestion of MBP and PLP1 transcripts derived from rat myelin. Note localization to nuclear/perinuclear spaces (white arrowheads). Microglia labeled by pHrodo (human) and Iba1/CD68 (mouse) with LMNA/C and DAPI nuclear counterstain. Schematic illustrates myelin phagocytosis and uptake into microglial (peri-)nuclear spaces (upper right). MBP persistence up to 4 days after ingestion in mouse microglia as shown by smFISH (4 independent cultures; lower left); note upregulation of Cd163 and downregulation of P2ry12 in phagocytosing mouse (6 independent cultures) and human MS microglia (lower right). Two-tailed Mann-Whitney tests performed. Data presented as mean ± SEM. For tSNE plots, data shown from a total of 48,919 nuclei (ctrl, n = 9; n = 12 MS). Violin plots represent DGE (normalized log transformed UMIs) in microglia nuclei (ctrl, n = 159; n = 1,524 MS [microglial and phagocytosing cells]); box plots represent median and standard deviation of gene expression.

References

    1. Collaborators, G. D. a. I. I. a. P. Global, regional, and national incidence, prevalence, and years lived with disability for 310 diseases and injuries, 1990-2015: a systematic analysis for the Global Burden of Disease Study 2015. Lancet. 2016;388:1545–1602. doi: 10.1016/S0140-6736(16)31678-6. - DOI - PMC - PubMed
    1. Reich DS, Lucchinetti CF, Calabresi PA. Multiple Sclerosis. New England Journal of Medicine. 2018;378:169–180. doi: 10.1056/NEJMra1401483. - DOI - PMC - PubMed
    1. Lassmann H. Multiple Sclerosis Pathology. Cold Spring Harbor perspectives in medicine. 2018;8 doi: 10.1101/cshperspect.a028936. a028936. - DOI - PMC - PubMed
    1. Trapp BD, et al. Axonal transection in the lesions of multiple sclerosis. The New England journal of medicine. 1998;338:278–285. doi: 10.1056/NEJM199801293380502. - DOI - PubMed
    1. Schirmer L, Antel JP, Brück W, Stadelmann C. Axonal loss and neurofilament phosphorylation changes accompany lesion development and clinical progression in multiple sclerosis. Brain pathology (Zurich, Switzerland) 2011;21:428–440. doi: 10.1111/j.1750-3639.2010.00466.x. - DOI - PMC - PubMed

MeSH terms