. 2019 Jun 27:13:673.
doi: 10.3389/fnins.2019.00673. eCollection 2019.

PERK-Mediated Unfolded Protein Response Activation and Oxidative Stress in PARK20 Fibroblasts

Affiliations

PERK-Mediated Unfolded Protein Response Activation and Oxidative Stress in PARK20 Fibroblasts

Giuseppina Amodio et al. Front Neurosci. .

Abstract

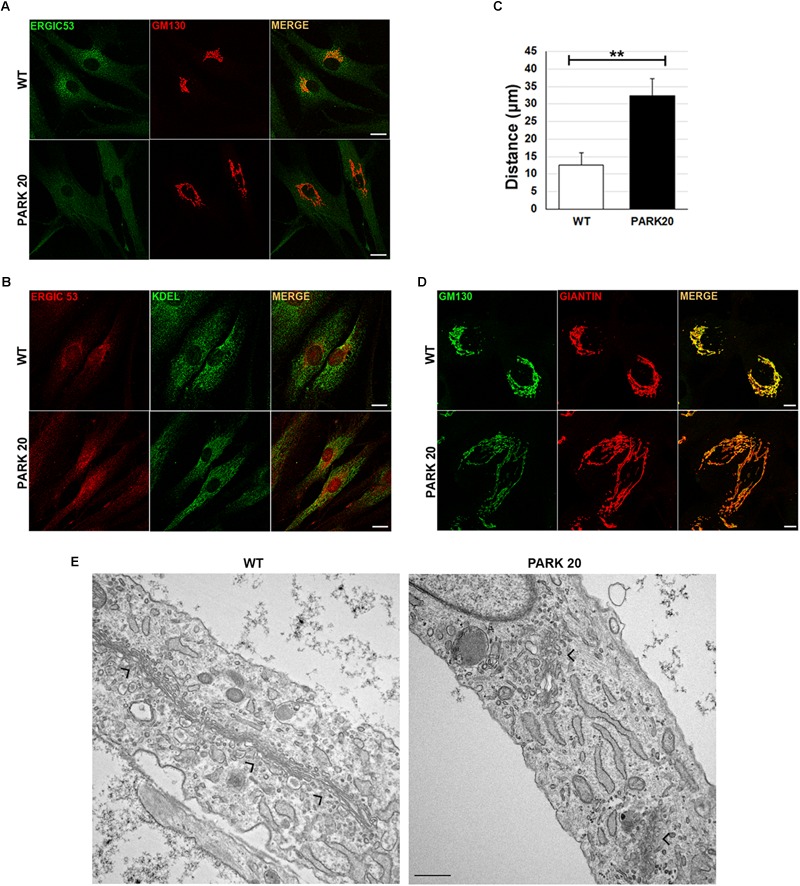
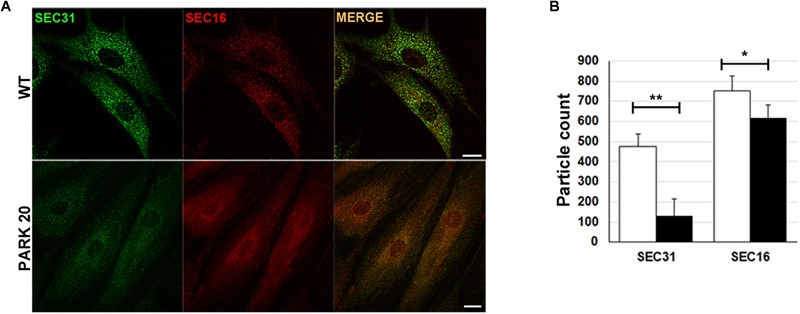
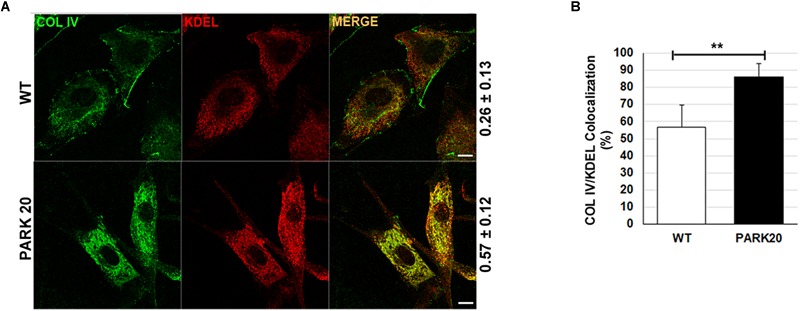
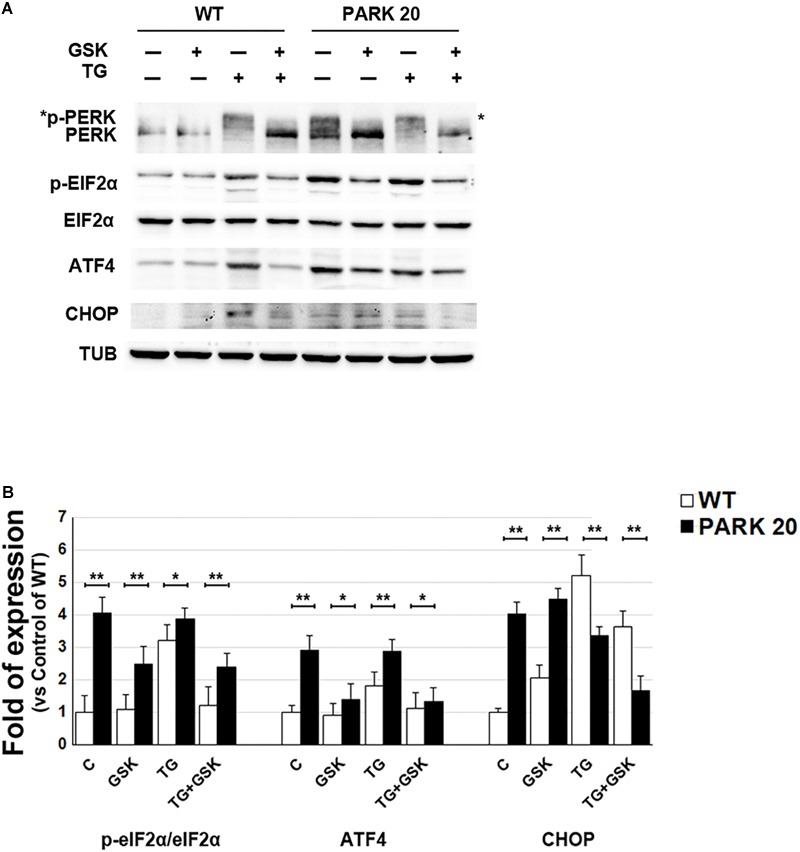
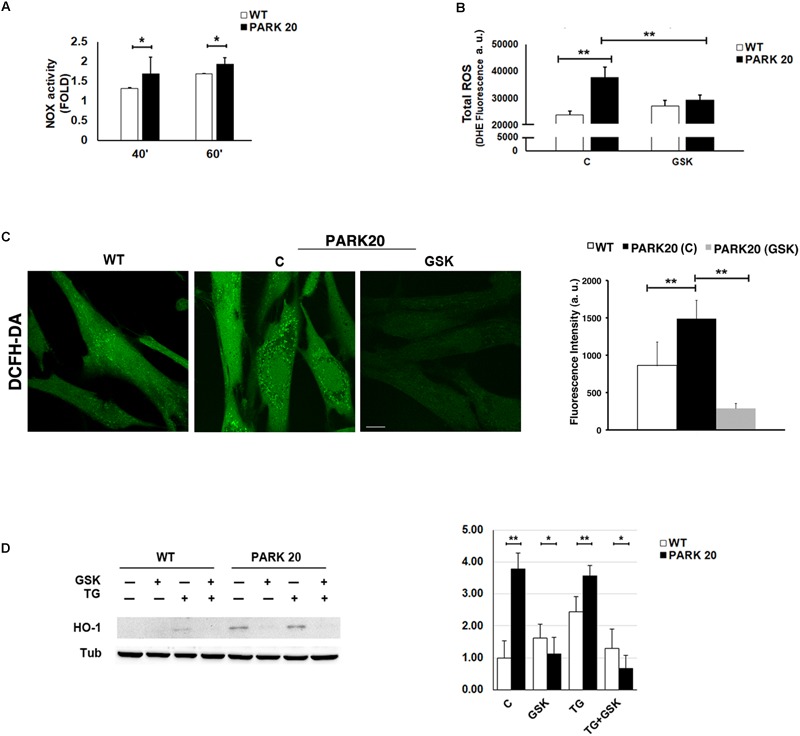
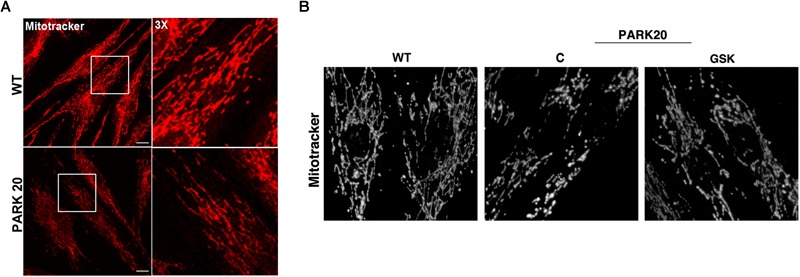
PARK20, an early onset autosomal recessive parkinsonism is due to mutations in the phosphatidylinositol-phosphatase Synaptojanin 1 (Synj1). We have recently shown that the early endosomal compartments are profoundly altered in PARK20 fibroblasts as well as the endosomal trafficking. Here, we report that PARK20 fibroblasts also display a drastic alteration of the architecture and function of the early secretory compartments. Our results show that the exit machinery from the Endoplasmic Reticulum (ER) and the ER-to-Golgi trafficking are markedly compromised in patient cells. As a consequence, PARK20 fibroblasts accumulate large amounts of cargo proteins within the ER, leading to the induction of ER stress. Interestingly, this stressful state is coupled to the activation of the PERK/eIF2α/ATF4/CHOP pathway of the Unfolded Protein Response (UPR). In addition, PARK20 fibroblasts reveal upregulation of oxidative stress markers and total ROS production with concomitant alteration of the morphology of the mitochondrial network. Interestingly, treatment of PARK20 cells with GSK2606414 (GSK), a specific inhibitor of PERK activity, restores the level of ROS, signaling a direct correlation between ER stress and the induction of oxidative stress in the PARK20 cells. All together, these findings suggest that dysfunction of early secretory pathway might contribute to the pathogenesis of the disease.

Keywords: ER stress; PARK20; PERK (PKR-like endoplasmic reticulum kinase); Parkinson’s disease; Synaptojanin 1; membrane trafficking; mitochondrial dysfunction; oxydative stress.


Figures

FIGURE 1
FIGURE 1
Protein markers of the early secretory pathway are differently distributed in WT and PARK20 fibroblasts. (A,B,D) HDF (WT) and PARK20 cells were seeded on glass coverslips, fixed and processed for immunofluorescence with the indicated antibodies. Images were collected by confocal microscope. Scale bars: 10 μm. (C) Histogram shows the distance (mean ± SD in μM) from the nucleus of ERGIC-53 fluorescent spots. N ≥ 30. ∗∗p ≤ 0.01, Student’s t-test. (E) Representative ultrastructural images of WT and PARK20 cells. Scale bar: 1 μm; arrows indicate the position of Golgi complex.
FIGURE 2
FIGURE 2
The formation of COPII-coated vesicles are reduced in PARK20 fibroblasts. (A) HDF (WT) and PARK20 cells seeded on glass coverslips were fixed, stained with the indicated antibodies and analyzed by confocal immunofluorescence. Scale bars: 10 μm. (B) Histogram shows particle count (mean ± SD) of Sec31 (green) and Sec16 (red) fluorescent spots analyzed by Image J. N ≥ 30. p ≤ 0.05, ∗∗p ≤ 0.01, Student’s t-test.
FIGURE 3
FIGURE 3
The secretion of collagen IV is impaired in PARK20 fibroblasts. (A) HDF (WT) and PARK20 cells were seeded on glass coverslips, processed for immunofluorescence and analyzed by confocal imaging. Numbers on the right refers to Pearson’s correlation coefficient, quantified with Leica SP5 software (mean ± SD). p ≤ 0.01, Student’s t-test; N ≥ 30; scale bars: 10 μm. (B) Histogram shows the percent of collagen IV pixels colocalizing with KDEL pixels (mean ± SD) analyzed by Leica SP5 software. ∗∗p ≤ 0.01, Student’s t-test.
FIGURE 4
FIGURE 4
The PERK-dependent pathway of the UPR is up-regulated in PARK20 fibroblasts. (A,B) Western blot analysis of the relative expression of markers of the PERK-dependent pathway of UPR. Starved HDF (WT) and PARK20 cells were either untreated (C) or treated for 2 h with 1 μM GSK2606414 (GSK) or 500 nM Thapsigargin (TG) alone (GSK and TG respectively) or in combination (TG + GSK). For TG + GSK samples, a pre-treatment of 30 min with GSK2606414 was performed prior to the addition of TG. α-Tubulin (TUB) was used as loading control. (B) Densitometry analyses of three independent experiments are shown. Histogram shows the relative fold induction of the expression of the indicated proteins in the treated samples compared to the control samples. Results are expressed as mean values ± SD; p ≤ 0.05, ∗∗p ≤ 0.01, Student’s t-test.
FIGURE 5
FIGURE 5
Oxidative stress is increased in PARK20 fibroblasts. (A) NADPH oxidase (NOX) activity assay performed in HDF cells (WT) and PARK20 fibroblasts as reported in the methods. Histogram shows the relative fold change of NOX activity expressed as mean ± SD. Results were obtained from three independent experiments. (B,C) ROS quantification was carried out by using DHE (B) or DCFH-DA (C) fluorescent probes. HDF cells (WT) and PARK20 fibroblasts were untreated (C) or treated for 2 h with 1μM GSK2606414 (GSK) and then processed for DHE or DCFH-DA fluorescence quantification as detailed in the methods section. Histograms show mean values ± SD of DHE or DCFH-DA fluorescence expressed as arbitrary unit (a. u.) and calculated on three independent experiments. Scale bar 10 μm. (D) Immunoblot detection of HO-1 and densitometric analysis of three independent experiments. Starved HDF (WT) and PARK20 cells were either untreated (C) or treated for 2 h with 1 μM GSK2606414 (GSK) or 500 nM Thapsigargin (TG) alone (GSK and TG respectively) or in combination (TG + GSK) as aforementioned. α-Tubulin (TUB) was used as loading control. Representative immunoblotting is shown. Histogram shows the relative fold induction of HO-1 expression in the treated samples compared to the control samples. Results are expressed as mean values ± SD. p ≤ 0.05, ∗∗p ≤ 0.01, Student’s t-test.
FIGURE 6
FIGURE 6
Mitochondrial network is altered in PARK20 fibroblasts. HDF (WT) and PARK20 cells were seeded on glass coverslips and stained with the mitotracker red CMXRos probe for 20 min at 37°C prior to be fixed and processed for immunofluorescence. Serial confocal sections were collected from top and bottom of the cells. Representative images of single confocal sections (A) and 3D reconstructions of Z-stack acquired to higher magnification (B) are shown. Scale bars: 20 μm.

References

    1. Al Shahrani M., Heales S., Hargreaves I., Orford M. (2017). Oxidative stress: mechanistic insights into inherited mitochondrial disorders and Parkinson’s Disease. J. Clin. Med. 6:E100. 10.3390/jcm6110100 - DOI - PMC - PubMed
    1. Alam J., Stewart D., Touchard C., Boinapally S., Choi A. M., Cook J. L. (1999). Nrf2, a Cap’n’collar transcription factor, regulates induction of the heme oxygenase-1 gene. J. Biol. Chem. 274 26071–26078. 10.1074/jbc.274.37.26071 - DOI - PubMed
    1. Alvarez C., Garcia-Mata R., Hauri H. P., Sztul E. (2001). The p115-interactive proteins GM130 and giantin participate in endoplasmic reticulum-Golgi traffic. J. Biol. Chem. 276 2693–2700. 10.1074/jbc.M007957200 - DOI - PubMed
    1. Amodio G., Moltedo O., Faraonio R., Remondelli P. (2018). Targeting the endoplasmic reticulum unfolded protein response to counteract the oxidative stress-induced endothelial dysfunction. Oxid Med. Cell Longev. 2018:4946289. 10.1155/2018/4946289 - DOI - PMC - PubMed
    1. Amodio G., Moltedo O., Monteleone F., D’Ambrosio C., Scaloni A., Remondelli P., et al. (2011). Proteomic signatures in thapsigargin-treated hepatoma cells. Chem. Res. Toxicol. 24 1215–1222. 10.1021/tx200109y - DOI - PubMed