. 2019 Jun 18:10:1380.
doi: 10.3389/fimmu.2019.01380. eCollection 2019.

Porcine Invariant Natural Killer T Cells: Functional Profiling and Dynamics in Steady State and Viral Infections

Affiliations

Porcine Invariant Natural Killer T Cells: Functional Profiling and Dynamics in Steady State and Viral Infections

Alexander Schäfer et al. Front Immunol. .

Abstract

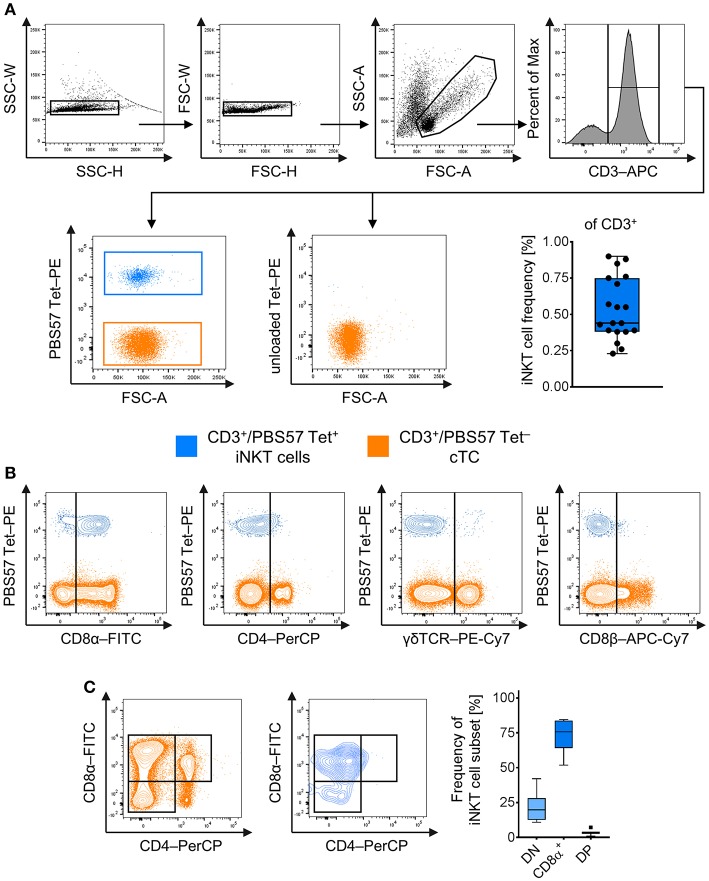
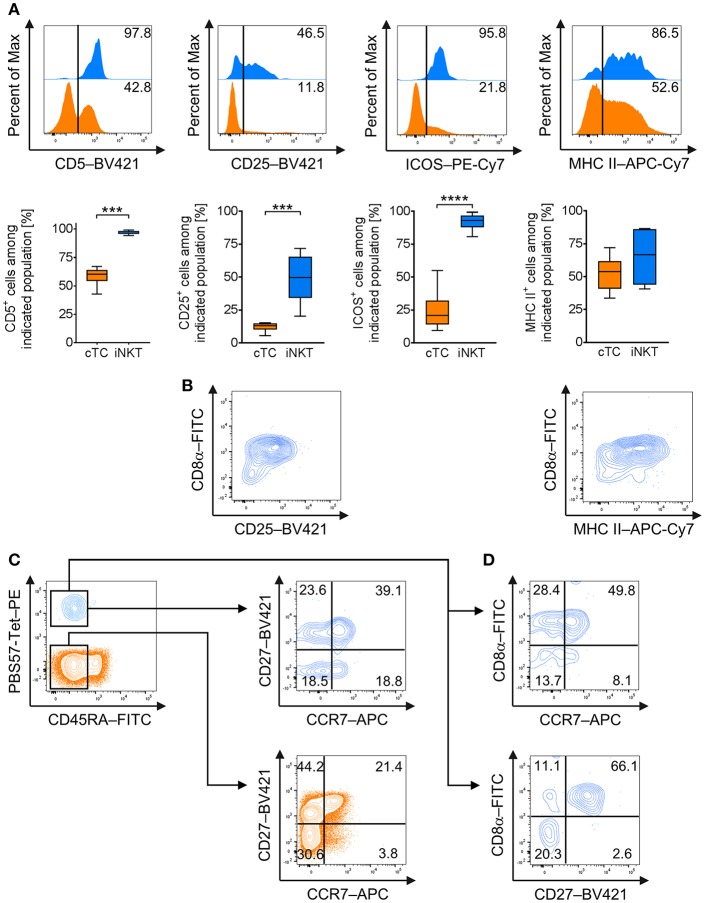
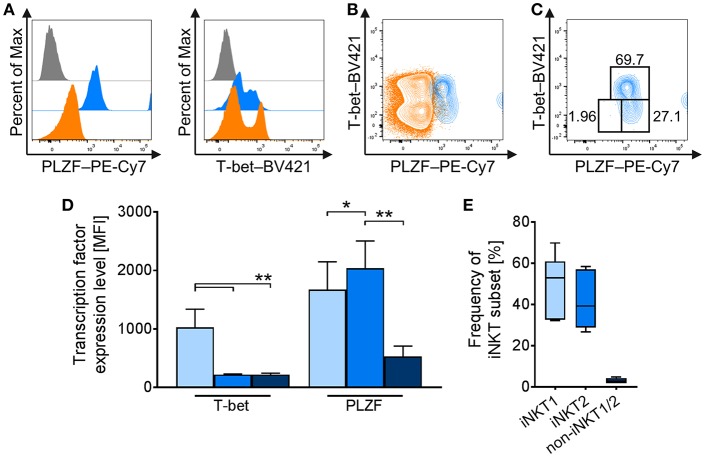
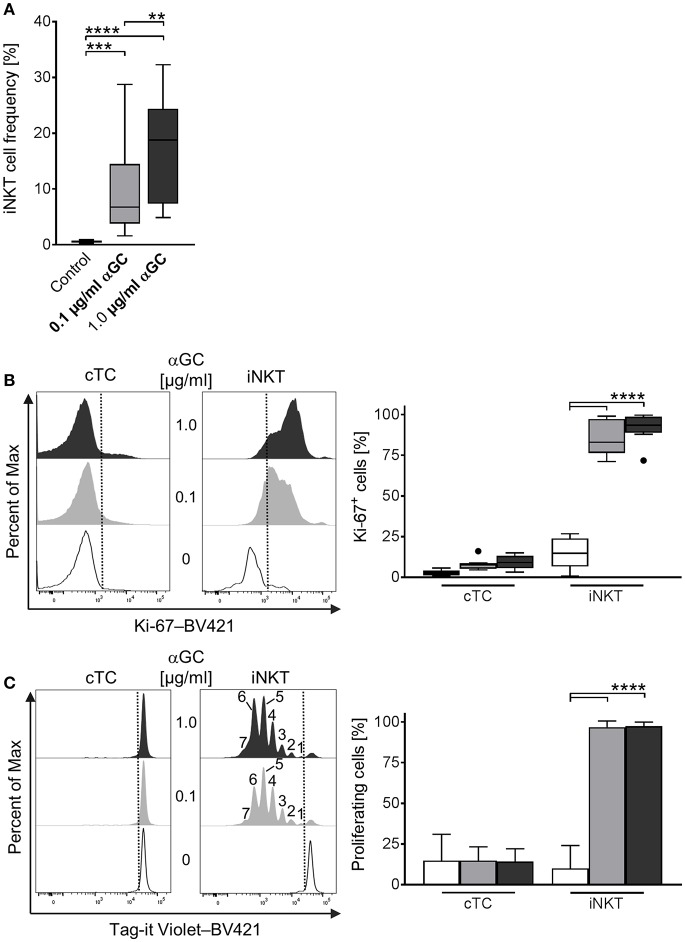
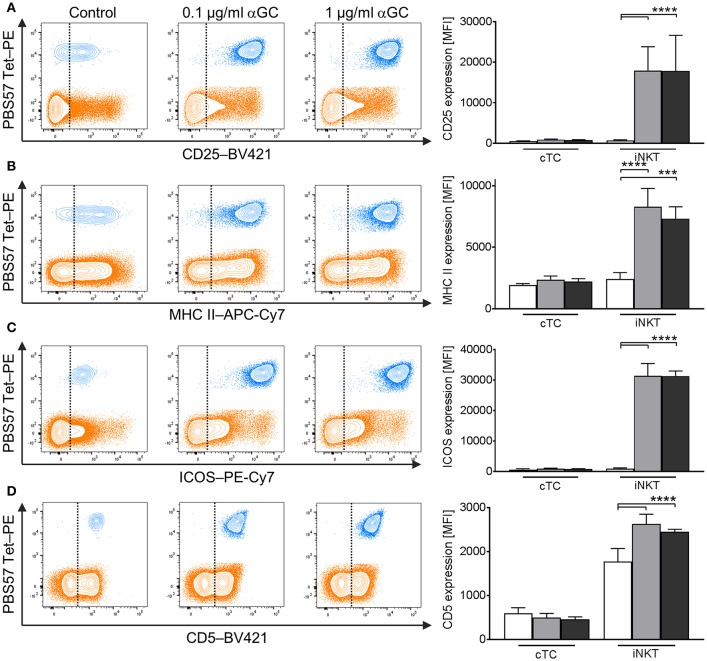
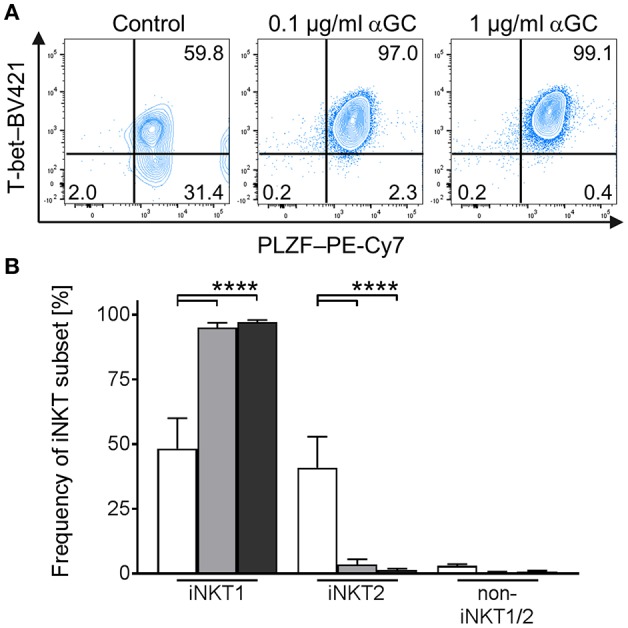
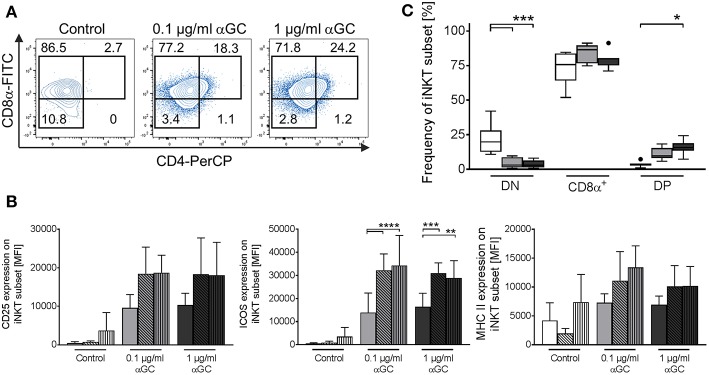
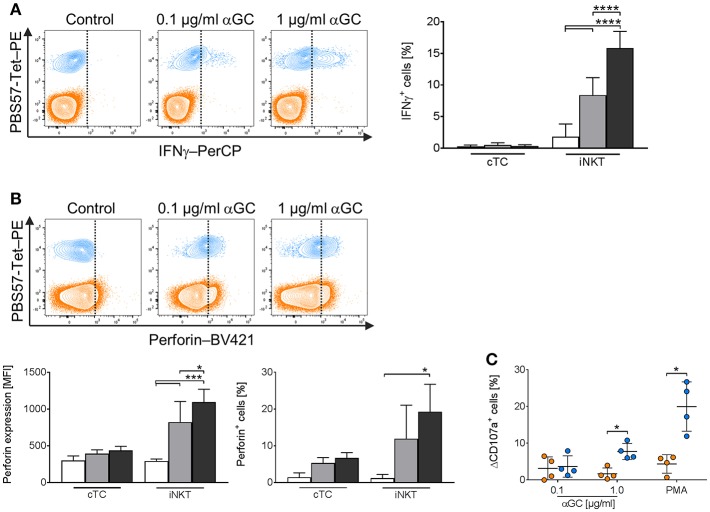
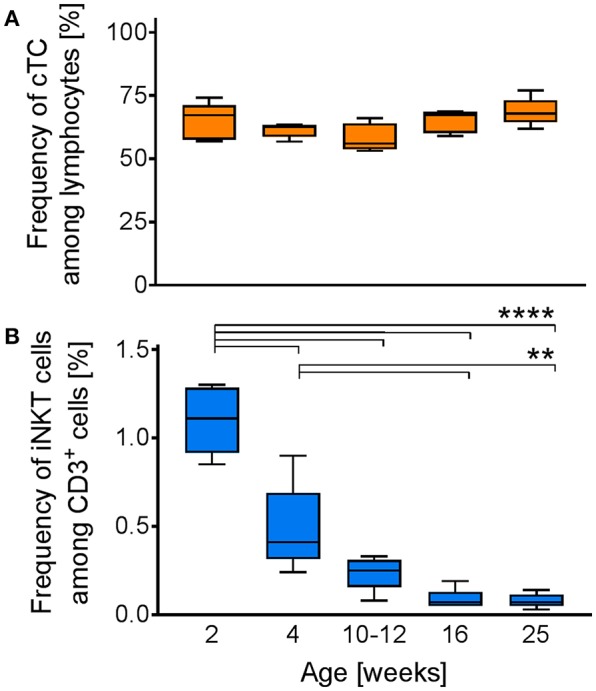
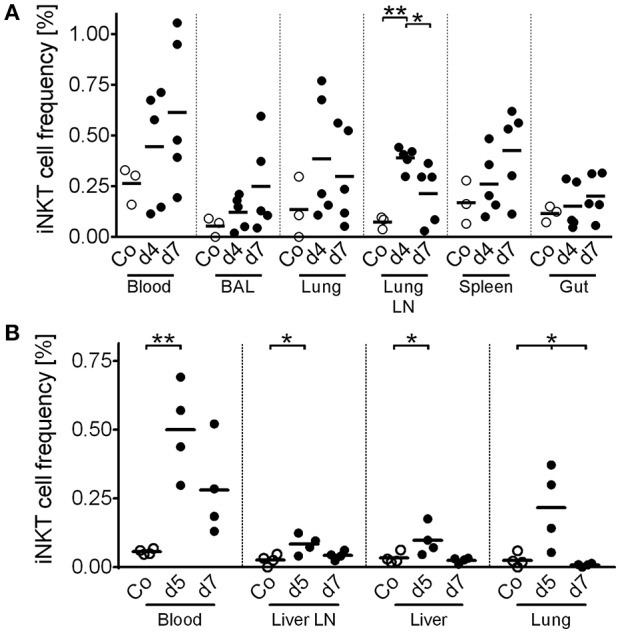
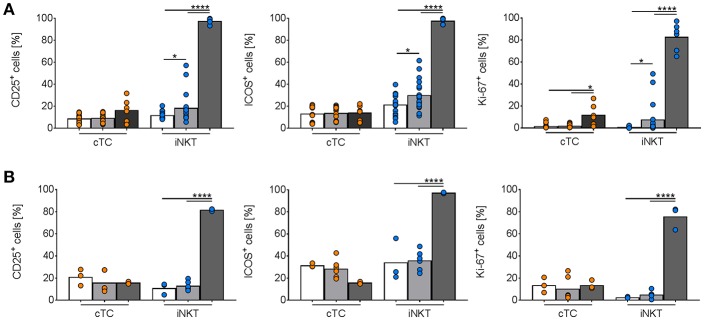
Pigs are important livestock and comprehensive understanding of their immune responses in infections is critical to improve vaccines and therapies. Moreover, similarities between human and swine physiology suggest that pigs are a superior animal model for immunological studies. However, paucity of experimental tools for a systematic analysis of the immune responses in pigs represent a major disadvantage. To evaluate the pig as a biomedical model and additionally expand the knowledge of rare immune cell populations in swine, we established a multicolor flow cytometry analysis platform of surface marker expression and cellular responses for porcine invariant Natural Killer T cells (iNKT). In humans, iNKT cells are among the first line defenders in various tissues, respond to CD1d-restricted antigens and become rapidly activated. Naïve porcine iNKT cells were CD3+/CD4-/CD8+ or CD3+/CD4-/CD8- and displayed an effector- or memory-like phenotype (CD25+/ICOS+/CD5hi/CD45RA-/CCR7 ± /CD27+). Based on their expression of the transcription factors T bet and the iNKT cell-specific promyelocytic leukemia zinc finger protein (PLZF), porcine iNKT cells were differentiated into functional subsets. Analogous to human iNKT cells, in vitro stimulation of porcine leukocytes with the CD1d ligand α-galactosylceramide resulted in rapid iNKT cell proliferation, evidenced by an increase in frequency and Ki-67 expression. Moreover, this approach revealed CD25, CD5, ICOS, and the major histocompatibility complex class II (MHC II) as activation markers on porcine iNKT cells. Activated iNKT cells also expressed interferon-γ, upregulated perforin expression, and displayed degranulation. In steady state, iNKT cell frequency was highest in newborn piglets and decreased with age. Upon infection with two viruses of high relevance to swine and humans, iNKT cells expanded. Animals infected with African swine fever virus displayed an increase of iNKT cell frequency in peripheral blood, regional lymph nodes, and lungs. During Influenza A virus infection, iNKT cell percentage increased in blood, lung lymph nodes, and broncho-alveolar lavage. Our in-depth characterization of porcine iNKT cells contributes to a better understanding of porcine immune responses, thereby facilitating the design of innovative interventions against infectious diseases. Moreover, we provide new evidence that endorses the suitability of the pig as a biomedical model for iNKT cell research.

Keywords: African swine fever virus; T cells; biomedical model; iNKT cells; influenza A virus; pig.


Figures

Figure 1
Figure 1
Identification and phenotype of naïve peripheral porcine iNKT cells. Expression of surface markers was analyzed by flow cytometry. (A) Doublets were excluded by SSC-W vs. SSC-H gates, followed by FSC-W vs. FSC-H gates. Live lymphocytes were identified according to their FSC/SSC characteristics. All T cells were identified using antibodies against CD3. CD3+ T cells stained with the PBS57-loaded CD1d tetramer (left plot) were defined as invariant Natural Killer T cells (iNKT; blue), tetramer-negative cells were defined as conventional T cells (cTC; orange). Unloaded tetramers served as control (right plot). Frequency of iNKT cells in peripheral blood among CD3+ lymphocytes shown as Tukey box plot (n = 19). (B) Evaluation of expression of CD8α, CD4, γδTCR, and CD8β on iNKT cells and cTC. Representative plots of at least four experiments are shown. (C) Representative plots of CD8α and CD4 co-expression by cTC and iNKT cells. CD8α/CD4 (DN; light blue), CD8α+/CD4 (CD8α+, blue), and CD8α+/CD4+ (DP; dark blue) subsets among iNKT cells were identified according to their expression pattern in cTC. Frequency of iNKT cell subsets shown as Tukey box plots (n = 7).
Figure 2
Figure 2
Expression of effector and memory cell-associated markers on naïve porcine iNKT cells. Expression of surface markers associated with effector functions and memory status on naïve peripheral iNKT cells was analyzed by flow cytometry. (A) Representative flow cytometric plots of CD5, CD25, MHC II, and ICOS expression by iNKT cells (blue) and cTC (orange). Summarized data show frequencies of iNKT cells or cTC expressing CD5, CD25, MHC II, and ICOS (mean (SD), n = 6). (B) Representative flow cytometric plots showing differential expression of CD8a and CD25 or MHC II on iNKT cells. (C) Expression of CD45RA (left) on iNKT cells and cTC. CD45RA cTC (middle) and iNKT cells (right) were further investigated for expression of CD27 and CCR7 and divided into CD27+/CCR7+ central memory cells, CD27+/CCR7 transitional memory cells, CD27/CCR7 effector memory cells, and CD27/CCR7+ activated effector memory cells. (D) Differential expression of CD8α and CCR7 or CD27. Representative plots and histograms of at least three experiments are shown. ***p < 0.001, ****p < 0.0001, paired t-test.
Figure 3
Figure 3
Differential profiling of naïve porcine iNKT cells. Peripheral iNKT cells were differentiated by flow cytometry according to their expression of the transcription factors PLZF and T-bet. (A) Representative flow cytometric histograms of PLZF (left) and T-bet (right) expression in iNKT cells (blue) and cTC (orange). Control stainings are shown in gray. (B) Representative flow cytometric plot showing co-expression of T-bet and PLZF in iNKT cells and cTC. (C) Differential gating of iNKT cells according to their T-bet and PLZF expression. iNKT1 were defined as T-bet+/PLZF+ (light blue), iNKT2 as T-bet/PLZFhi (blue), and non-iNKT1/2 as T-bet/PLZFlo (dark blue). (D) Expression profiles of T-bet and PLZF in iNKT1 (light blue), iNKT2 (blue), and non-iNKT1/2 (dark blue) (n = 6). (E) Frequency of iNKT subsets in naïve swine shown as Tukey box plots (n = 6). *p < 0.05, **p < 0.01, repeated-measures one-way ANOVA with Holm-Sidak's post-hoc test for multiple comparisons.
Figure 4
Figure 4
Proliferative activity of porcine iNKT cells upon antigenic activation. (A) PBMC were cultivated in the presence of 0.1 μg/ml (gray) or 1 μg/ml (black) αGC or DMSO as vehicle control (white) for 4 days. Proliferation measured as iNKT cell frequency among CD3+ lymphocytes shown as Tukey box plots (n = 17). (B) Cell proliferation was investigated by measuring Ki-67 expression in cTC and iNKT cells. Representative histograms showing expression of Ki-67 in cTC (left) and iNKT cells (right). Dotted lines indicate the threshold according to the control staining. Frequency of proliferating, Ki-67+ iNKT cells and cTC (n = 6). (C) Porcine PBMC were stained with Tag-it Violet and cultivated in the presence of 0.1 μg/ml (gray) or 1 μg/ml (black) αGC or DMSO as vehicle control (white) for 4 days. Proliferating cells were defined as Tag-it Violetlo. Representative histograms showing proliferating, Tag-it Violetlo cells in cTC and iNKT cells. Dotted lines indicate the threshold according to the control staining. Numbers indicate individual proliferation steps. Frequency of proliferating, Tag-it Violetlo cTC and iNKT cells (mean (SD), n = 3). **p < 0.01, ***p < 0.001, ****p < 0.0001, repeated-measures one-way ANOVA with Holm-Sidak's post-hoc test for multiple comparisons.
Figure 5
Figure 5
Changes in surface marker expression on porcine iNKT cells upon antigenic activation. Porcine PBMC were incubated in the presence of 0.1 μg/ml or 1 μg/ml αGC or DMSO as vehicle control for 4 days. Representative flow cytometric plots showing expression of (A) CD25, (B) MHC II, (C) ICOS, and (D) CD5 on cTC (orange) and iNKT cells (blue). Expression level of control cells (white) and cells stimulated with 0.1 μg/ml (gray) and 1 μg/ml αGC (black) are shown (n = 3-4). Dotted lines show threshold according to marker expression by cTC. Data shown as mean (SD), ***p < 0.001, ****p < 0.0001, repeated-measures one-way ANOVA with Holm-Sidak's post-hoc test for multiple comparisons.
Figure 6
Figure 6
Differentiation of activated porcine iNKT cells. Porcine PBMC were cultivated in the presence of αGC or DMSO as vehicle control. Intracellular expression of T-bet and PLZF was analyzed by flow cytometry after stimulation for 4 days. (A) Representative plots of T-bet/PLZF co-expression in untreated control iNKT cells (left) and iNKT cells stimulated with 0.1 μg/ml (middle) or 1 μg/ml (right) αGC. (B) Frequency of iNKT1, iNKT2, and non-iNKT1/2 upon stimulation with 0.1 μg/ml (gray) or 1 μg/ml (black) αGC or DMSO as vehicle control (white) (n = 6). Data shown as mean (SD), ****p < 0.0001, repeated-measures one-way ANOVA with Holm-Sidak's post-hoc test for multiple comparisons.
Figure 7
Figure 7
Changes in iNKT cell subset frequency upon antigenic activation. Porcine PBMC were incubated in the presence of of 0.1 μg/ml or 1 μg/ml αGC or DMSO as vehicle control for 4 days. (A) Expression of CD8α and CD4 on iNKT cells was investigated. Representative flow cytometric plots of controls (left plot), low-dose (middle plot), and high-dose αGC (right plot) stimulated iNKT cells are shown. CD8α/CD4 (DN), CD8α+/CD4 (CD8α+), and CD8α+/CD4+ (DP) subsets in iNKT cells were identified as previously shown. Numbers in the plot show the frequencies of the respective gate. (B) Frequency of iNKT cell subsets in controls (white) and after stimulation with 0.1 μg/ml (gray) or 1 μg/ml αGC (black) shown as Tukey box plots (n = 7). (C) Expression level of CD25 (left graph), ICOS (middle graph), and MHC II (right graph) on DN (empty bars), CD8α+ (diagonal black hatching), and DP (vertical black stripes) iNKT cells was investigated in control cells (white) and cells stimulated with 0.1 μg/ml (gray) or 1 μg/ml (black) αGC (mean (SD), n = 4). *p < 0.05, **p < 0.01, ***p < 0.001, ****p < 0.0001, repeated-measures one-way ANOVA with Holm-Sidak's post-hoc test for multiple comparisons.
Figure 8
Figure 8
Expression of IFNγ and perforin and degranulation of activated porcine iNKT cells upon antigenic activation. Porcine PBMC were cultivated in the presence of 0.1 μg/ml (gray) or 1 μg/ml αGC (black) or DMSO (white) as a control for 4 days. At day 4, the cells were restimulated with medium containing the respective treatment. 2 h later, Brefeldin A was added and the cells were incubated for another 4 h. Intracellular expression of IFNg and perforin in iNKT cells (blue) and cTC (orange) was analyzed by flow cytometry. (A) Representative flow cytometric plots showing IFNγ expression in iNKT cells and cTC (vertical line indicates threshold based on expression level in controls). Frequency of IFNγ-expressing iNKT cells and cTC in controls and after stimulation with 0.1 μg/ml or 1 μg/ml αGC (n = 5-7). (B) Representative flow cytometric plots showing perforin expression (vertical line indicates threshold based on expression level in controls). Expression level of perforin in iNKT cells and cTC in controls and after antigenic stimulation. Perforin+ iNKT cells and cTC after antigenic stimulation (n = 4). (C) CD107a surface expression on iNKT cells and cTC after stimulation with 0.1 μg/ml or 1 μg/ml αGC and PMA/ionomycin. Specific degranulation was calculated as the difference in surface expression of stimulated and control cells and is given as ΔCD107a (n = 4). Data shown as mean (SD), *p < 0.05, ***p < 0.001, ****p < 0.0001, repeated-measures one-way ANOVA with Holm-Sidak's post-hoc test for multiple comparisons.
Figure 9
Figure 9
Age-dependent changes in iNKT cell frequency. Whole blood from swine of the indicated age (n = 5) was investigated for the frequencies of iNKT cells and cTC among CD3+ lymphocytes. Box plots showing the frequency of (A) CD3+ cells among lymphocytes and (B) iNKT cells among CD3+ cells. **p < 0.01, ****p < 0.0001, ordinary one-way ANOVA with Holm-Sidak's post-hoc test for multiple comparisons.
Figure 10
Figure 10
In vivo dynamics of porcine iNKT cells during viral infections. Pigs were experimentally infected with (A) IAV (n = 3-5) or (B) ASFV (n = 4). At the indicated time after infection, animals were euthanized and lymphocytes of the indicated tissues were isolated. Frequency of iNKT among CD3+ lymphocytes was then investigated using flow cytometry. Open circles show uninfected control animals (Co). Closed circles show infected animals at the indicated time post infection. Each symbol represents an individual animal with a line indicating mean. BAL, Broncho alveolar lavage. Lung LN, lung lymph node (Nodi lymphatici tracheobronchales inferiores). Liver LN, liver lymph node (Nodi lymphatici hepatici). *p < 0.05, **p < 0.01, ordinary one-way ANOVA with Holm-Sidak's post-hoc test for multiple comparisons.
Figure 11
Figure 11
In vitro activation of porcine iNKT cells during viral infections. Freshly isolated porcine PBMC were incubated without stimulation (white bars) or in the presence of supernatant of purified CD172a+ cells infected with (A) IAV (MOI 1; gray) or (B) ASFV (MOI 0.1; gray), or 1 μg/ml αGC (black) for 4 days. Frequencies of iNKT cells (blue circles) and cTC (orange circles) positive for CD25, ICOS, and Ki-67 are shown. Pooled data of two experiments with six individual pigs for IAV and three individual pigs for ASFV shown as mean (SD), *p < 0.05, ****p < 0.0001, ordinary one-way ANOVA with Holm-Sidak's post-hoc test for multiple comparisons.

Similar articles

Cited by

References

    1. Gutierrez K, Dicks N, Glanzner WG, Agellon LB, Bordignon V. Efficacy of the porcine species in biomedical research. Front Genet. (2015) 6:293. 10.3389/fgene.2015.00293 - DOI - PMC - PubMed
    1. Seok J, Warren HS, Cuenca AG, Mindrinos MN, Baker HV, Xu W, et al. . Genomic responses in mouse models poorly mimic human inflammatory diseases. Proc Natl Acad Sci USA. (2013) 110:3507–12. 10.1073/pnas.1222878110 - DOI - PMC - PubMed
    1. Fairbairn L, Kapetanovic R, Sester DP, Hume DA. The mononuclear phagocyte system of the pig as a model for understanding human innate immunity and disease. J Leukoc Biol. (2011) 89:855–71. 10.1189/jlb.1110607 - DOI - PubMed
    1. Giraud S, Favreau F, Chatauret N, Thuillier R, Maiga S, Hauet T. Contribution of large pig for renal ischemia-reperfusion and transplantation studies: the preclinical model. J Biomed Biotechnol. (2011) 2011:532127. 10.1155/2011/532127 - DOI - PMC - PubMed
    1. Mair KH, Sedlak C, Kaser T, Pasternak A, Levast B, Gerner W, et al. . The porcine innate immune system: an update. Dev Comp Immunol. (2014) 45:321–43. 10.1016/j.dci.2014.03.022 - DOI - PMC - PubMed

Publication types

MeSH terms