. 2019 Jun 28:10:1485.
doi: 10.3389/fimmu.2019.01485. eCollection 2019.

Key Features Relevant to Select Antigens and TCR From the MHC-Mismatched Repertoire to Treat Cancer

Affiliations

Key Features Relevant to Select Antigens and TCR From the MHC-Mismatched Repertoire to Treat Cancer

Stefan Audehm et al. Front Immunol. .

Abstract

Adoptive transfer of T cells transgenic for tumor-reactive T-cell receptors (TCR) is an attractive immunotherapeutic approach. However, clinical translation is so far limited due to challenges in the identification of suitable target antigens as well as TCRs that are concurrent safe and efficient. Definition of key characteristics relevant for effective and specific tumor rejection is essential to improve current TCR-based adoptive T-cell immunotherapies. We here characterized in-depth two TCRs derived from the human leukocyte antigen (HLA)-mismatched allogeneic repertoire targeting two different myeloperoxidase (MPO)-derived peptides presented by the same HLA-restriction element side by side comprising state of the art biochemical and cellular in vitro, in vivo, and in silico experiments. In vitro experiments reveal comparable functional avidities, off-rates, and cytotoxic activities for both TCRs. However, we observed differences especially with respect to cytokine secretion and cross-reactivity as well as in vivo activity. Biochemical and in silico analyses demonstrate different binding qualities of MPO-peptides to the HLA-complex determining TCR qualities. We conclude from our biochemical and in silico analyses of peptide-HLA-binding that rigid and high-affinity binding of peptides is one of the most important factors for isolation of TCRs with high specificity and tumor rejection capacity from the MHC-mismatched repertoire. Based on our results, we developed a workflow for selection of such TCRs with high potency and safety profile suitable for clinical translation.

Keywords: T-cell receptor (TCR); TCR cell therapy; TCR characterization; TCR identification; adoptive T-cell transfer therapy; peptide-MHC modeling (p-MHC modeling); target antigen characterization; trimolecular complex (TCR-p-MHC).


Figures

Figure 1
Figure 1
TCR surface expression and quality of cytokine release differs between TCRF5.4- and TCR2.5D6-transduced T cells. (A) Transduction efficiency measured by flow cytometry analysis of surface expression (left) and MFI (right) of TCRF5.4 (green) and TCR2.5D6 (blue). Connections between data points symbolize couples of the same recipient T cells used for TCR transduction (n = 11). Colored and bigger data points represent pairs of T cells that were also used for the functional avidity analyzes in (C). (B) Surface and intracellular anti-TCRm staining of both TCR (X-axis: surface TCRm signal, Y-axis: intracellular TCRm signal) measured by flow cytometry (n = 2). (C) Functional avidity of TCRF5.4- or TCR2.5D6-transduced PBMC analyzed in response to KG1a-B7 pulsed with graded amounts of MPO2 or MPO5 at an E/T ratio of 1:1 after 20 h of co-incubation. Half-maximal IFN-γ release was calculated using logarithmic dose-response fitting algorithm with variable slope (EC50) of GraphPad Prism. Mean ± SD of triplicates of one representative experiment are shown (n = 6). Colored data pairs represent T cell pairs also used in (A). (D) Flow cytometry based koff-rate measurements of TCRF5.4 (n = 4) and TCR2.5D6 (n = 5). The dissociation half-lives calculated by one-phase decay algorithm using GraphPad Prism are shown for both TCR. (E) MFI of HLA-B7 expression of selected AML cell lines measured by flow cytometry. (F) Multi-cytokine release of TCRF5.4 or TCR2.5D6 transduced PBMC in response to the HLA-B7-transgenic AML cell line NB4. NB4 is representatively shown for all 4 tested AML cell lines HL60, ML2, and SiG-M5. Standard deviations of the mean of triplicates are shown (n = 2 for each cell line) (G) IFN-γ secretion by TCRF5.4 or TCR2.5D6 transduced CD8+ TCM in response to AML-cell lines with endogenous MPO expression measured by ELISA. 10.000 effector cells were used in a ratio of 1:1. Standard deviations of the mean of triplicates are shown (n = 4). (Gi−iv) Cytokine secretion (GM-CSF, IFN-γ, and IL-2) measured by flow cytometry based multiplex analysis in response to selected AML cell lines is shown in triplicates either unpulsed or additionally pulsed with MPO2 or MPO5. (H) IFN-γ release (left panels) and cytotoxicity (right panels) of TCRF5.4- or TCR2.5D6-transduced CD8+ TCM against NB4-B7 cells analyzed for E/T titrations ranging from 5:1 to 0.0031:1 using a constant target cell amount of 20.000 for different periods of co-cultivation (4 and 20 h). The dashed line in each graph represents theoretically an E/T of 1:1. The percentage of killing was calculated using absolute counts of remaining NB4-B7 target cells normalized to non-transduced T cells by flow cytometry (n = 2, *81.2% transduction efficiency for TCRF5.4, 80.0% for TCR2.5D6, MFI TCRF5.4 = 20818, TCR2.5D6 = 34608). (C,G,H) Non-transduced TCM were used as negative controls and standard deviations of the mean of triplicates are shown if not otherwise stated. Transduction efficiency and MFI of both TCRs are either bracketed or referred by an asterisk (*) to the legend. IFN-γ ELISA was performed using supernatants of co-incubations (C,G,H) and multiplexed cytokine analysis by flow cytometry (F,Gi−iv). (D) Mann–Whitney test: ns: not significant (p > 0.05), (F) Multiple t-test with false discovery rate (FDR) of 1%, ***p < 0.001.
Figure 2
Figure 2
TCR2.5D6-transduced T cells show superior in vivo tumor killing efficacy. (A) FACS analysis of transduction efficacy for TCRF5.4- and TCR2.5D6-transduced T cells used for the long-term mouse experiment. The plots show pre-gated living CD3+ cells. X-axis represents the CD8 marker and Y-axis represents the TCRm+ T-cells. (B) Functionality of TCR-transduced T cells used for the long-term survival experiment of mice shown in (C) measured by IFN-γ release (right) and cytotoxicity (left) after co-cultivation for 24 h with NB4-B7 tumor cells in an E/T ratio of 1:1 in vitro. (C) Growth kinetic of NB4-B7eGFP tumors in NSG mice for a period of 58 days. Each line represents an individual tumor growth curve per mouse: n.t (n = 7), TCRF5.4 (n = 7), TCR2.5D6 (n = 7). (D) Kaplan Meier curve of mice shown in (C), ***p ≤ 0.0002. (E) Percentage of GFP+/HLA-B7+/NB4-B7eGFP tumors cell analyzed ex vivo by flow cytometry at individual time points after decease of mice shown in (C). Non-transduced (n = 7), TCRF5.4-transduced (n = 7) or TCR2.5D6-transduced T cells (n = 7), nsp ≥ 0.05, ***p = 0.0006. (F) Percentage of CD3+/TCRm+ living cells in BM, blood, lung, spleen, and tumor analyzed ex vivo by flow cytometry at individual time points after T-cell injection after decease of mice shown in (C). n.t (n = 7), TCRF5.4-transduced (n = 7) or TCR2.5D6-transduced T cells (n = 7). (C) Transduction efficiency and MFI of both TCRs are bracketed. (E) Significances are calculated by Mann-Whitney Test. (D) Survival statistics are calculated by Log-rank (Mantel-Cox) test.
Figure 3
Figure 3
MPO5-HLA-B7 complex is superior in comparison to MPO2-HLA-B7 with respect to stability and binding quality. (A) IFN-γ release by TCRF5.4 together PBMC in response to HLA-B7+ LCL1 cell line pulsed with MPO2 or the non-americ counter partners LTPAQLNVL (MPO2+L1) or TPAQLNVLS (MPO2+S9), respectively. An E/T ratio of 1:1 was used. IFN-γ secretion of the supernatants after co-cultivation was measured by IFN-γ ELISA. Standard deviations of the mean of triplicates are shown (n = 2). (B) Beta-2-microglobulin (B2M)-ELISA of UV-mediated peptide exchanged HLA-B7 monomers. V50 values of a Boltzmann fitting for each MPO-peptide was determined by the optical density of B2M after degraded amounts of MPO-peptides were used for HLA-stabilization. Standard deviations of the mean of triplicates are shown (n = 3). (C) Pooled results of (B) for MPO5 (n = 4), MPO2 (n = 4), and MPO2+L1 (n = 3). Significance is calculated by Mann-Whitney Test: *p = 0.0286.
Figure 4
Figure 4
MPO2/5-HLA-B7 structure-based modeling revealed less fluctuation of MPO5 within the HLA-binding cleft compared to MPO2. (A,B) Representative conformation of MPO2/5 in the bound state. The HLA-B7 protein is shown as cartoon representation (gray), the bound peptides are depicted in stick representation and are highlighted: (hydrogen atoms: white, nitrogen atoms: blue, oxygen atoms: red, carbon atoms: orange or violet), solvent-exposed peptide residues (violet carbon atoms), peptide residues accommodated by the MHC peptide binding cleft (orange carbon atoms). In the green inlays, the HLA-B7 residues S97 and D114 (blue sticks) are shown for a direct comparison of major differences in the MPO2/5 HLA-B7 binding modes and anchoring to the HLA-B7 peptide binding cleft. Peptide backbones are shown in orange cartoon representation. (A) The green inlay depicts the MPO2 residues A3 and L5, accommodated by the MHC peptide binding cleft. (B) The green inlay depicts the MPO5 residue R3. Hydrogen bonds are highlighted in magenta. (C,D) Space filling models showing the TCR interface of the MPO2/5-HLA-B7 complexes. Protein is depicted in gray and the bound peptides are depicted as van der Waals (vdW) surface colored according to their electrostatic potential (white: neutral areas, red: negatively charged areas, blue: positively charged areas). Solvent-exposed and TCRF5.4- or TCR2.5D6-accessible residues of the MPO2/5-HLA-B7 complexes are highlighted with yellow circles, respectively. (E) Calculated root mean square fluctuations (RMSF) of Cα atoms of the HLA-B7-bound MPO2/5 peptides (red) and G6A (green)/G6T (blue) variants of MPO5 (average of three independent MD simulations). The individual TCR-recognition motif from the alanine- and threonine- (Ala/Thr)-scans is shown together with the IFN-γ release (transparent yellow bars) observed in the Ala- or Thr-scan (Supplementary Figures 1J,K) relative to individual wildtype IFN-γ secretion (empty bars) below the RMSF plots. The height of the empty bars reflects the maximal IFN-γ release elicited by the wildtype peptide, ↑ = interchangeable amino acid residues. The Ala/Thr-scan for MPO5 is described elsewhere (27). (F) Root mean square deviation (RMSD) of HLA-B7 protein backbone heavy atoms and MPO2/5 heavy atoms during MD simulations calculated with respect to the initial energy minimized peptide-HLA-B7 complex models.
Figure 5
Figure 5
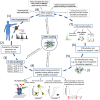
Workflow for identification of allo-MHC-restricted tumor-reactive TCRs. Proposed workflow for TCR identification: (1) Immunopeptidomics of patient samples and tumor material; (2) Evaluation of antigen expression on human tissues; (3,4) in silico prediction of candidate peptides for first ranking and experimental validation by HLA-affinity and/or HLA-stability assays in combination with p-MHC modeling; (5,6) TCR identification and TCR isolation; (7) TCR characterization with special interest to TCR surface presentation, cytokine secretion and specificity; (8) Characterization of the safety profile of TCR-transgenic T cells using LCL cell lines, amino acid substitution experiments and screening of homologous peptides in combination with structure-based modeling approaches. Critical assays for the identification of suitable TCR and peptides used in our analyses are highlighted in bold characters.

References

    1. Porter DL, Levine BL, Kalos M, Bagg A, June CH. Chimeric antigen receptor-modified T cells in chronic lymphoid leukemia. N Engl J Med. (2011) 365:725–33. 10.1056/NEJMoa1103849 - DOI - PMC - PubMed
    1. Xue SA, Gao L, Hart D, Gillmore R, Qasim W, Thrasher A, et al. . Elimination of human leukemia cells in NOD/SCID mice by WT1-TCR gene-transduced human T cells. Blood. (2005) 106:3062–7. 10.1182/blood-2005-01-0146 - DOI - PubMed
    1. Jahn L, Hombrink P, Hagedoorn RS, Kester MG, van der Steen DM, Rodriguez T, et al. . TCR-based therapy for multiple myeloma and other B-cell malignancies targeting intracellular transcription factor BOB1. Blood. (2017) 129:1284–95. 10.1182/blood-2016-09-737536 - DOI - PubMed
    1. Mastaglio S, Genovese P, Magnani Z, Ruggiero E, Landoni E, Camisa B, et al. . NY-ESO-1 TCR single edited stem and central memory T cells to treat multiple myeloma without graft-versus-host disease. Blood. (2017) 130:606–18. 10.1182/blood-2016-08-732636 - DOI - PubMed
    1. Robbins PF, Morgan RA, Feldman SA, Yang JC, Sherry RM, Dudley ME, et al. . Tumor regression in patients with metastatic synovial cell sarcoma and melanoma using genetically engineered lymphocytes reactive with NY-ESO-1. J Clin Oncol. (2011) 29:917–24. 10.1200/JCO.2010.32.2537 - DOI - PMC - PubMed

Publication types