. 2019 Oct;18(5):e13004.
doi: 10.1111/acel.13004. Epub 2019 Jul 18.

Wnt/β-catenin/RAS signaling mediates age-related renal fibrosis and is associated with mitochondrial dysfunction

Affiliations

Wnt/β-catenin/RAS signaling mediates age-related renal fibrosis and is associated with mitochondrial dysfunction

Jinhua Miao et al. Aging Cell. 2019 Oct.

Erratum in

Abstract

Renal fibrosis is the common pathological feature in a variety of chronic kidney diseases. Aging is highly associated with the progression of renal fibrosis. Among several determinants, mitochondrial dysfunction plays an important role in aging. However, the underlying mechanisms of mitochondrial dysfunction in age-related renal fibrosis are not elucidated. Herein, we found that Wnt/β-catenin signaling and renin-angiotensin system (RAS) activity were upregulated in aging kidneys. Concomitantly, mitochondrial mass and functions were impaired with aging. Ectopic expression of Klotho, an antagonist of endogenous Wnt/β-catenin activity, abolished renal fibrosis in d-galactose (d-gal)-induced accelerated aging mouse model and significantly protected renal mitochondrial functions by preserving mass and diminishing the production of reactive oxygen species. In an established aging mouse model, dickkopf 1, a more specific Wnt inhibitor, and the mitochondria-targeted antioxidant mitoquinone restored mitochondrial mass and attenuated tubular senescence and renal fibrosis. In a human proximal tubular cell line (HKC-8), ectopic expression of Wnt1 decreased biogenesis and induced dysfunction of mitochondria, and triggered cellular senescence. Moreover, d-gal triggered the transduction of Wnt/β-catenin signaling, which further activated angiotensin type 1 receptor (AT1), and then decreased the mitochondrial mass and increased cellular senescence in HKC-8 cells and primary cultured renal tubular cells. These effects were inhibited by AT1 blocker of losartan. These results suggest inhibition of Wnt/β-catenin signaling and the RAS could slow the onset of age-related mitochondrial dysfunction and renal fibrosis. Taken together, our results indicate that Wnt/β-catenin/RAS signaling mediates age-related renal fibrosis and is associated with mitochondrial dysfunction.

Keywords: Wnt/β-catenin; aging; mitochondrial dysfunction; renal fibrosis.


Conflict of interest statement

None declared.

Figures
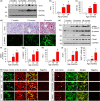
Figure 1
Figure 1
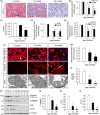
Renal Wnt/β‐catenin signaling is time‐dependently induced in kidneys during aging. (a–c) Western blot analyses show renal expression of Wnt1 and Wnt10b. Graphical representations of (b) Wnt1 and (c) Wnt10b protein expression levels in different groups are presented. *p < .05 versus 7‐month‐old mice (n = 5–6). (d) Representative micrographs show renal expression of Wnt1 and β‐catenin. Arrows indicate positive staining. Scale bar, 50 µm. (e–i) Western blot analyses show renal expression of the active form and total β‐catenin, as well as its targets PAI‐1 and Snail1. Graphical representations of (f) active β‐catenin, (g) β‐catenin, (h) PAI‐1, and (i) Snail1 protein expression levels in different groups are presented. *p < .05 versus 7‐month‐old mice (n = 5–6). (j) Graphical representation of the relative abundance of MMP‐7 mRNA. *p < .05 versus 7‐month‐old mice (n = 5–6). (k) Colocalization of active β‐catenin and various segment‐specific tubular markers in aging kidneys. Frozen kidney sections from 24‐month‐old mice were immunostained for various segment‐specific tubular markers (green) and active β‐catenin (red). Segment‐specific tubular markers were used as follows: proximal tubule, Lotus tetragonolobus lectin (LTL); distal tubule, thiazide‐sensitive NaCl cotransporter (NCC); and collecting duct, aquaporin‐3 (AQP3). Sections incubated with secondary antibodies alone (omitting primary antibody) were used as negative controls (right panel). Arrows indicate positive tubules with colocalization of active β‐catenin and specific tubular makers. Scale bar, 75 μm. (l) Colocalization of β‐catenin and multiple cell type markers in kidneys from 24‐month‐old mice. Frozen kidney sections were co‐stained with various cell type‐specific markers (red) and β‐catenin (green). Cell markers were used as follows: macrophage, mannose R; fibroblasts, PDGFRβ; and endothelial cell, EMCN. Sections incubated with secondary antibodies alone (omitting primary antibody) were used as negative controls (right panel). Arrowheads indicate colocalization of β‐catenin and specific cell makers. Scale bar, 75 μm
Figure 2
Figure 2
Renin–angiotensin system activity and cellular senescence are increased in aging kidneys. (a–c) Western blot analyses show the expression of renin and AT1. Graphical representations of (b) renin and (c) AT1 protein expression levels in different groups are presented. *p < .05 versus 7‐month‐old mice (n = 5–6). (d) Representative micrographs show the expression of AT1, AGT, and ACE in kidneys. Arrows indicate positive staining. Scale bar, 50 μm. (e) Representative staining micrographs show the expression of SA‐β‐gal activity, p16INK4A, and γH2AX in kidneys. Paraffin kidney sections were immunostained with an antibody against p16INK4A, which displays the expression in the nucleus and tubular cytoplasmic area. Paraffin sections were also stained for γH2AX, which displays nuclear location. Frozen kidney sections were stained for SA‐β‐gal activity, which appears as bright‐blue granular staining in the cytoplasm of tubular epithelial cells. Arrows indicate positive staining. Scale bar, 50 µm. LPF, low‐power field; HPF, high‐power field. (f–h) Western blot analyses show renal expression of p16INK4A and γH2AX. Graphical representations of (g) p16INK4A and (h) γH2AX protein expression levels in different groups are presented. *p < .05 versus 7‐month‐old mice (n = 5–6)
Figure 3
Figure 3
Mitochondrial homeostasis is impaired in aging kidneys. (a) Representative micrographs show renal expression of PGC‐1α. Arrow indicates positive staining. Scale bar, 50 μm. (b) Graphical representations of the relative abundance of mitochondrial factors mRNA in kidneys. PGC‐1α and TFAM mRNA levels in different groups were assessed by real‐time PCR. *p < .05 versus 7‐month‐old mice (n = 5–6). (c) Mitochondrial DNA (mtDNA) content in kidneys was analyzed. Total DNA was extracted and amplified with the primer of mitochondrial cytochrome c oxidase 2 (COX2) and normalized to ribosomal protein s18 (RSP18). *p < .05 versus 7‐month‐old mice (n = 5–6). (d–e) Graphical representations of the relative abundance of mitochondrial‐encoded OXPHOS genes are presented. Cytb, ATP6, COX1, and COX2 mRNA levels in different groups were assessed by real‐time PCR. *p < .05 versus 7‐month‐old mice (n = 5–6). (f) Representative fluorescence and transmission electron microscopy micrographs show mitochondrial mass, ROS production, and ultrastructure morphology. The frozen kidney sections were stained with MitoTracker deep red (3 μm) and mitoSOX (3.5 μm) probes. DAPI (4′,6‐diamidino‐2‐phenylindole) was used to stain the nuclei (blue). Ultrathin kidney sections were studied using a transmission electron microscope. For MitoTracker and mitoSOX staining, arrows indicate positive staining; For TEM analyses, arrow indicates abnormal characteristics of swollen shape and fragmented cristae in mitochondria. Scale bar, 50 μm for MitoTracker and mitoSOX staining; 1 μm for electron microscope micrographs. TEM, transmission electron microscopy. (g) Quantification of mitochondrial mass in kidneys is shown. Mitochondrial mass was determined by the rate of MitoTracker deep red fluorescence intensity normalized to DAPI. *p < .05 versus 7‐month‐old mice (n = 5–6). (h–l) Representative (h) Western blots and graphical representations of (i) phospho‐PGC‐1α, (j) TOMM20, (k) Cytb, and (l) COX1 protein expression levels in different groups are presented. *p < .05 versus 7‐month‐old mice (n = 5–6)
Figure 4
Figure 4
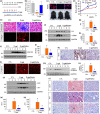
Klotho ameliorates age‐related renal fibrosis in vivo. (a) Experimental design. Red arrows indicate the injections of pcDNA3 or pV5‐sKlotho plasmid. Blue line indicates the timing of d‐gal treatment. (b) Graphical representation of Klotho protein expression levels in different groups. *p < .05 versus control mice; †p < .05 versus d‐gal‐treated mice (n = 5–6). (c) Representative immunofluorescence micrographs show Klotho expression in kidneys. Scale bar, 25 µm. And representative photographs show Klotho reversed d‐gal‐induced growth retardation. Klo, Klotho. (d) Graphical representation shows Klotho increased body weight gain in d‐gal‐treated mice. *p < .05 versus control mice; †p < .05 versus d‐gal‐treated mice (n = 5–6). (e) Representative micrographs show Masson trichrome staining and collagen I expression in kidneys. Paraffin sections were used for Masson trichrome staining. Frozen sections were used for immunofluorescence staining of collagen I. Arrows indicate positive staining. Scale bar, 25 µm. (f–h) Representative (f) Western blots and graphical representations of (g) fibronectin and (h) α‐SMA are presented. FN, fibronectin. *p < .05 versus control mice; †p < .05 versus d‐gal‐treated mice (n = 5–6). (i–j) Representative (i) Western blots and graphical representation of (j) Wnt10b in kidneys are presented. *p < .05 versus control mice; †p < .05 versus d‐gal‐treated mice (n = 5–6). (k–l) Representative micrographs show renal expression of (k) Wnt1 and (l) β‐catenin. Paraffin kidney sections were immunostained with an antibody against Wnt1. Frozen kidney sections were immunostained with an antibody against β‐catenin. Arrows indicate positive staining. Scale bar, 25 µm. (m, n) Representative (m) Western blots and graphical representation of (n) active β‐catenin protein expression in kidneys are presented. *p < .05 versus control mice; †p < .05 versus d‐gal‐treated mice (n = 5–6). (o–q) Representative (o) Western blots and graphical representations of (p) AGT and (q) AT1 protein expression levels in different groups are presented. *p < .05 versus control mice; †p < .05 versus d‐gal‐treated mice (n = 5–6). (r) Representative micrographs show renal expression of AGT, AT1, and ACE. Paraffin kidney sections were used for immunohistochemistry staining. Arrows indicate positive staining. Scale bar, 25 µm
Figure 5
Figure 5
Ectopic expression of Klotho protects renal mitochondrial homeostasis and inhibits tubular senescence in an accelerated aging mouse model. (a) Renal expression of PGC‐1α mRNA in different groups was assessed by real‐time PCR. *p < .05 versus control mice; †p < .05 versus d‐gal‐treated mice (n = 5–6). (b) Representative micrographs show renal expression of PGC‐1α. Paraffin sections were immunostained for PGC‐1α. Arrows indicate positive staining. Scale bar, 50 µm. (c–h) Representative (c) Western blots and graphical representations of (d) phospho‐PGC‐1α, (e) TFAM, (f) COX1, (g) Cytb, and (h) TOMM20 protein expression levels in different groups are presented. *p < .05 versus control mice; †p < .05 versus d‐gal‐treated mice (n = 5–6). (i) Quantification of renal mitochondrial mass is shown. Mitochondrial mass was determined by the fluorescence intensity of MitoTracker deep red staining normalized to DAPI. *p < .05 versus control mice; †p < .05 versus d‐gal‐treated mice (n = 5–6). (j) Representative micrographs show mitochondrial ROS production and ultrastructure. They were assessed by mitoSOX staining and electron microscopy analyses, respectively. The administration of d‐gal induced mitochondrial ROS production, mitochondrial swelling, and cristae disorganization in renal tubular cells. Arrows indicate positive staining. Ectopic expression of Klotho inhibited mitochondrial ROS production and preserved normal structure of mitochondria. Scale bar in mitoSOX staining, 50 μm. Scale bar in TEM, 1 μm. TEM, transmission electron microscopy. (k) Representative staining micrographs show renal expression of p16INK4A, SA‐β‐gal activity, and γH2AX. Paraffin kidney sections were stained with antibodies against p16INK4A and γH2AX. Frozen kidney sections were stained for SA‐β‐gal activity. Arrows indicate positive staining. Scale bar, 25 μm. (l–n) Representative (l) Western blots and graphical representations of (m) p16INK4A and (n) p19ARF protein expression levels in kidneys are presented. *p < .05 versus control mice; †p < .05 versus d‐gal‐treated mice (n = 5–6)
Figure 6
Figure 6
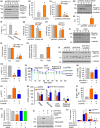
DKK1 and mitoQ preserve mitochondrial functions and inhibit cellular senescence in an established aging model. (a) Experimental design. Red arrows indicate the starting point of d‐gal injection. Green arrows indicate the injections of pFlag‐DKK1 plasmid. Green bar indicates treatment with mitoQ. (b–e) Representative (b) Western blots and graphical representations of (c) DKK1, (d) active β‐catenin, and (e) TOMM20 are presented. *p < .05 versus control mice; †p < .05 versus d‐gal‐treated mice (n = 5–6). (f) Representative MitoTracker and mitoSOX staining micrographs show the mitochondrial mass loss and ROS production induced by d‐gal were blocked by DKK1 or mitoQ. Arrows indicate positive staining. Scale bar, 50 µm. (g) Representative staining micrographs show renal expression of SA‐β‐gal activity, γH2AX, fibronectin, PDGFRβ, and Sirius red staining. Frozen kidney sections were stained for SA‐β‐gal activity, fibronectin, and PDGFRβ. Paraffin sections were immunostained with an antibody against γH2AX or performed with Sirius red staining. Arrows indicate positive staining. Scale bar, 50 μm. (h–k) Representative (h) Western blots and graphical representations of (i) γH2AX, (j) fibronectin, and (k) α‐SMA protein expression levels in kidneys are presented. *p < .05 versus control mice; †p < .05 versus d‐gal‐treated mice (n = 5–6). (l) Quantitative determination of renal fibrotic lesions in different groups. *p < .05 versus control mice; †p < .05 versus d‐gal‐treated mice (n = 5–6)
Figure 7
Figure 7
Wnt/β‐catenin/RAS axis plays a central role in mitochondrial dysfunction and cellular senescence in renal tubular cells. (a–c) Representative (a) Western blots and graphical representations of (b) active β‐catenin, (c) phospho‐PGC‐1α, and TFAM protein expression levels in different groups are presented. HKC‐8 cells were transfected with empty vector (pcDNA3) or Wnt1 expression plasmid (pHA‐Wnt1) for 24 hr. Whole‐cell lysates were analyzed by Western blot. *p < .05 versus pcDNA3 group (n = 3). (d–f) Representative (d) Western blots and graphical representations of (e) AT1 and (f) phospho‐PGC‐1α are presented. HKC‐8 cells were transfected with empty vector (pcDNA3) or β‐catenin expression plasmid (pDel‐β‐catenin) for 24 hr. Whole‐cell lysates were analyzed by Western blot. *p < .05 versus pcDNA3 group (n = 3). (g–h) Graphical representations of the relative mRNA abundance of mitochondrial‐encoded OXPHOS genes in two groups are presented. The mRNA levels of (g) TFAM and Cytb, as well as (h) COX1 and COX2 in two groups, were assessed. HKC‐8 cells were transfected with empty vector (pcDNA3) or β‐catenin expression plasmid (pDel‐β‐catenin) for 24 hr. Total RNA was extracted and analyzed by quantitative real‐time PCR. *p < .05 versus pcDNA3 group (n = 3). (i, j) Representative (i) Western blots and graphical representations of (j) phospho‐PGC‐1α and TFAM are presented. HKC‐8 cells were treated with AngII (10 nM) for 24 hr. Whole‐cell lysates were analyzed by Western blot. *p < .05 versus the control group (n = 3). Ctrl, control. (k) Graphical representation shows AngII significantly induced mitochondrial superoxide production in HKC‐8 cells. HKC‐8 cells were treated with AngII (10 nM) for 12 hr and then incubated with mitochondrial superoxide indicator mitoSOX™ Red (5 μM) as manufacturer's instruction. The fluorescence was analyzed by flow cytometry. *p < .05 versus the control group (n = 3). Ctrl, control. (l–n) Representative (l) Western blots and graphical representations of (m) phospho‐PGC‐1α and (n) p16INK4A are presented. HKC‐8 cells were pretreated with losartan (10 μM) for 1 hr and then transfected with Wnt1 expression plasmid for 24 hr. *p < .05 versus pcDNA3 group; †p < .05 versus pHA‐Wnt1 group (n = 3). (o) An analysis of O2 consumption in renal tubular cells. HKC‐8 cells were pretreated with losartan (10 μM) for 1 hr and then transfected with Wnt1 expression plasmid for 24 hr. OCR was first measured in approximately 3 × 104 cells of each group under basal condition. Those cells then were sequentially added oligomycin (1 μM), FCCP (0.5 μM), rotenone (0.5 μM), and antimycin A (0.5 μM) to determine different parameters of mitochondrial functions according to the manufacturer's instructions. (p) Graphical representations of basal OCR, maximal OCR, ATP‐linked OCR, and reserve capacity. The average of four determinations for each group is shown. *p < .05 versus pcDNA3 group; †p < .05 versus pHA‐Wnt1 group (n = 4). (q) Graphical representation of mitochondrial membrane potential (MMP). MMP was detected by JC‐1 staining and analyzed by flow cytometry. After pretreatment with losartan (10 μM) for 1 hr, HKC‐8 cells were transfected with Wnt1 expression plasmid for 24 hr and then stained with JC‐1. The MMP is shown as the ratio of the fluorescence intensity at absorbance of 590 nm (JC‐1 aggregate) to 520 nm (JC‐1 monomer). *p < .05 versus pcDNA3 group; †p < .05 versus pHA‐Wnt1 group (n = 3). (r) Graphical representation of β‐galactosidase‐positive cells. After pretreatment with losartan (10 μM) for 1 hr, HKC‐8 cells were transfected with Wnt1 expression plasmid for 24 hr and then stained for β‐galactosidase activity. *p < .05 versus pcDNA3 group; †p < .05 versus pHA‐Wnt1 group (n = 3). (s) Graphical representation of mitochondrial mass determined by flow cytometry analysis of NAO fluorescence. The mean fluorescence intensities of 10,000 events were counted for each cell population. After pretreatment with losartan (10 μM) for 1 hr, HKC‐8 cells were transfected with Wnt1 expression plasmid for 24 hr and then stained with NAO (5 μM). *p < .05 versus pcDNA3 group; †p < .05 versus pHA‐Wnt1 group (n = 3). (t, u) Representative (t) Western blots and graphical representations of (u) p16INK4A and fibronectin are presented. HKC‐8 cells were pretreated with resveratrol (50 μM) or mitoQ (100 nM) for 1 hr and then transfected with Wnt1 expression plasmid for 24 hr. Whole‐cell lysates were analyzed by Western blot. *p < .05 versus pcDNA3 group; †p < .05 versus pHA‐Wnt1 group (n = 3)
Figure 8
Figure 8
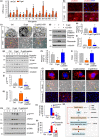
Wnt/β‐catenin mediates age‐related renal fibrosis in vitro. (a) Real‐time PCR results show d‐gal induced upregulation of multiple Wnt genes in cultured proximal tubular cell line (HKC‐8). HKC‐8 cells were treated with d‐gal (10 mg/ml) for 60 hr. Total RNA was extracted and analyzed for various Wnt mRNA expression levels. *p < .05 versus control group. Ctrl, control. (b) Representative immunofluorescence micrographs show d‐gal induced nuclear translocation of β‐catenin. HKC‐8 cells were treated with d‐gal (10 mg/ml) for 60 hr and then stained for β‐catenin (red) and DAPI (blue). Arrows indicate nuclear staining of β‐catenin. Scale bar, 20 μm. (c) Representative electron microscopy and BrdU incorporation assay micrographs show mitochondria and cell proliferation in renal tubular cells. HKC‐8 cells were pretreated with ICG‐001 (5 μm) for 1 hr and then treated with d‐gal (10 mg/ml) for 60 hr. BrdU (10 μM) was added for 12 hr before collection. For TEM analyses, arrows indicate healthy mitochondria, and arrowheads indicate abnormal‐shaped mitochondria. Scale bar, 2 μm; for BrdU incorporation assay, arrows indicate BrdU incorporation positive cells. Scale bar, 75 μm. TEM, transmission electron microscopy. (d–f) Representative (d) Western blots and graphical representations of (e) phospho‐PGC‐1α and (f) fibronectin are presented. HKC‐8 cells were pretreated with ICG‐001 (5 μm) for 1 hr and then treated with d‐gal (10 mg/ml) for 60 hr. *p < .05 versus control group; †p < .05 versus d‐gal group (n = 3). (g–k) Representative (g) Western blots and graphical representations of (h) phospho‐PGC‐1α, (i) TFAM, (j) p16INK4A, and (k) fibronectin are presented. HKC‐8 cells were pretreated with losartan (10 μM) for 1 hr and then treated with d‐gal (10 mg/ml) for 60 hr. *p < .05 versus control group; †p < .05 versus d‐gal group (n = 3). (l) Representative fluorescence micrographs show MitoTracker, BrdU, and fibronectin staining. After pretreatment with losartan (10 μM) or mitoQ (100 nM) for 1 hr, HKC‐8 cells were treated with d‐gal (10 mg/ml) for 60 hr. BrdU (10 μM) was added for 12 hr before collection. Cells were stained with MitoTracker deep red probe (300 nM) or antibodies against BrdU and fibronectin. Arrowhead indicates the loss of mitochondrial mass and the increase in fragmentation of cristae. Arrows indicate positive staining for BrdU‐positive cells and fibronectin. Scale bar, 10 μm for images of MitoTracker staining. (m–o) Representative (m) Western blots and graphical representations of (n) p16INK4A and γH2AX, and (o) fibronectin and α‐SMA are presented. HKC‐8 cells were pretreated with mitoQ (100 nM) for 1 hr and then treated with d‐gal (10 mg/ml) for 60 hr. *p < .05 versus control group; †p < .05 versus d‐gal group (n = 3). (p) Schematic presentation depicts the potential mechanism by which Wnt/β‐catenin induces age‐related renal fibrosis. Wnt/β‐catenin signaling triggers the activation of RAS, thereby leading to the injury of mitochondrial biogenesis. This causes mitochondrial dysfunction with a loss of mass and increase in fragmentation and ROS production, which in turn induces tubular cell senescence and age‐related renal fibrosis. The mitochondrial dysfunction and activation of Wnt/β‐catenin signaling reciprocally induce each other. Multiple approaches, such as the inhibition of Wnt/β‐catenin by DKK1, ICG‐001, or Klotho, the blockade of RAS by losartan, the protection of mitochondrial biogenesis by resveratrol, and the mitochondria‐targeted antioxidant mitoQ could slow age‐related renal fibrosis
Figure 9
Figure 9
Wnt/β‐catenin induces age‐related renal fibrosis in primary cultured tubular cells. (a) Representative micrograph shows freshly isolated tubules. Renal tubules were isolated from mouse kidneys and cultivated for primary tubular cells. Scale bar, 50 μm. (b) Representative micrograph shows the staining of E‐cadherin (green) and DAPI (blue). Arrow indicates positive staining. Scale bar, 10 μm. (c) Representative micrographs show the staining of SA‐β‐gal activity. The primary cultured tubular cells were pretreated with Klotho (100 ng/ml) and then treated with d‐gal (10 mg/ml) for 60 hr. SA‐β‐gal activity was assessed according to the manufacturer's instructions. Arrow indicates positive staining. Scale bar, 50 μm. (d–f) Representative (d) Western blots and graphical representations of (e) Wnt1 and (f) active β‐catenin are presented. The primary tubular cells were treated as described. *p < .05 versus control group; †p < .05 versus d‐gal group (n = 3). (g–j) Representative (g) Western blots and graphical representations of (h) phospho‐PGC‐1α (p‐PGC‐1α), (i) COX1, and (j) fibronectin are presented. The primary tubular cells were treated as described. *p < .05 versus control group; †p < .05 versus d‐gal group (n = 3). (k) Representative fluorescence micrographs show the expression of fibronectin. Primary tubular cells were immunostained for fibronectin (red) and counterstained with DAPI (blue). Arrow indicates positive staining. Scale bar, 75 μm

References

    1. An, J. H. , Yang, J.‐Y. , Ahn, B. Y. , Cho, S. W. , Jung, J. Y. , Cho, H. Y. , … Shin, C. S. (2010). Enhanced mitochondrial biogenesis contributes to Wnt induced osteoblastic differentiation of C3H10T1/2 cells. Bone, 47, 140–150. 10.1016/j.bone.2010.04.593 - DOI - PubMed
    1. Barja, G. (2013). Updating the mitochondrial free radical theory of aging: An integrated view, key aspects, and confounding concepts. Antioxidants & Redox Signaling, 19, 1420–1445. 10.1089/ars.2012.5148 - DOI - PMC - PubMed
    1. Bobkova, N. V. , Evgen'ev, M. , Garbuz, D. G. , Kulikov, A. M. , Morozov, A. , Samokhin, A. , … Nudler, E. (2015). Exogenous Hsp70 delays senescence and improves cognitive function in aging mice. Proceedings of the National Academy of Sciences USA, 112, 16006–16011. 10.1073/pnas.1516131112 - DOI - PMC - PubMed
    1. Bo‐Htay, C. , Palee, S. , Apaijai, N. , Chattipakorn, S. C. , & Chattipakorn, N. (2018). Effects of d‐galactose‐induced ageing on the heart and its potential interventions. Journal of Cellular and Molecular Medicine, 22, 1392–1410. 10.1111/jcmm.13472 - DOI - PMC - PubMed
    1. Bruck, K. , Stel, V. S. , Gambaro, G. , Hallan, S. , Volzke, H. , Arnlov, J. … European CKDBC (2016). CKD prevalence varies across the European general population. Journal of the American Society of Nephrology, 27, 2135–2147. 10.1681/ASN.2015050542 - DOI - PMC - PubMed

Publication types

MeSH terms