. 2019 Oct;158(2):104-120.
doi: 10.1111/imm.13098. Epub 2019 Aug 26.

Functionally significant metabolic differences between B and T lymphocyte lineages

Affiliations

Functionally significant metabolic differences between B and T lymphocyte lineages

Jasneet Kaur Khalsa et al. Immunology. 2019 Oct.

Abstract

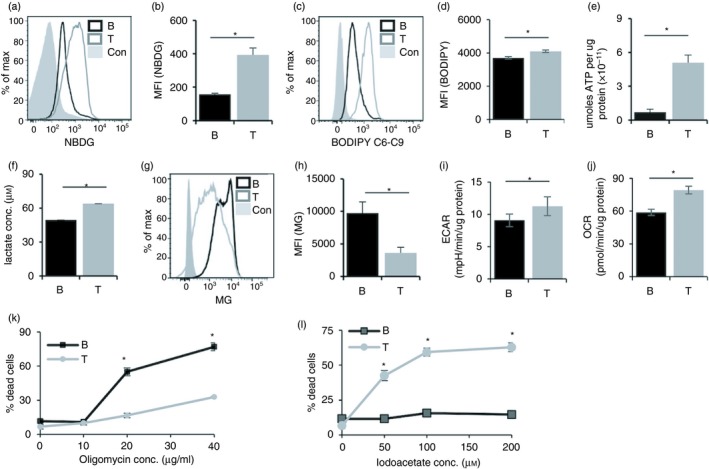
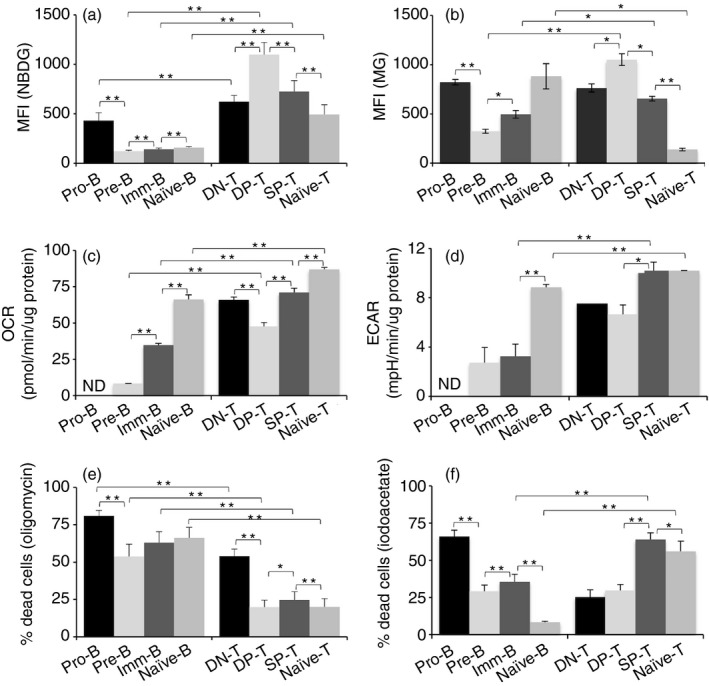
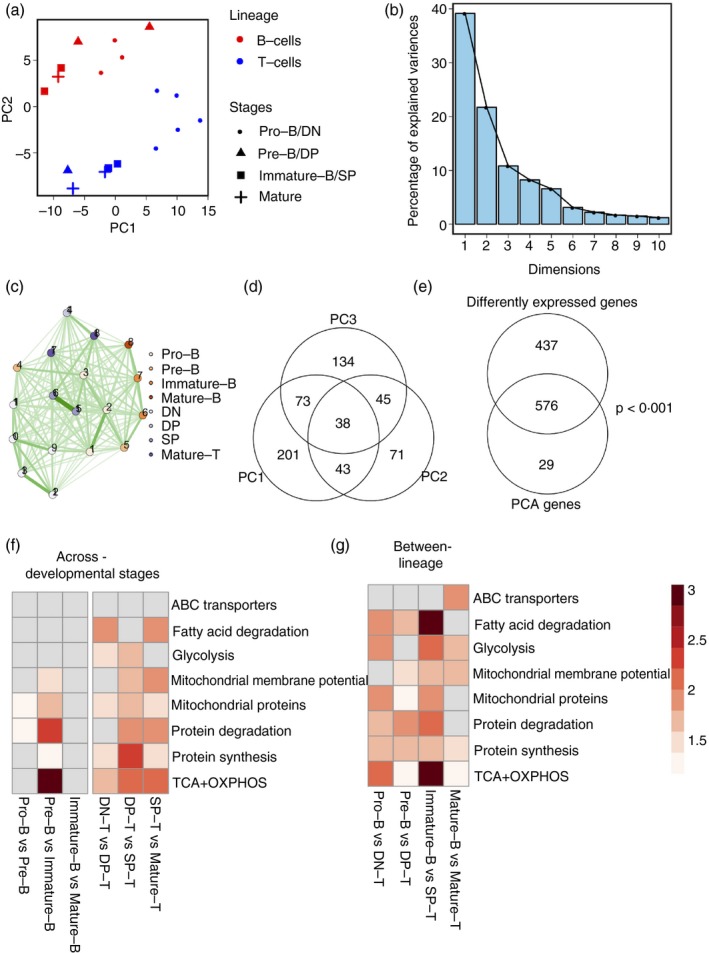
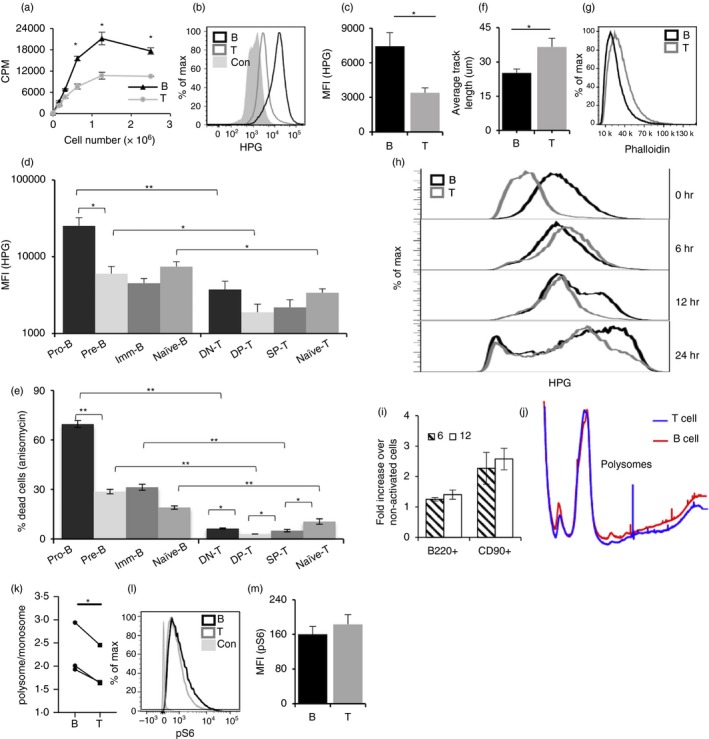
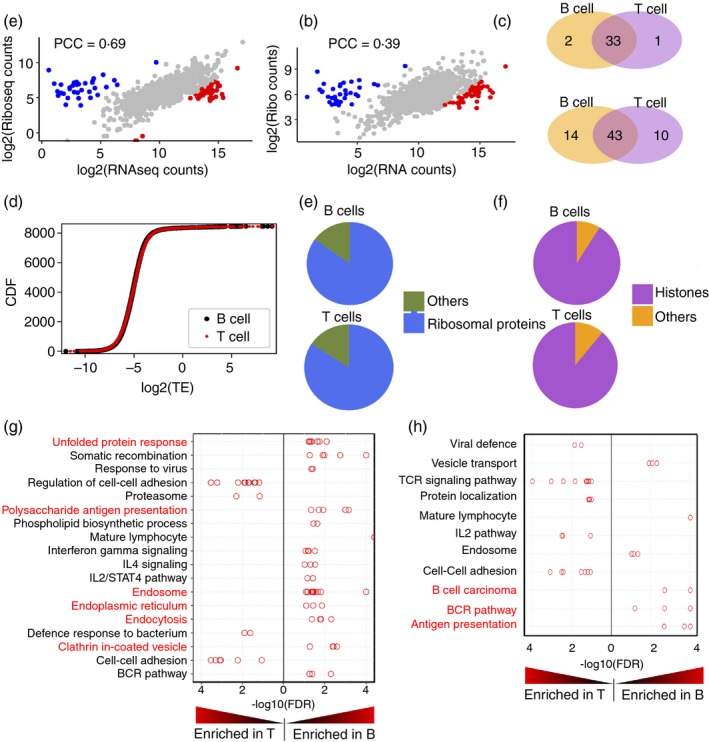
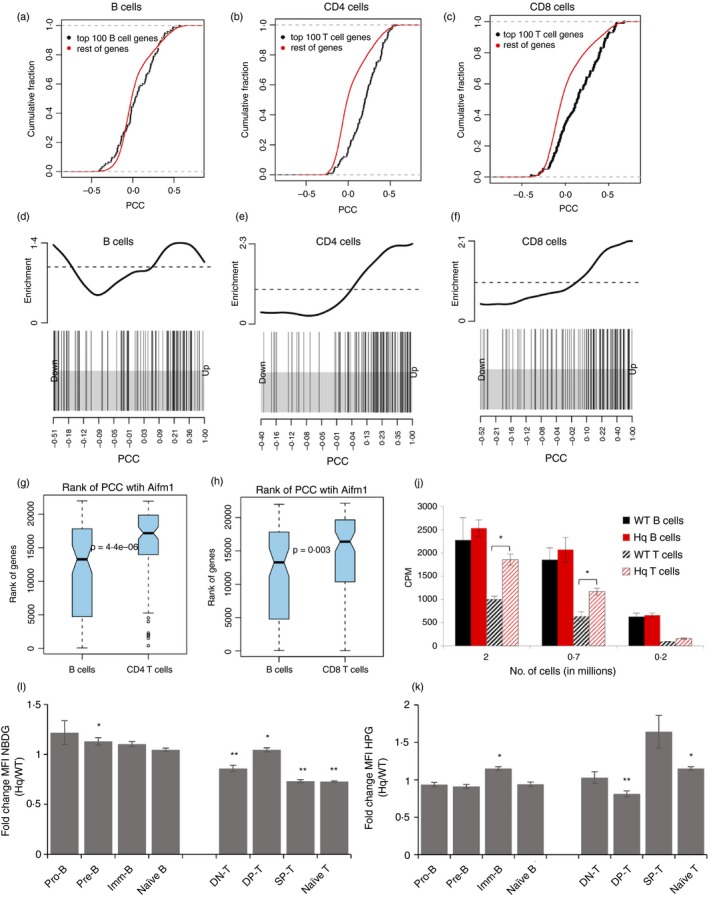
Activation of B and T lymphocytes leads to major remodelling of the metabolic landscape of the cells enabling their post-activation functions. However, naive B and T lymphocytes also show metabolic differences, and the genesis, nature and functional significance of these differences are not yet well understood. Here we show that resting B-cells appeared to have lower energy demands than resting T-cells as they consumed lower levels of glucose and fatty acids and produced less ATP. Resting B-cells are more dependent on OXPHOS, while T-cells show more dependence on aerobic glycolysis. However, despite an apparently higher energy demand, T lineage cells showed lower rates of protein synthesis than equivalent B lineage stages. These metabolic differences between the two lineages were established early during lineage differentiation, and were functionally significant. Higher levels of protein synthesis in B-cells were associated with increased synthesis of MHC class II molecules and other proteins associated with antigen internalization, transport and presentation. The combination of higher energy demand and lower protein synthesis in T-cells was consistent with their higher ATP-dependent motility. Our data provide an integrated perspective of the metabolic differences and their functional implications between the B and T lymphocyte lineages.

Keywords: B-cells; RNA-seq; T-cells; metabolic differences; ribo-seq.


Conflict of interest statement

SR is a non‐executive director of Ahammune Biosciences Private Limited, Pune, India, and a member of the scientific advisory boards of Curadev Pharma Private Limited, NOIDA, India, and Mynvax Private Limited, Bangalore, India. Other authors have no financial interests to declare.

Figures

Figure 1
Figure 1
Functionally significant metabolic distinctions between peripheral B‐ and T‐cells. (a) Representative flow cytometry plot for gated B220+ (black line) and CD90+ (grey line) spleen cells cultured in 100 μm 2‐NBDG for 30 min. Grey histograms represent isotype control. (b) MFI quantification of (a) plotted as mean ± SE from nine mice. (c) Representative flow cytometry plot for Bodipy staining, gated for B220+ (Black line) and CD90+ (grey line). Grey histograms represent isotype control. (d) MFI quantification of (c) plotted as mean ± SE from three mice. (e) ATP content of sorted B220+ and CD90+ cells normalized to protein concentration. Data represent mean ± SE from five mice. (f) Lactate levels in the culture supernatants of sorted B‐and T‐cells. (g) Representative histogram overlays of gated CD90+ (grey line) or B220+ (black line) stained with Mitotracker green (MG). Filled histograms represent negative controls. (h) MFI from (g) plotted from nine individual mice. MFI represented as mean ± SE from nine mice. (i) Extracellular acidification rate (ECAR) of sorted B‐ and T‐cells. (j) Oxygen consumption rate (OCR) of sorted B‐ and T‐cells. Data represent mean ± SE from four mice. (k and l) % cell death of B‐ and T‐cells upon treatment with titrating concentrations of oligomycin and iodoacetate. CD90+ (grey line) or B220+ (black line). Data represented as mean ± SE from eight mice. *P < 0·05.
Figure 2
Figure 2
Differences in energy metabolism are established early during B and T lineage differentiation. (a) Ex vivo spleen, thymus and bone‐marrow cells were cultured in the presence of NBDG for 30 min and counterstained for cell‐surface markers to define subsets. (b) Spleen, thymus and bone‐marrow cells were stained with Mitotracker green (MG) and counterstained for cell‐surface markers. Data represent mean ± SE. n = 9 mice/group. (c and d) Different developmental stages were sorted from spleen, thymus and bone‐marrow, and oxygen consumption rate (OCR) (c) and extracellular acidification rate (ECAR) (d) were analysed. ND: not determined due to insufficient cell numbers. (e and f) Cell death in the presence of oligomycin (e) and iodoacetate (f) are shown. *P < 0·05, **P < 0·01.
Figure 3
Figure 3
B and T lineage cells have divergent expression patterns of metabolic pathway genes. (a) Principal component analysis (PCA) of B and T development subsets according to gene expression in metabolism‐associated genes. PC1 versus PC2 plots showing clustering and separation of the two lineages and developmental stages when metabolism‐associated gene expression levels are considered. (b) Scree plots of (a) showing the percentage of variances explained by each PC. (c) Network map showing Euclidean distances between each cell subset based on expression of metabolism‐associated genes. Nodes represent cell subsets as indicated. Edges indicate the strength of connection, with darker lines indicating closer distances than lighter lines. (d) Overlap in genes that contribute to PC1, PC2 and PC3 indicated by the Venn diagram. (e) Significant overlap in genes differentially expressed between any two cell subsets and genes contributing to the first three PCs. (f) Heatmap showing enrichment scores of each metabolic pathway (rows) for inter‐lineage cell subset pairs (columns). Higher intensity of colour indicates higher enrichment scores. White cells represent no significant enrichment. (g) Heatmap showing enrichment scores of each metabolic pathway (rows) for each developmental transition in B‐cell and T‐cell lineage (columns). Higher intensity of colour indicates higher enrichment scores. White cells represent no significant enrichment.
Figure 4
Figure 4
B‐cells exhibit higher protein synthesis, while T‐cells exhibit higher cell motility. (a) Quantitation of uptake of tritiated leucine by B‐ and T‐cells. (b) Representative flow cytometry plot for l‐homopropargylglycine (HPG) uptake by B‐ and T‐cells. (c) MFI for HPG uptake from (b) quantified and data represented as mean ± SE from nine mice. (d) HPG uptake by developmental intermediates of B‐ and T‐cells. (e) Sensitivity of B‐ and T‐cell intermediates to anisomycin. (f) Motility of sorted B‐ and T‐cells on cultured bone‐marrow‐derived dendritic cells (BMDCs). Data represent average track length ± SE traversed by B‐ and T‐cells in 1 hr in 35–40 individual cells. (g) Actin levels in B‐ and T‐cells measured by Phalloidin. B220+ (black line) and CD90+ (grey line). (h) HPG incorporation of B‐ and T‐cells without activation, upon activation for 6, 12 and 24 hr. (i) MFI from (h) plotted from three individual mice. MFI represented as mean ± SE from 3 mice; 6 hr (filled) and 12 hr (open) histograms. (j) Polysome profile comparison of B‐ and T‐cells. Red traces show B‐cell polysome profile, and blue traces show T‐cell profile. The profiles were normalized for monosome peak height (80 S). (k) Polysome : monosome ratios are shown for B‐ and T‐cells. The data represent three independent experiments and are shown as mean ± SEM (*P < 0·05 in a two‐tailed paired ‘t’‐test). (l) MFI for pS6 expression from (k) quantified and data represented as mean ± SE from nine mice. *P < 0·05, **P < 0·01.
Figure 5
Figure 5
Distinctions in the translatomes and transcriptomes of B‐ and T‐cells. (a and b) Scatter plots showing comparison of normalized RNA‐seq counts and ribosome profiling (ribo‐seq) counts for B‐cells (a) and T‐cells (b). (c) A scatter plot showing the translation efficiency (TE) of mRNAs in B‐ and T‐cell translatomes. (d) Venn diagrams showing the overlap between the gene sets with highest TE (upper panel) and lowest TE (lower panel) in B‐ and T‐cells. (e and f) Pie charts showing the distribution of genes in low TE set (e) and high TE set (f). (g and h) Distribution of ‐log10(P‐value) of gene sets associated with groups identified by Enrichment Map and Autoannotate in ribo‐seq (g) and RNA‐seq (h). Red font indicates the groups that are involved in antigen internalization and presentation.
Figure 6
Figure 6
Apoptosis‐inducing factor (AIF) hypomorphism results in metabolic alterations only in T lineage cells. (a) Cumulative distribution function plots of Pearson correlation coefficient (PCC) of Aifm1 with top 100 B‐cell differentially expressed metabolism‐related genes (black dots) and with the rest of the genes (red) in the B‐cell lineage (P = 0·012). (b and c) Cumulative distribution function plots of PCC of Aifm1 with top 100 T‐cell differentially expressed metabolism‐related genes (black dots) and with the rest of the genes (red) in (b) CD4 lineage (P = 3·5e‐14) and (c) CD8 lineage (P = 1·5e‐07). (d) ‘Barcode plots’ indicating the position of top B‐cell expressed metabolism‐related genes in the ranked list of PCC statistics. PCC between Aifm1 and each gene (in B‐cell lineage) is ranked left to right from lowest to highest (x‐axis). The position of each of the top 100 B‐cell expressed metabolism‐related gene is indicated as a vertical line. The density of the vertical line is indicated in the upper part of the figure. (e and f): similar to (d), but showing the position of top 100 metabolism‐related T‐cell expressed genes in the ranked list of PCC for the (e) CD4 and (f) CD8 lineages. (g and h) Differentially expressed B‐ and T‐cell metabolism‐associated genes are rank ordered according to the PCC values (correlation of each gene with Aifm1) in each lineage separately. Density histograms showing different distributions in (b), CD4 and CD8 lineages. (i and k) Ex vivo spleen, thymus and bone‐marrow cells from wild‐type (WT) and Harlequin (Hq) mice were cultured in the presence of NBDG for 30 min (i) or l‐homopropargylglycine (HPG) for 2 hr (k), and counterstained for cell‐surface markers to define subsets. The ratio of Hq/WT MFI was calculated for each subset. (j) Sorted B220+ and CD90+ cells ere cultured for 12 hr with 3H‐leucine‐containing medium. Data represent mean ± SE of triplicate cultures. *P < 0·05, **P < 0·01.

References

    1. Kondo M, Weissman IL, Akashi K. Identification of clonogenic common lymphoid progenitors in mouse bone marrow. Cell 1997; 91:661–72. - PubMed
    1. LeBien TW, Tedder TF. B lymphocytes: how they develop and function. Blood 2008; 112:1570–80. - PMC - PubMed
    1. Rothenberg EV, Kueh HY, Yui MA, Zhang JA. Hematopoiesis and T‐cell specification as a model developmental system. Immunol Rev 2016; 271:72–97. - PMC - PubMed
    1. Krueger A, Ziętara N, Łyszkiewicz M. T cell development by the numbers. Trends Immunol 2017; 38:128–39. - PubMed
    1. Delmastro‐Greenwood MM, Piganelli JD. Changing the energy of an immune response. Am J Clin Exp Immunol 2013; 2:30–54. - PMC - PubMed

Publication types

MeSH terms