

Improved contraceptive use among women and men in Uganda between 1995-2016: A repeated cross-sectional population study
- PMID: 31318953
- PMCID: PMC6638941
- DOI: 10.1371/journal.pone.0219963
Improved contraceptive use among women and men in Uganda between 1995-2016: A repeated cross-sectional population study
Abstract
Background: Research on contraceptive behaviour changes over time in Uganda is scarce, yet it has among the highest fertility and maternal mortality rates of any country in the East African region. Understanding temporal patterns of contraceptive use for both women and men is vital in evaluating the effectiveness of family planning interventions and strategies, and identifying those with the most unmet need. Using repeated nationally representative cross-sectional samples, this study charts the changes in Uganda's population-based contraceptive use over recent years.
Methods: Five Demographic and Health Survey datasets for Uganda over 21 years, from 1995 to 2016, were sourced and interrogated. Eligible participants included all women aged 15-49 years and men aged 15-54 years. Responses to questions on modern and any (modern or traditional) contraceptive use were analysed. Stratified by gender, weighted regression analyses were employed to detect change over time. The patterns associated with key demographic variables were also investigated.
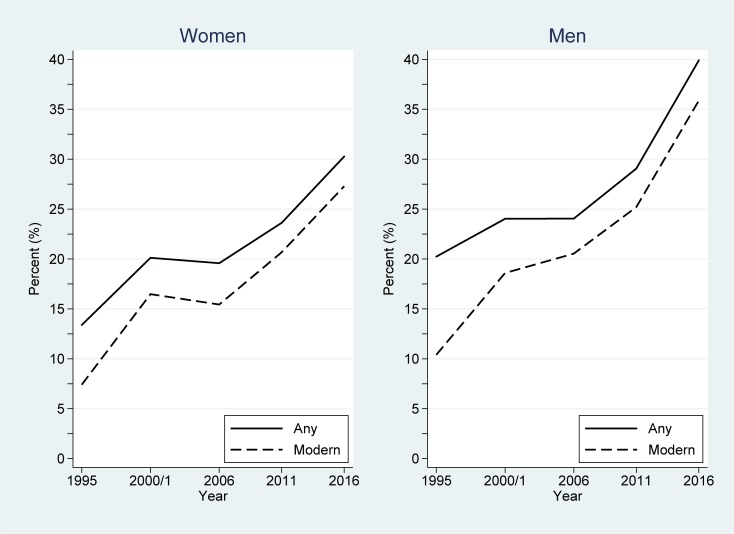
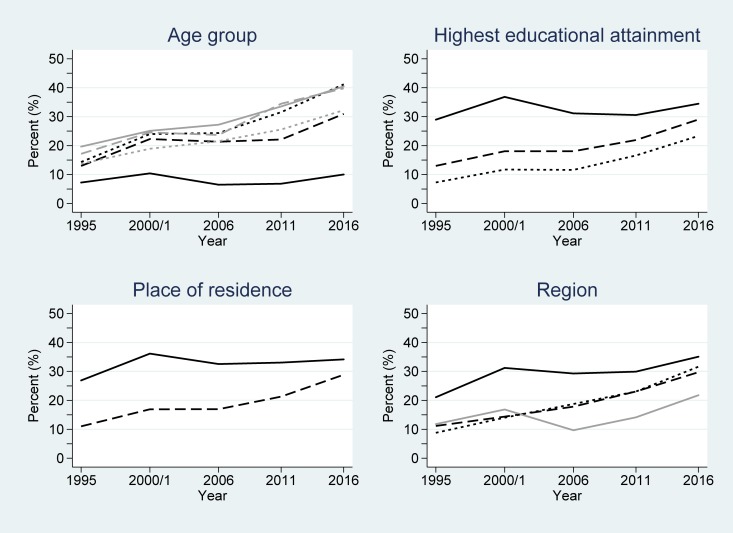
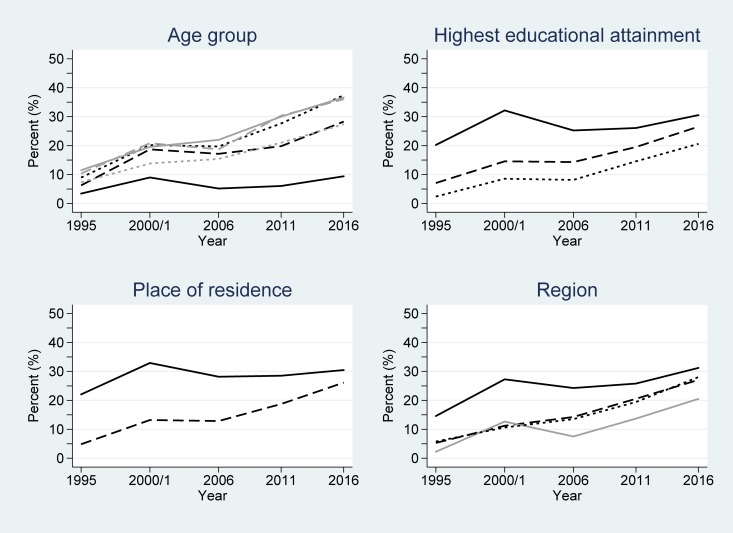
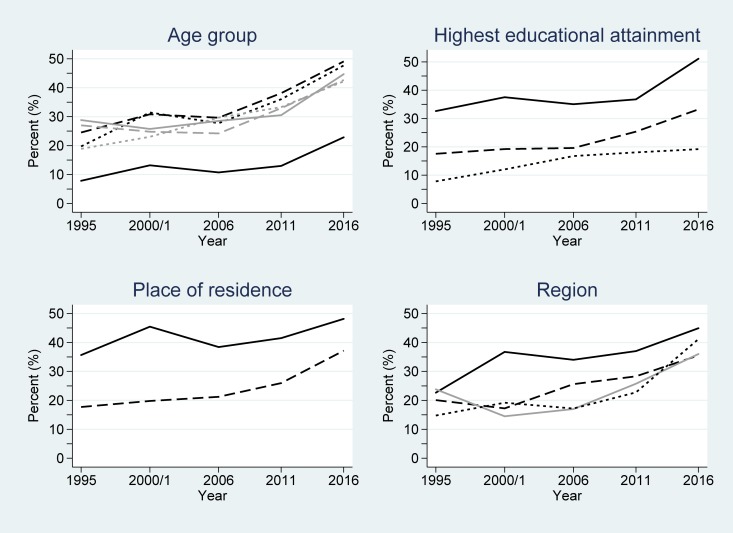
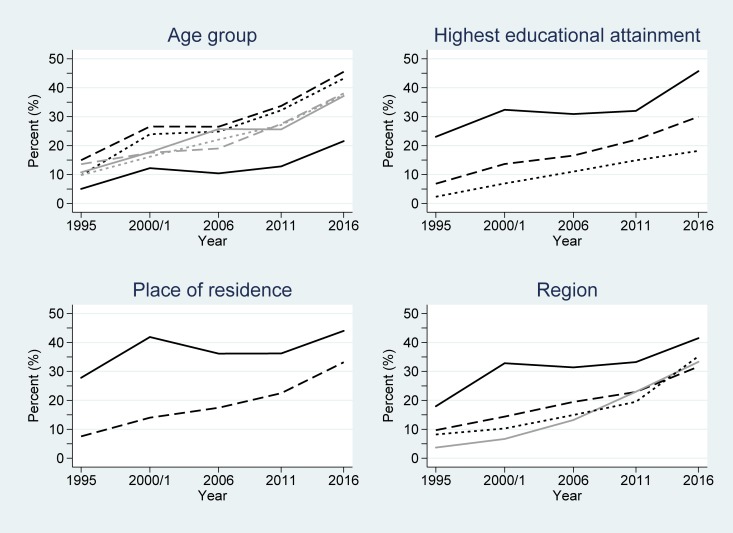
Results: Overall, 50,027 women and 14,092 men were included within the study. In 2016, 30.3% of women and 39.9% of men were using any contraceptive method, a significant non-linear increase from 13.4% of women and 20.3% of men in 1995. Furthermore, 27.3% of women and 35.9% of men were using modern contraceptive methods in 2016, an increase from 7.4% of women and 10.4% of men in 1995. All considered demographic variables were significantly associated with contraceptive use for both women and men (all P<0.001); and for women, all variables differentially changed over time (all P<0.001).
Conclusion: This study showed a significant increase and dynamism across key demographic variables in contraceptive uptake by both women and men. Sustained family planning programs and interventions have successfully resulted in behaviour change across the Ugandan population. However, continued efforts are needed to further reduce Uganda's relatively high fertility and associated maternal mortality rates.
Conflict of interest statement
The authors have declared that no competing interests exist.
Figures
References
-
- World Health Organization. Family planning/contraception Geneva: WHO; 2018. [Available from: https://www.who.int/en/news-room/fact-sheets/detail/family-planning-cont...].
-
- Guttmacher Institute. Adding it up: investing in contraception and maternal and newborn health, 2017 New York: Guttmacher Institute; 2017. [Available from: https://www.guttmacher.org/fact-sheet/adding-it-up-contraception-mnh-2017].
-
- Population Reference Bureau. The faces of unmet need for family planning Washington: PRB; 2012 [Available from: https://www.prb.org/faces-unmet-need-familyplanning/].
-
- Uganda Bureau of Statistics and ICF. Uganda Demographic and Health Survey 2016 Kampala, Uganda, and Rockville, Maryland, USA: UBOS and ICF; 2018.
-
- The World Bank. Maternal mortality ratio (modeled estimate, per 100,000 live births): Uganda. Geneva: WHO, UNICEF, UNFPA, World Bank Group, and the United Nations Population Division; 2015. [Available from: https://data.worldbank.org/indicator/SH.STA.MMRT?locations=UG].
Publication types
MeSH terms
LinkOut - more resources
Full Text Sources
