. 2019 Jul 17;11(7):651.
doi: 10.3390/v11070651.

Effects of Moloney Leukemia Virus 10 Protein on Hepatitis B Virus Infection and Viral Replication

Affiliations

Effects of Moloney Leukemia Virus 10 Protein on Hepatitis B Virus Infection and Viral Replication

Maritza N Puray-Chavez et al. Viruses. .

Abstract

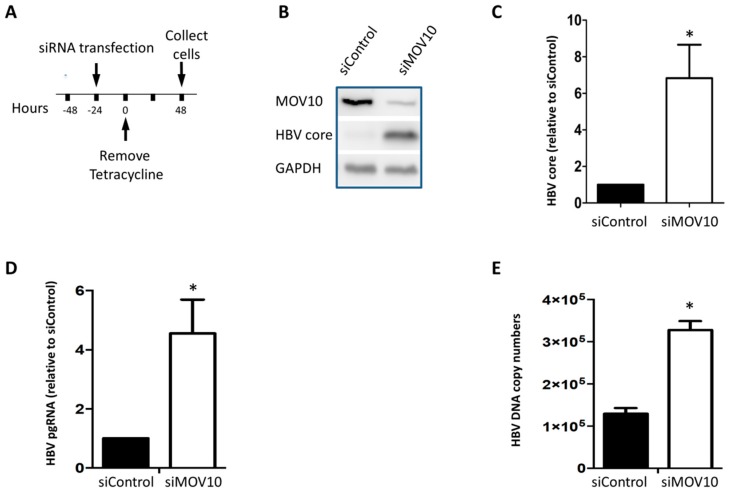
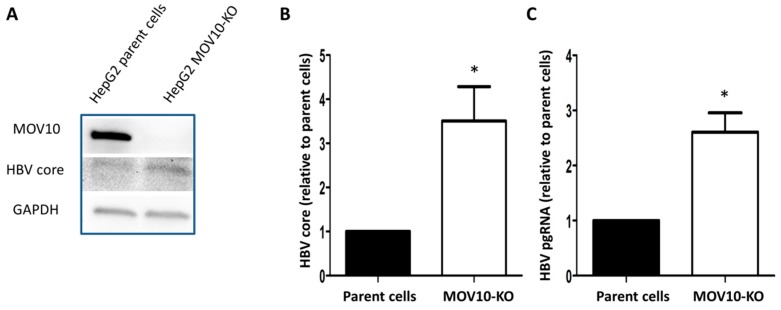
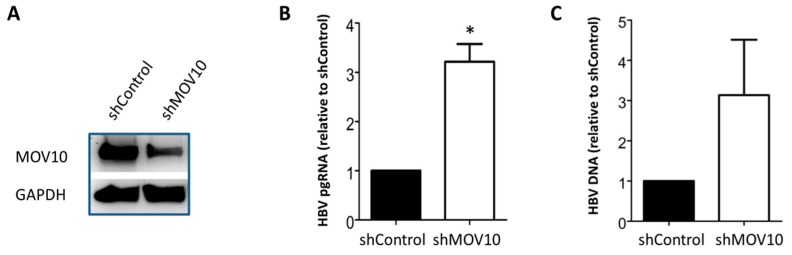
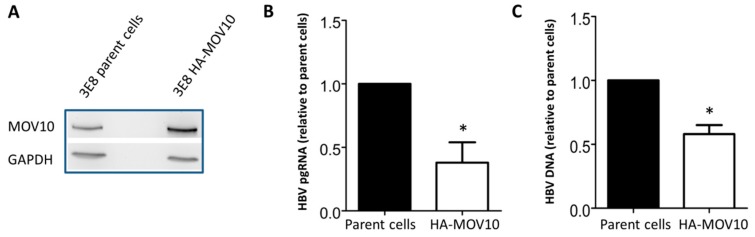
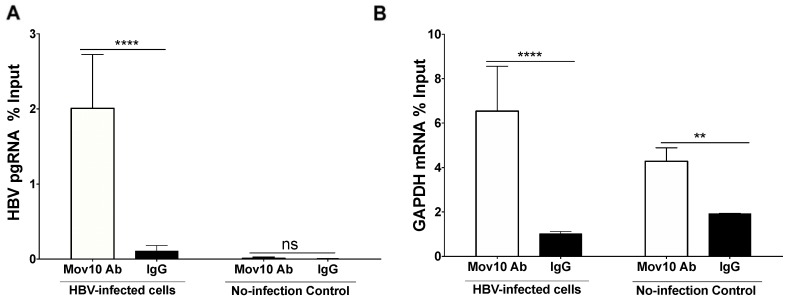
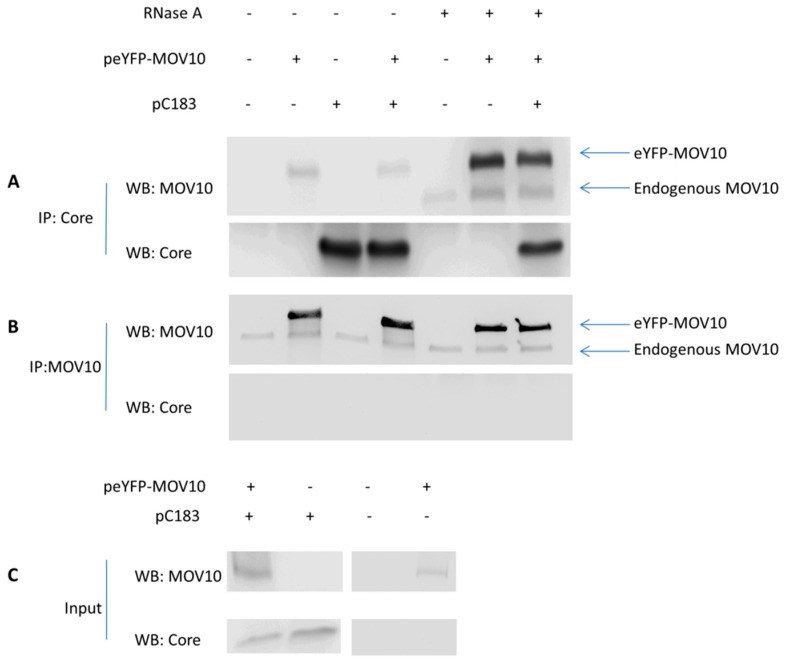
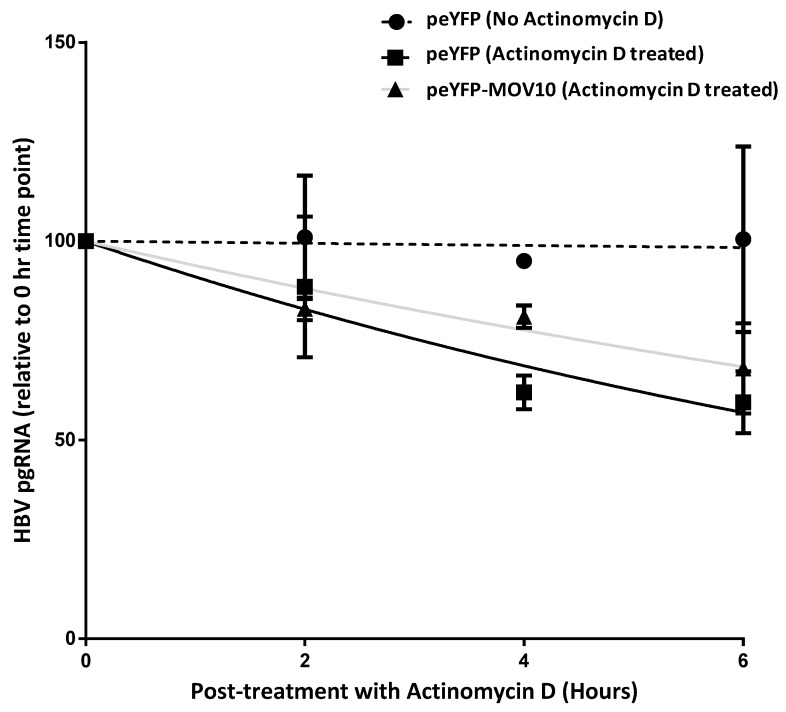
Moloney leukemia virus 10 (MOV10) is an RNA helicase that has been shown to affect the replication of several viruses. The effect of MOV10 on Hepatitis B virus (HBV) infection is not known and its role on the replication of this virus is poorly understood. We investigated the effect of MOV10 down-regulation and MOV10 over-expression on HBV in a variety of cell lines, as well as in an infection system using a replication competent virus. We report that MOV10 down-regulation, using siRNA, shRNA, and CRISPR/Cas9 gene editing technology, resulted in increased levels of HBV DNA, HBV pre-genomic RNA, and HBV core protein. In contrast, MOV10 over-expression reduced HBV DNA, HBV pre-genomic RNA, and HBV core protein. These effects were consistent in all tested cell lines, providing strong evidence for the involvement of MOV10 in the HBV life cycle. We demonstrated that MOV10 does not interact with HBV-core. However, MOV10 binds HBV pgRNA and this interaction does not affect HBV pgRNA decay rate. We conclude that the restriction of HBV by MOV10 is mediated through effects at the level of viral RNA.

Keywords: gene expression; hepatitis B virus; host factors; moloney leukemia virus 10.


Conflict of interest statement

The authors declare no conflict of interest.

Figures

Figure 1
Figure 1
Down-regulation of MOV10 (Moloney Leukemia Virus 10) enhances Hepatitis B virus (HBV) gene expression in HepAD38 cells. (A) Time course of the experiment. HepAD38 cells were transfected with 50 nM siMOV10 or siControl 24 h before tetracycline (tet) removal. Cells were collected two days after tet removal. (B) Western blot showing HBV core and MOV10 expression in siRNA treated cells. Glyceraldehyde 3-phosphate dehydrogenase (GAPDH) was used as a loading control. (C) Quantification of HBV core expression determined by western blotting. (D) Intracellular HBV pgRNA level determined by RT-qPCR. Data were normalized to GAPDH mRNA expression. (E) Intracellular HBV DNA level determined by qPCR. Data represent mean ± standard deviation from two independent experiments. * p-value < 0.05, two-tailed unpaired t-test.
Figure 2
Figure 2
Down-regulation of MOV10 enhances HBV gene expression in HepG2 cells. (A) Time course of the experiment. HepG2cells were transfected with 20 nM siMOV10 or siControl 24 h before transfection with pHBV plasmid. Cells were collected two days after HBV plasmid transfection. (B) Western blot showing HBV core and MOV10 expression in siRNA treated cells. GAPDH was used as a loading control. (C) Quantification of HBV core expression determined by western blotting. (D) Intracellular HBV pgRNA level determined by RT-qPCR. Data were normalized to GAPDH mRNA expression. (E) Intracellular HBV DNA level determined by qPCR. Data represent mean ± standard deviation from two independent experiments. * p-value < 0.05, two-tailed unpaired t-test.
Figure 3
Figure 3
HBV gene expression in HepG2 MOV10-KO cells. (A) Western blot showing HBV core and MOV10 in HepG2 MOV10-KO cells compared to HepG2 parent cells. GAPDH was used as a loading control. (B) Quantification of HBV core expression determined by western blotting. (C) Intracellular HBV pgRNA level determined by qPCR after cDNA synthesis. Data were normalized to RPL18A mRNA expression. Data represent mean ± standard deviation from two independent experiments. * p-value < 0.05, two-tailed unpaired t-test.
Figure 4
Figure 4
Down-regulation of MOV10 enhances HBV infection of HepG2-sodium taurocholate co-transporting polypeptide (NTCP) cells. HepG2-NTCP-C7 stable cell lines, shControl, and shMOV10, were infected with 250 HBV genome equivalents per cell. Five days later, cells were collected. (A) Western blotting showing MOV10 expression in shMOV10 stable cell line compared to shControl. GAPDH was used as a loading control. (B) Intracellular HBV pgRNA level determined by RT-qPCR. Data were normalized to GAPDH mRNA expression. (C) Intracellular HBV DNA level determined by qPCR. Data represent mean ± standard deviation from at least two independent experiments. * p-value < 0.05, two-tailed unpaired t-test.
Figure 5
Figure 5
MOV10 over-expression diminishes HBV infection of HepG2-NTCP cells. HepG2-NTCP-3E8 parent cells and HepG2-NTCP-3E8 HA-MOV10 cells were infected with 400 HBV genome equivalents per cell. Five days later, cells were collected. (A) Western blot showing MOV10 expression in 3E8 HA-MOV10 stable cell line compared to HepG2-NTCP-3E8 parent cells. GAPDH was used as a loading control (B) Intracellular HBV pgRNA level determined by RT-qPCR. Data were normalized to GAPDH mRNA. (C) Intracellular HBV DNA level determined by qPCR. Data represent mean ± standard deviation from two independent experiments. * p-value < 0.05.
Figure 6
Figure 6
HBV pre-genomic RNA co-immunoprecipitated with MOV10. (A) HepG2-NTCP clone 7 cells were infected with HBV and harvested after five days. Immunoprecipitation was performed with an antibody against human MOV10 in the HBV-infected cells and in the non-infected control cells. SYBR Green-based RT-qPCR was done using primers against HBV pre-genomic RNA. (B) Human GAPDH mRNA co-immunoprecipitated with MOV10. SYBR Green-based RT-qPCR was done using primers against human GAPDH mRNA. (n = two independent experiments, ** p = 0.0015, **** p < 0.0001, two-way ANOVA Sidak’s multiple comparisons test).
Figure 7
Figure 7
No specific interaction between MOV10 and HBV core protein. 293T cells were transfected with pC183 and peYFP-MOV10, pC183 and peYFP-empty, peYFP-MOV10 and peYFP-empty, or peYFP-empty only. Where indicated, lysates were pre-treated with RNase A prior to immunoprecipitation with the indicated antibodies. Immunoprecipitates were analyzed by western blotting using the indicated antibodies. (A) Proteins in lysates were immunoprecipitated with the anti-HBV core antibody. Immunoprecipitates were analyzed by western blotting using the anti-MOV10 and anti-HBV core antibodies. (B) Proteins in lysates were immunoprecipitated with the anti-MOV10 antibody. Immunoprecipitates were analyzed by western blotting using anti-MOV10 and anti-HBV core antibodies. (C) Western blotting showing detectable levels of MOV10 and HBV core proteins in tested lysates.
Figure 8
Figure 8
MOV10 over-expression does not induce the degradation of HBV pgRNA. 293T cells were transfected with HBV core-deficient plasmid (Cp-deficient pHBV) and peYFP-MOV10 or peYFP-empty (eYFP) plasmids. After 48 h, the cells were treated with 5 µg/mL Actinomycin D. The cells were harvested at 0, 2, 4, 6 h after Actinomycin D treatment. Total RNA was extracted and HBV pgRNA levels were determined relative to the 0 h time point. RPL18A mRNA was used as a normalization control. Single phase decay curves are shown. The dotted line represents cells transfected with Cp-deficient pHBV and peYFP in the absence of Actinomycin D. The solid black line represents cells transfected with Cp-deficient pHBV and peYFP in the presence of Actinomycin D. The grey line represents cells transfected with Cp-deficient pHBV and peYFP-MOV10 in the presence of Actinomycin D. Data represent mean ± standard deviation from two independent experiments.

References

    1. Beck J., Nassal M. Hepatitis B virus replication. World J. Gastroenterol. 2007;13:48–64. doi: 10.3748/wjg.v13.i1.48. - DOI - PMC - PubMed
    1. Seeger C., Mason W.S. Hepatitis B virus biology. Microbiol. Mol. Biol. Rev. 2000;64:51–68. doi: 10.1128/MMBR.64.1.51-68.2000. - DOI - PMC - PubMed
    1. Jones S.A., Hu J. Hepatitis B virus reverse transcriptase: Diverse functions as classical and emerging targets for antiviral intervention. Emerg. Microbes Infect. 2013;2:e56. doi: 10.1038/emi.2013.56. - DOI - PMC - PubMed
    1. Michailidis E., Kirby K.A., Hachiya A., Yoo W., Hong S.P., Kim S.O., Folk W.R., Sarafianos S.G. Antiviral therapies: Focus on hepatitis B reverse transcriptase. Int. J. Biochem. Cell Biol. 2012;44:1060–1071. doi: 10.1016/j.biocel.2012.04.006. - DOI - PMC - PubMed
    1. Tang C.M., Yau T.O., Yu J. Management of chronic hepatitis B infection: Current treatment guidelines, challenges, and new developments. World J. Gastroenterol. 2014;20:6262–6278. doi: 10.3748/wjg.v20.i20.6262. - DOI - PMC - PubMed

Publication types