

Ethnic inequalities and trends in stunting prevalence among Guatemalan children: an analysis using national health surveys 1995-2014
- PMID: 31319862
- PMCID: PMC6639956
- DOI: 10.1186/s12939-019-1016-0
Ethnic inequalities and trends in stunting prevalence among Guatemalan children: an analysis using national health surveys 1995-2014
Abstract
Background: Guatemala has the highest prevalence of stunting among under-five children in Latin America. We aimed to compare indigenous and non-indigenous under-five child populations in relation to stunting, as well as to explore the intersectionality of ethnicity by wealth and by place of residence. We also studied how the ethnic inequalities changed over time, using five ENSMI surveys from 1995 to 2014.
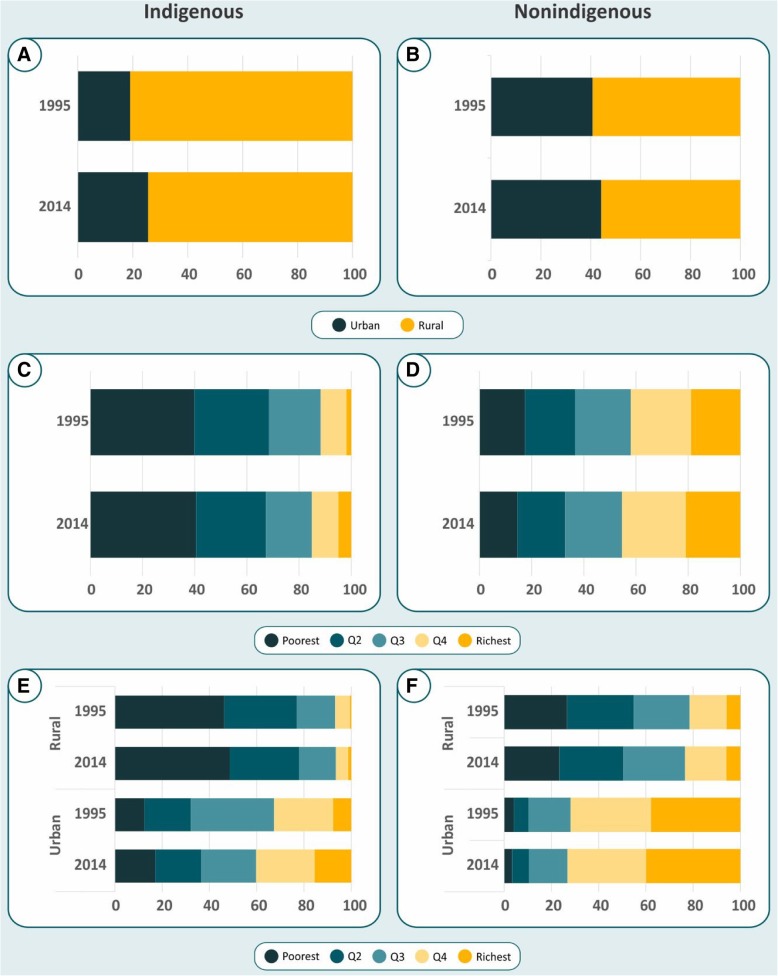
Methods: Five national health surveys carried out between 1995 and 2014 were analysed. World Health Organization (WHO) 2006 growth standards were used to calculate stunting prevalence. Self-reported ethnicity was classified as indigenous or nonindigenous. Wealth was measured through an asset-based index, and households were classified into quintiles (for analyses of the whole populations) or tertiles (for analyses of intersectionality with ethnicity). Area of residence was recorded as urban or rural, according to country definition.
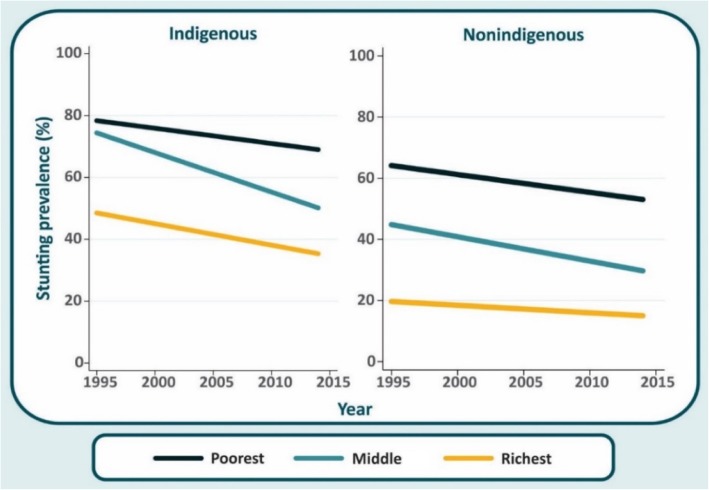
Results: Overall stunting prevalence declined by 9.8 percentage points (95% CI -16.4 to - 3.3) from 1995 to 2014. The slope index for absolute inequalities in stunting - which corresponds to the difference in prevalence between the wealthiest and poorest households - ranged from - 52.9 to - 60.4 percentage points, with no significant change over time. Children in rural areas were consistently more stunted than those in urban areas, but rural indigenous children were significantly worse than any other group. Indigenous children in the poorest tertile of family wealth consistently presented the highest stunting prevalence, compared to all other groups. Time trends in stunting were assessed through the average annual absolute change (AAAC). The fastest decline was observed among indigenous children from the middle wealth tertile (AAAC = - 1.21 percentage points per year (pp/y); 95% CI - 1.45 to - 0.96) followed by nonindigenous children also from the middle tertile (AAAC = - 0.80 pp./y; 95% CI - 0.99 to - 0.60). Stunting prevalence in the two poorest tertiles of indigenous children in 2015 was similar to what nonindigenous children presented in 1995, 20 years earlier. In the wealthiest tertile, indigenous children were far worse off than nonindigenous children 20 years earlier.
Conclusions: In terms of stunting prevalence, poor and rural indigenous children are twenty years behind nonindigenous children with similar characteristics.
Keywords: Ethnic groups; Guatemala; Health equity; Health status disparities; Stunting.
Conflict of interest statement
The authors declare that they have no compating interests.
Figures
References
-
- World Health Organization . Nutrition Landscape Information System (NLIS). Country profile indicators: interpretation guide. Geneva: WHO; 2010.
Publication types
MeSH terms
Grants and funding
LinkOut - more resources
Full Text Sources
Medical
Miscellaneous
