. 2019 Sep 29;54(3):1900154.
doi: 10.1183/13993003.00154-2019. Print 2019 Sep.

IL-1 receptor blockade skews inflammation towards Th2 in a mouse model of systemic sclerosis

Affiliations

IL-1 receptor blockade skews inflammation towards Th2 in a mouse model of systemic sclerosis

Anna Birnhuber et al. Eur Respir J. .

Abstract

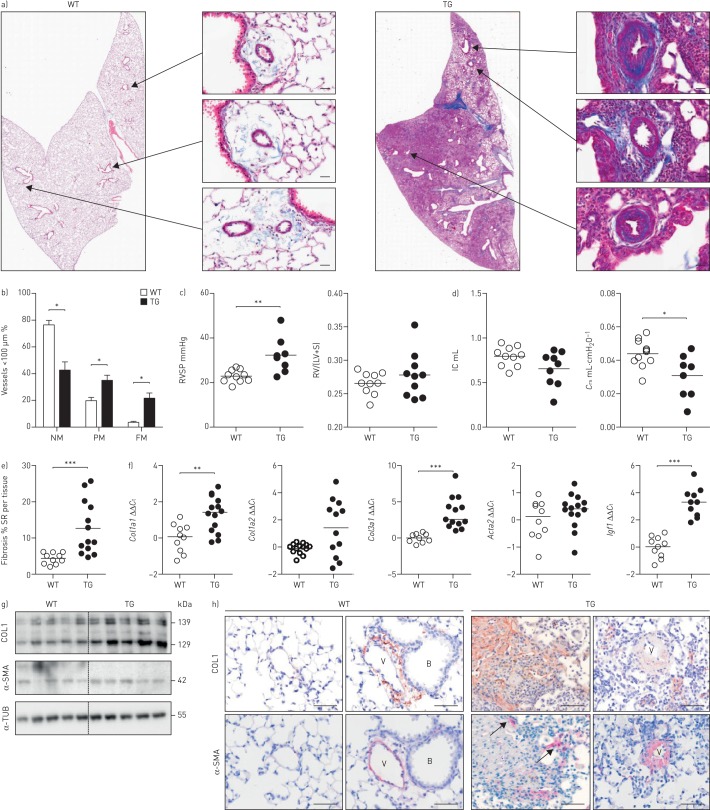
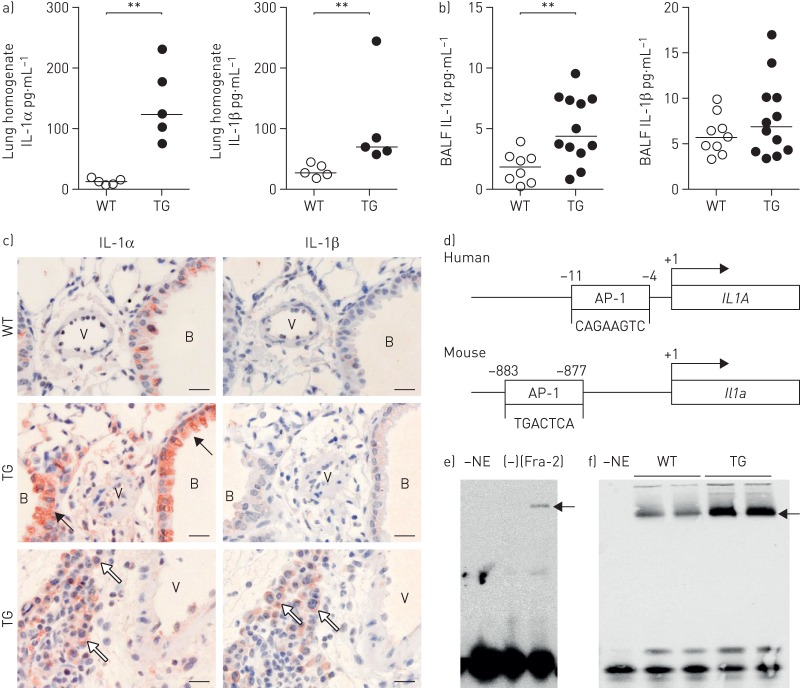
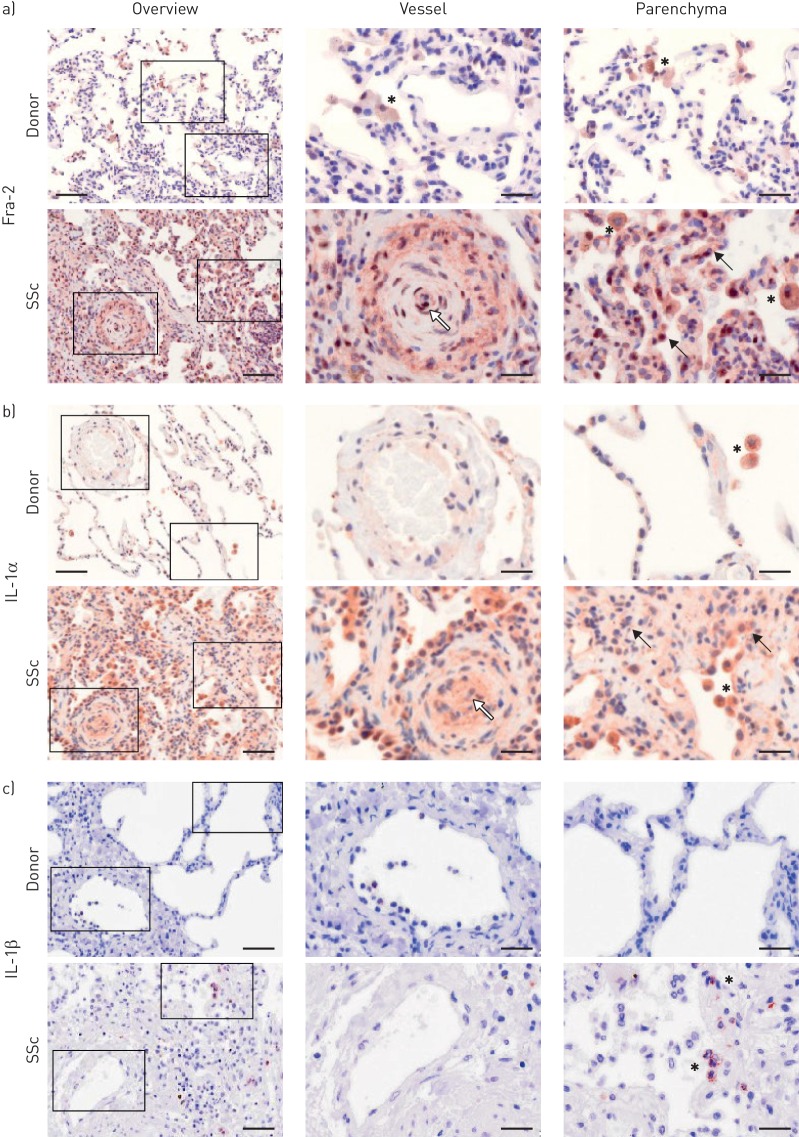
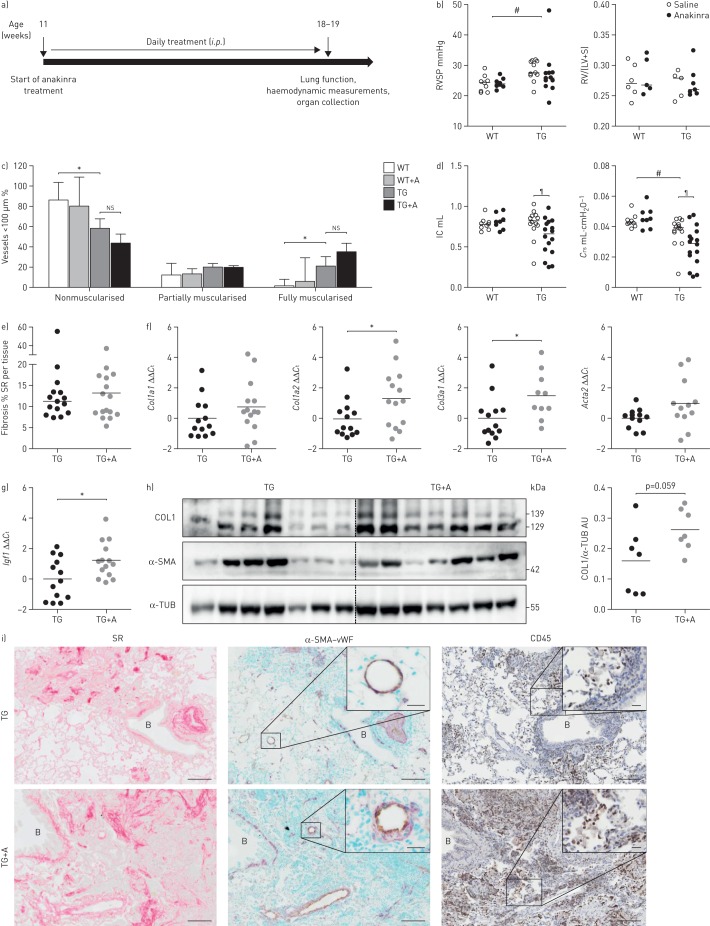
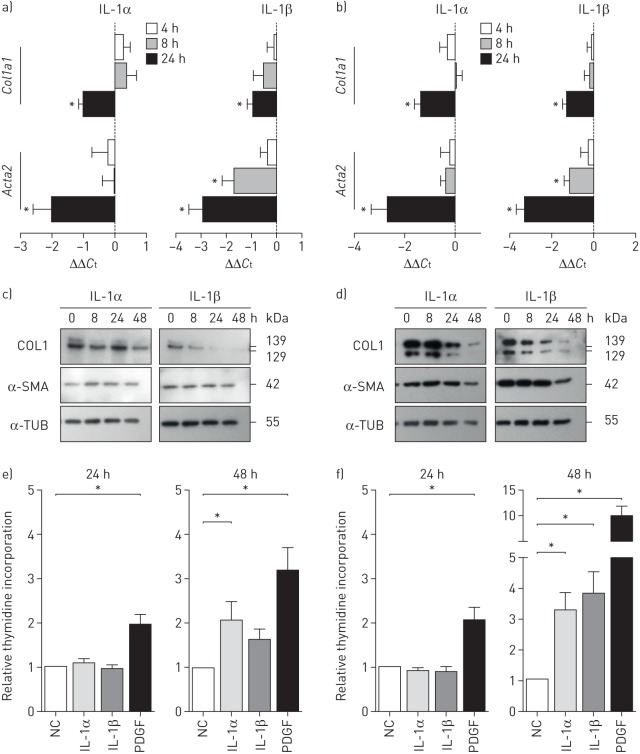
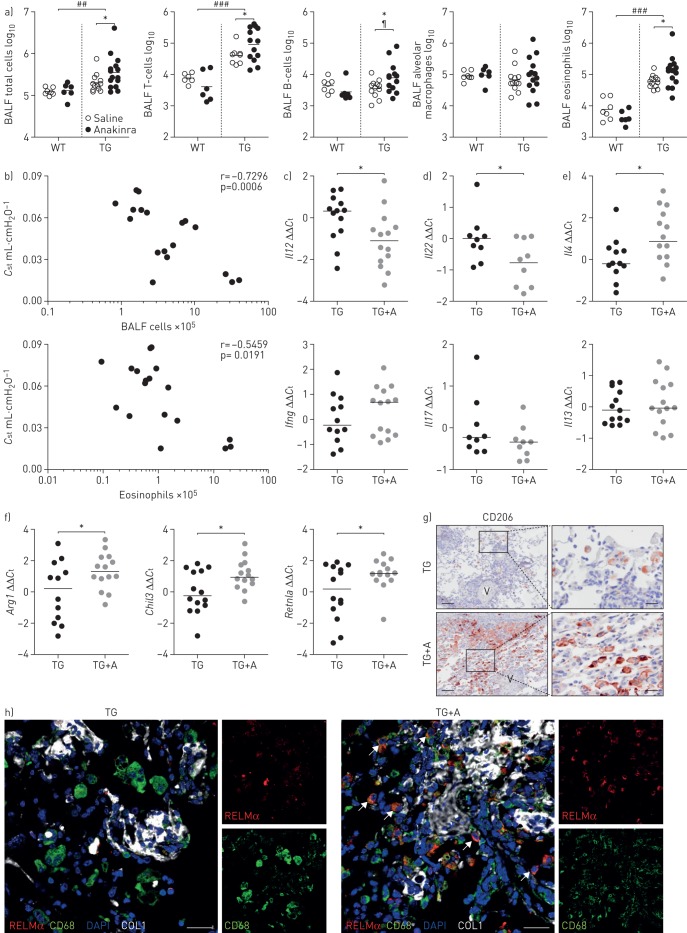
The interleukin (IL)-1 family of cytokines is strongly associated with systemic sclerosis (SSc) and pulmonary involvement, but the molecular mechanisms are poorly understood. The aim of this study was to assess the role of IL-1α and IL-1β in pulmonary vascular and interstitial remodelling in a mouse model of SSc.IL-1α and IL-1β were localised in lungs of SSc patients and in the fos-related antigen-2 (Fra-2) transgenic (TG) mouse model of SSc. Lung function, haemodynamic parameters and pulmonary inflammation were measured in Fra-2 TG mice with or without 8 weeks of treatment with the IL-1 receptor antagonist anakinra (25 mg·kg-1·day-1). Direct effects of IL-1 on pulmonary arterial smooth muscle cells (PASMCs) and parenchymal fibroblasts were investigated in vitroFra-2 TG mice exhibited increased collagen deposition in the lung, restrictive lung function and enhanced muscularisation of the vasculature with concomitant pulmonary hypertension reminiscent of the changes in SSc patients. Immunoreactivity of IL-1α and IL-1β was increased in Fra-2 TG mice and in patients with SSc. IL-1 stimulation reduced collagen expression in PASMCs and parenchymal fibroblasts via distinct signalling pathways. Blocking IL-1 signalling in Fra-2 TG worsened pulmonary fibrosis and restriction, enhanced T-helper cell type 2 (Th2) inflammation, and increased the number of pro-fibrotic, alternatively activated macrophages.Our data suggest that blocking IL-1 signalling as currently investigated in several clinical studies might aggravate pulmonary fibrosis in specific patient subsets due to Th2 skewing of immune responses and formation of alternatively activated pro-fibrogenic macrophages.


Conflict of interest statement

Conflict of interest: A. Birnhuber reports grants from Jubilee Foundation of the Austrian National Bank, during the conduct of the study. Conflict of interest: S. Crnkovic has nothing to disclose. Conflict of interest: V. Biasin has nothing to disclose. Conflict of interest: L.M. Marsh has nothing to disclose. Conflict of interest: B. Odler has nothing to disclose. Conflict of interest: A. Sahu-Osen has nothing to disclose. Conflict of interest: E. Stacher-Priehse has nothing to disclose. Conflict of interest: L. Brcic reports grants and personal fees from AstraZeneca, personal fees from Roche Austria, nonfinancial support from MSD Austria and Pfizer Austria, outside the submitted work. Conflict of interest: F. Schneider has nothing to disclose. Conflict of interest: N. Cikes has nothing to disclose. Conflict of interest: B. Ghanim has nothing to disclose. Conflict of interest: W. Klepetko has nothing to disclose. Conflict of interest: W. Graninger has nothing to disclose. Conflict of interest: Y. Allanore has nothing to disclose. Conflict of interest: R. Eferl has nothing to disclose. Conflict of interest: A. Olschewski has nothing to disclose. Conflict of interest: H. Olschewski reports personal fees and nonfinancial support from Bayer, MSD, Pfizer and Novartis, grants, personal fees and nonfinancial support from Actelion, grants from Inventiva, personal fees from Bellerophon, outside the submitted work; and is a part-time employee of the Ludwig Boltzmann Institute for Lung Vascular Research, Graz, Austria. Conflict of interest: G. Kwapiszewska reports grants from Jubilee Foundation of the Austrian National Bank (grant 16187), Austrian Science Fund (FWF) (P27848-B28), and Austrian Agency for International Cooperation in Education and Research (WTZ HR14/2012), during the conduct of the study.

Figures

FIGURE 1
FIGURE 1
fos-related antigen-2 (Fra-2)-overexpressing (transgenic (TG)) mice develop vascular remodelling and parenchymal fibrosis. WT: wild-type; RVSP: right ventricular systolic pressure; RV: right ventricle; LV: left ventricle; S: septum; IC: inspiratory capacity; Crs: compliance of the respiratory system; SR: Sirius red; Ct: cycle threshold; COL1: collagen 1; α-SMA: α-smooth muscle actin; α-TUB: α-tubulin. a) Representative images of whole lung slides stained with Masson's trichrome and magnifications of remodelled vessels in 20-week-old WT and Fra-2 TG mice. Scale bar: 20 µm. Collagen is stained in blue. b) Percentage of nonmuscularised (NM), partially muscularised (PM) and fully muscularised (FM) vessels <100 µm in diameter. n=10; mean±sd. c) RVSP as determined by right heart catheterisation and the Fulton index (RV/(LV+S)) in WT and Fra-2 TG mice. d) Lung function measurements (IC and Crs) of WT and Fra-2 TG mice. e) Morphometric quantification of collagen on Sirius red-stained WT and Fra-2 TG lung slides. f) Quantitative real-time PCR analysis of Col1a1, Col1a2, Col3a1, Acta2 and Igf1 expression in WT and Fra-2 TG mice. ΔCt values were normalised to the mean of the WT group (ΔΔCt). B2m2-microglobulin) and Hmbs (hydroxymethylbilane synthase) were used as reference genes. g) Western blot analysis of COL1 and α-SMA levels in WT and Fra-2 TG mice lung homogenates. α-TUB served as a loading control. h) Immunohistochemical staining of COL1 (brown) and α-SMA (red/pink). B: bronchi; V: vessel. Scale bar: 50 µm. *: p<0.05; **: p<0.01; ***: p<0.001.
FIGURE 2
FIGURE 2
Increased interleukin (IL)-1α and IL-1β levels in the fos-related antigen-2 (Fra-2)-overexpressing (transgenic (TG)) mouse. BALF: bronchoalveolar lavage fluid; AP-1: activator protein-1. a, b) IL-1α and IL-1β protein levels in a) lung homogenate and b) BALF of 20-week-old WT and Fra-2 TG mice. c) Immunohistochemical staining of IL-1α and IL-1β on lung sections of Fra-2 TG and WT mice. B: bronchi, V: vessel; black arrows: bronchial epithelial cells; white arrows: structural and inflammatory cells. Scale bar: 20 µm. d) Schematic representation of the human IL1A and mouse Il1a promoter sequences including AP-1-binding sites. e, f) Electrophoretic mobility shift assay analysis performed on nuclear extracts of e) Fra-2-overexpressing primary human parenchymal fibroblasts or cells transfected with empty control plasmid (–) and f) lung homogenates from WT or Fra-2 TG mice. –NE: negative control of the binding reaction without nuclear extract. For loading and overexpression controls, see supplementary figure S1. **: p<0.01.
FIGURE 3
FIGURE 3
Localisation of fos-related antigen-2 (Fra-2), interleukin (IL)-1α and IL-1β in healthy donor and systemic sclerosis (SSc) lungs. Immunohistochemical staining (brown) of a) Fra-2, b) IL-1α and c) IL-1β. Left panels: overview; right panels: magnified insets. Asterisks: inflammatory cells/alveolar macrophages; black arrows: parenchymal cells; white arrows: endothelial cells. Scale bar: 100 µm (overview)/20 µm (insets). n=3–4; representative images are shown.
FIGURE 4
FIGURE 4
Blocking of interleukin (IL)-1 signalling worsens lung function and increases extracellular matrix production in fos-related antigen-2 (Fra-2)-overexpressing (transgenic (TG)) mice. RSVP: right ventricular systolic pressure; RV: right ventricle, LV: left ventricle; S: septum; ns: nonsignificant; IC: inspiratory capacity; Crs: compliance of the respiratory system; SR: Sirius red; Ct: cycle threshold; COL1: collagen 1; α-SMA: α-smooth muscle actin; α-TUB: α-tubulin; AU: arbitrary units; vWF: von Willebrand Factor. a) Overview of anakinra treatment: Fra-2 TG mice received 25 mg·kg−1 anakinra per day as intraperitoneal injections for 8 weeks and were sacrificed at the age of 18–19 weeks. b) RVSP as determined by right heart catheterisation and the Fulton index (RV/(LV+S)) of Fra-2 TG and WT mice with anakinra treatment or vehicle control (saline). #: p<0.05, significance of genotype effect determined by two-way ANOVA. c) Percentage of nonmuscularised, partially muscularised and fully muscularised vessels <100 µm in diameter. n=3 for WT and n=9 for TG; mean±sd. *: p<0.05, unpaired t-test. d) Lung function measurements (IC and Crs) of Fra-2 TG and WT mice with anakinra treatment or vehicle control (saline). #: p<0.05, significance of genotype effect determined by two-way ANOVA; : p<0.05, significance of the difference between Fra-2 TG with and without anakinra treatment determined by two-way ANOVA with Bonferroni's post-test. e) Morphometric quantification of collagen on SR-stained lung slides from Fra-2 TG and WT mice with (TG+A) and without (TG) anakinra treatment. f, g) Quantitative real-time PCR analysis of f) Col1a1, Cola1a2, Col3a1 and Acta2 and g) Igf1 expression in Fra-2 TG mice. ΔCt values were normalised to the mean of the untreated Fra-2 TG group (ΔΔCt). B2m2-microglobulin) and Hmbs (hydroxymethylbilane synthase) were used as reference genes. *: p<0.05, unpaired t-test. h) Western blot analysis and quantification of COL1 and α-SMA levels in Fra-2 TG and TG+A mice lung homogenates. α-TUB served as a loading control. i) Collagen staining with SR (collagen in red), immunohistochemical double staining of vessels against α-SMA (violet) and endothelium marker vWF (light brown), and immunohistochemical staining against inflammatory cell marker CD45. B: bronchi. Scale bar: 100 µm (main)/20 µm (insets).
FIGURE 5
FIGURE 5
Interleukin (IL)-1 downregulates collagen 1 (COL1) and α-smooth muscle actin (α-SMA) expression in pulmonary arterial smooth muscle cells (PASMCs) and parenchymal fibroblasts. IL: interleukin; Ct: cycle threshold; α-TUB: α-tubulin; PDGF: platelet-derived growth factor; NC: negative control. a, b) Relative expression levels of Col1a1 and Acta2 after 4, 8 and 24 h of IL-1α (1 ng·mL−1) and IL-1β (10 ng·mL−1) stimulation in a) PASMCs and b) parenchymal fibroblasts (extracellular matrix production). Data from six independent experiments with cells isolated from different donor lungs are depicted. B2m2-microglobulin) and Hmbs (hydroxymethylbilane synthase) were used as reference genes. c, d) Representative Western blots of COL1 and α-SMA in c) PASMCs and d) parenchymal fibroblasts treated with IL-1α and IL-1β for 4, 8 or 24 h. e, f) Proliferation of e) PASMCs and f) parenchymal fibroblasts assessed by 3H-thymidine incorporation over 24 h upon stimulation with IL-1α, IL-1β and PDGF-BB. Data from 10 independent experiments on cells from five different donors; mean±sd. *: p<0.05, Kruskal–Wallis test with Dunn's post-test for multiple comparisons.
FIGURE 6
FIGURE 6
Blocking of interleukin (IL)-1 signalling increases inflammation in fos-related antigen-2 (Fra-2)-overexpressing (transgenic (TG)) mice. BALF: bronchoalveolar lavage fluid; WT: wild-type; Cst: quasi-static lung compliance; Ct: cycle threshold; RELMα: resistin-like molecule-α; COL1: collagen 1; DAPI: 4′,6-diamidino-2-phenylindole; qRT: quantitative real-time. a) Flow cytometric analysis of inflammatory cell populations in the BALF of Fra-2 TG and WT mice with anakinra or vehicle control (saline) treatment. ##: p<0.01; ###: p<0.001, significance of genotype effect determined by two-way ANOVA; : p<0.05, significance of difference between Fra-2 TG with and without anakinra treatment determined by two-way ANOVA with Bonferroni's post-test; *: p<0.05, unpaired t-test. b) Correlation plots of Cst with BALF total cell count or BALF eosinophils. c–e) Relative expression levels determined by qRT-PCR of key inflammatory mediators in lung homogenates of Fra-2 TG mice upon anakinra treatment. ΔCt values were normalised to the mean of the untreated Fra-2 TG group (ΔΔCt). B2m2-microglobulin) and Hmbs (hydroxymethylbilane synthase) were used as reference genes. *: p<0.05, unpaired t-test. f) qRT-PCR analysis of markers of alternative macrophage polarisation. ΔCt values were normalised to the mean of the untreated control group (ΔΔCt). *: p<0.05, unpaired t-test. g) Immunohistochemical staining of CD206 (brown) on lung sections from Fra-2 TG mice with (TG+A) and without (TG) anakinra treatment. V: vessel. Scale bar: 100 µm (main)/20 µm (insets). f) Immunofluorescence staining of RELMα (red), CD68 (green), COL1 (white) and DAPI (nuclei; blue). Arrows: CD68+/RELMα+ double-positive cells. Scale bar: 25 µm.

References

    1. Fan MH, Feghali-Bostwick CA, Silver RM. Update on scleroderma-associated interstitial lung disease. Curr Opin Rheumatol 2014; 26: 630–636. - PMC - PubMed
    1. Elhai M, Meune C, Boubaya M, et al. . Mapping and predicting mortality from systemic sclerosis. Ann Rheum Dis 2017; 76: 1897–1905. - PubMed
    1. Giacomelli R, Liakouli V, Berardicurti O, et al. . Interstitial lung disease in systemic sclerosis: current and future treatment. Rheumatol Int 2017; 37: 853–863. - PubMed
    1. Adler S, Huscher D, Siegert E, et al. . Systemic sclerosis associated interstitial lung disease – individualized immunosuppressive therapy and course of lung function: results of the EUSTAR group. Arthritis Res Ther 2018; 20: 17. - PMC - PubMed
    1. Gu YS, Kong J, Cheema GS, et al. . The immunobiology of systemic sclerosis. Semin Arthritis Rheum 2008; 38: 132–160. - PubMed

Publication types

MeSH terms