

Cognitive heterogeneity in probable Alzheimer disease: Clinical and neuropathologic features
- PMID: 31320469
- PMCID: PMC6711663
- DOI: 10.1212/WNL.0000000000007967
Cognitive heterogeneity in probable Alzheimer disease: Clinical and neuropathologic features
Abstract
Objective: To identify heterogeneity in cognitive profiles of patients with probable Alzheimer disease (AD) who have mild to moderate dementia and satisfy inclusion and exclusion criteria for a typical AD clinical trial, and to determine whether cognitive profiles are systematically related to the clinical course and neuropathologic features of the disease.
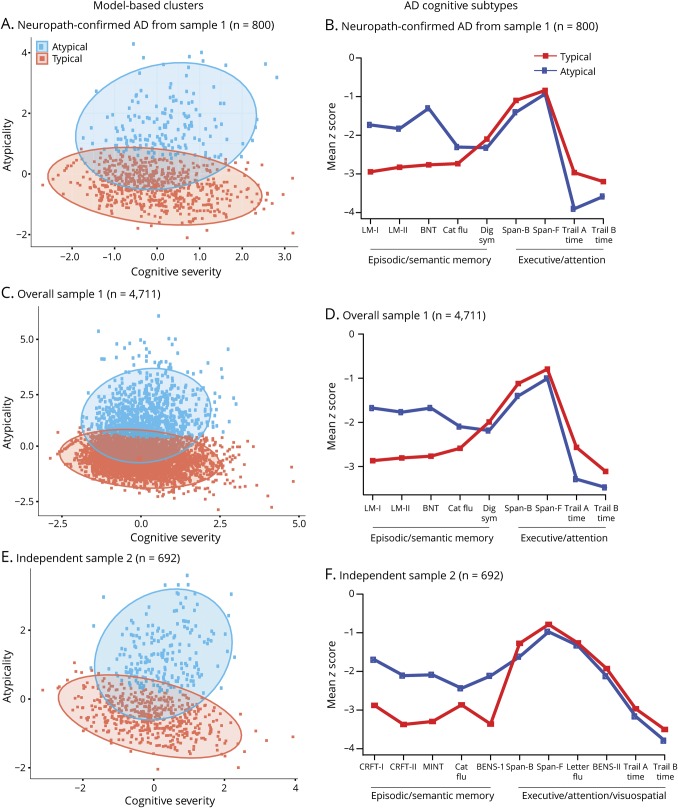
Methods: Neuropsychological test data from patients with mild to moderate probable AD (n = 4,711) were obtained from the National Alzheimer's Coordinating Center. Inclusion and exclusion criteria usually used in AD clinical trials were applied. Principal component analysis and model-based clustering were used to identify cognitive profiles in a subset of patients with autopsy-verified AD (n = 800) and validated in the overall (nonautopsy) sample and an independent cohort with similar test data. Relationships between cognitive profile, clinical characteristics, and rate of decline were examined with mixed-effects models.
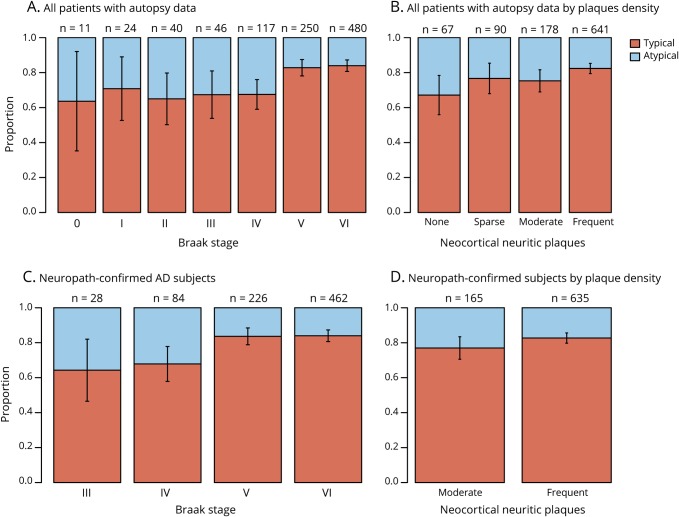
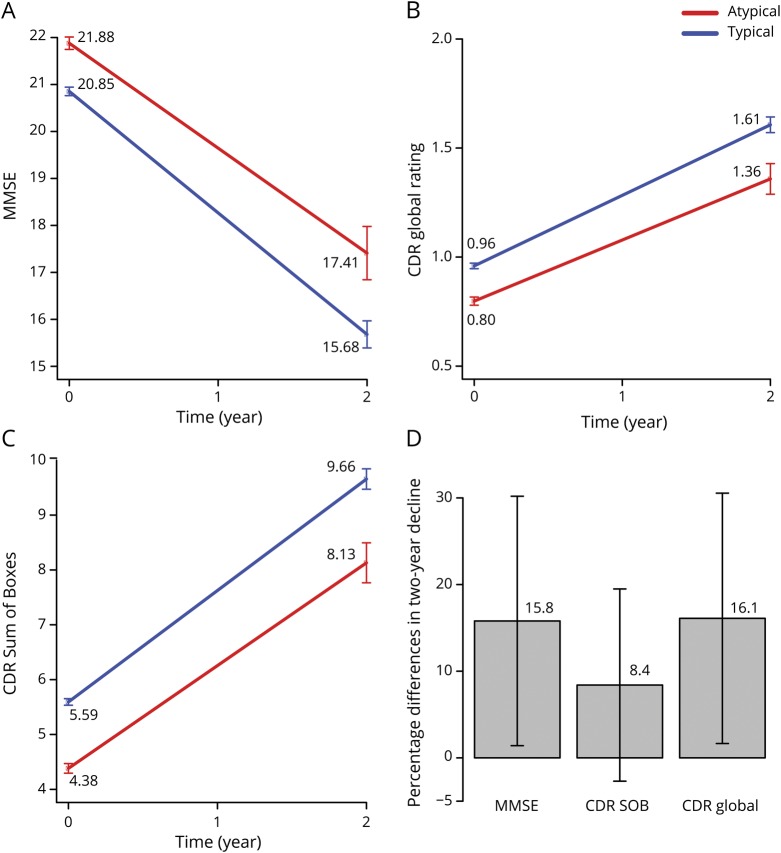
Results: In the autopsy-confirmed sample, 79.6% of patients had a typical AD cognitive profile (greater impairment of episodic memory than other cognitive functions), and 20.4% had an atypical profile (comparable impairment across cognitive domains). Similar results were obtained in the overall (typical 79.8%, atypical 20.2%) and validation (typical 71.8%, atypical 28.2%) samples. Atypicality was associated with younger age, male sex, lower probability of APOE ε4, less severe global dementia, higher depression scores, lower Braak stage at autopsy, and slower cognitive decline.
Conclusion: We can reliably identify distinct cognitive profiles among patients with clinically diagnosed probable AD that are associated with tangle pathology and with different rates of decline. This may have implications for clinical trials in AD, especially therapies targeting tau.
© 2019 American Academy of Neurology.
Figures
References
-
- Peter J, Abdulkadir A, Kaller C, et al. Subgroups of Alzheimer's disease: stability of empirical clusters over time. J Alzheimers Dis 2014;42:651–661. - PubMed
-
- Scheltens NM, Galindo-Garre F, Pijnenburg YA, et al. The identification of cognitive subtypes in Alzheimer's disease dementia using latent class analysis. J Neurol Neurosurg Psychiatry 2016;87:235–243. - PubMed
Publication types
MeSH terms
Grants and funding
- P50 AG005142/AG/NIA NIH HHS/United States
- R01 AG049810/AG/NIA NIH HHS/United States
- P50 AG016573/AG/NIA NIH HHS/United States
- P50 AG047266/AG/NIA NIH HHS/United States
- P30 AG010161/AG/NIA NIH HHS/United States
- P50 AG025688/AG/NIA NIH HHS/United States
- P50 AG005133/AG/NIA NIH HHS/United States
- P50 AG005138/AG/NIA NIH HHS/United States
- P50 AG047366/AG/NIA NIH HHS/United States
- P30 AG010129/AG/NIA NIH HHS/United States
- P30 AG019610/AG/NIA NIH HHS/United States
- P30 AG028383/AG/NIA NIH HHS/United States
- P50 AG033514/AG/NIA NIH HHS/United States
- P30 AG013854/AG/NIA NIH HHS/United States
- P30 AG053760/AG/NIA NIH HHS/United States
- P30 AG010124/AG/NIA NIH HHS/United States
- P50 AG023501/AG/NIA NIH HHS/United States
- P50 AG005131/AG/NIA NIH HHS/United States
- P30 AG010133/AG/NIA NIH HHS/United States
- P50 AG016574/AG/NIA NIH HHS/United States
- P50 AG005146/AG/NIA NIH HHS/United States
- U24 AG072122/AG/NIA NIH HHS/United States
- U19 AG010483/AG/NIA NIH HHS/United States
- P30 AG035982/AG/NIA NIH HHS/United States
- P50 AG008702/AG/NIA NIH HHS/United States
- U01 AG016976/AG/NIA NIH HHS/United States
- P30 AG008051/AG/NIA NIH HHS/United States
- P50 AG005681/AG/NIA NIH HHS/United States
- P30 AG013846/AG/NIA NIH HHS/United States
- P50 AG047270/AG/NIA NIH HHS/United States
- P30 AG062429/AG/NIA NIH HHS/United States
- P50 AG005136/AG/NIA NIH HHS/United States
- P30 AG049638/AG/NIA NIH HHS/United States
- P30 AG012300/AG/NIA NIH HHS/United States
- P50 AG005134/AG/NIA NIH HHS/United States
- P30 AG008017/AG/NIA NIH HHS/United States
LinkOut - more resources
Full Text Sources
Medical
Miscellaneous