Comparative Study
. 2019 Jul 19;365(6450):eaaw7317.
doi: 10.1126/science.aaw7317.

Conservation, acquisition, and functional impact of sex-biased gene expression in mammals

Affiliations
Comparative Study

Conservation, acquisition, and functional impact of sex-biased gene expression in mammals

Sahin Naqvi et al. Science. .

Abstract

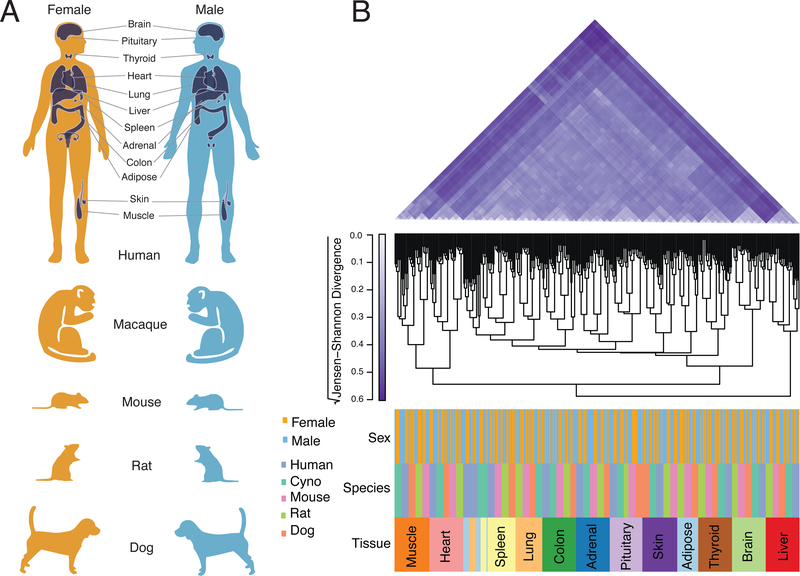
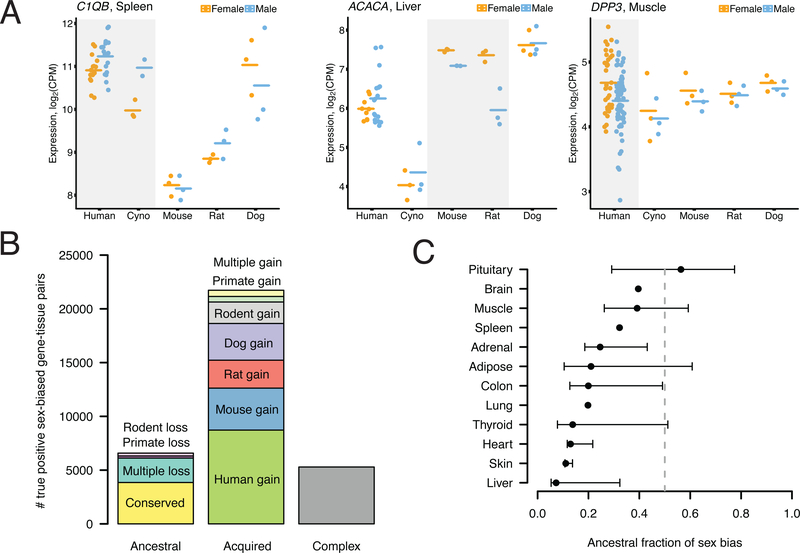
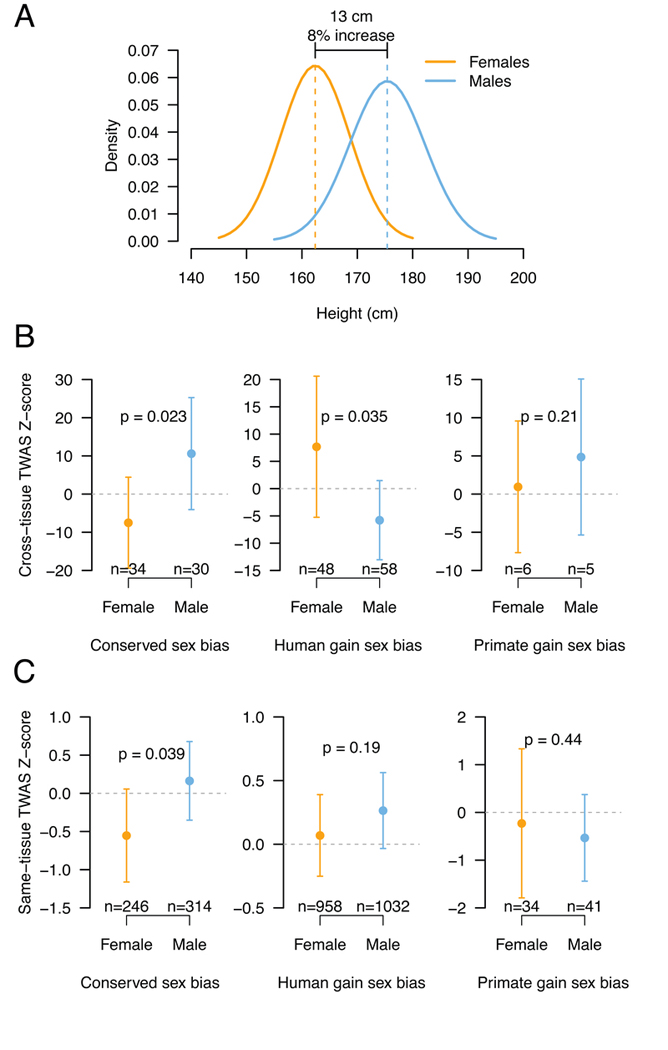
Sex differences abound in human health and disease, as they do in other mammals used as models. The extent to which sex differences are conserved at the molecular level across species and tissues is unknown. We surveyed sex differences in gene expression in human, macaque, mouse, rat, and dog, across 12 tissues. In each tissue, we identified hundreds of genes with conserved sex-biased expression-findings that, combined with genomic analyses of human height, explain ~12% of the difference in height between females and males. We surmise that conserved sex biases in expression of genes otherwise operating equivalently in females and males contribute to sex differences in traits. However, most sex-biased expression arose during the mammalian radiation, which suggests that careful attention to interspecies divergence is needed when modeling human sex differences.


Figures

Fig. 1:
Fig. 1:. Five-species, twelve-tissue survey of sex differences in gene expression.
(A) Schematic of study design, with tissues chosen for analysis in all five species highlighted in humans. (B) Hierarchical clustering of 349 RNA-seq samples. Top, pairwise estimates of Jensen-Shannon divergence (JSD) between pairs of samples. Six random human samples per tissue, in addition to all non-human samples, were included for display purposes. Middle, tree dendrogram obtained by hierarchical clustering (average linkage) based on pairwise JSD values. Bottom, sample labels by tissue, species, sex.
Fig. 2:
Fig. 2:. Conserved sex bias in gene expression across the body.
(A) Example of gene with conserved female-biased expression. (B) Heatmap of conserved male (blue) and female (orange) sex bias across genes (rows) and tissues (columns). (C) Y-axis represents number of genes with conserved sex bias in one (left) or multiple (right) tissues. (D) Of genes with conserved sex bias in multiple tissues, the number concordant (same direction) or discordant (opposite direction) in multiple tissues is plotted. Significance as assessed by two-sided Fisher’s exact test comparing to equal proportions.
Fig. 3:
Fig. 3:. Most sex bias in gene expression has arisen since the last common ancestor of boroeutheria.
(A) Examples of genes with lineage-specific sex bias. (B) Number of true-positive sex-biased gene-tissue pairs (y-axis) in each evolutionary class was calculated as the difference between the total number discovered across all tissues using true or permuted sex labels. Evolutionary classes defined in main text are designated as ancestral, acquired, or complex relative to last common ancestor of boroeutheria (the five species considered here). (C) Comparisons of ancestral to acquired sex biases as in (B), but performed in each tissue separately. Upper and lower confidence intervals represent fraction of sex bias estimated to be ancestral when counting all complex events as ancestral or acquired, respectively.
Fig. 4:
Fig. 4:. Sex-biased gene expression is associated with reduced selective constraint.
Within each tissue, genes were binned as showing no sex bias, or sex bias of any evolutionary type. Human breadth (A) was calculated based on median expression values in the 12 selected GTEx tissues (34), expression constraint (B) represents the genome-wide percentile, and sequence conservation (C) is calculated as the mean coding phyloP score (34). In each heatmap, the group median of the indicated gene-level trait is plotted; asterisks indicate a Benjamini-Hochberg-adjusted p-value < 0.05 from a two-sided Wilcoxon rank-sum test, placed on the group (“No bias” or “Sex-biased”) with the lower value of the gene-level trait.
Fig. 5:
Fig. 5:. Conserved sex bias in autosomal gene expression contributes to sex differences in human height.
(A) Overlapping but shifted distributions of male and female heights. Theoretical normal distributions using published means and standard deviations of male and female heights in individuals of European ancestry from the United Kingdom (53). (B) TWAS Z-scores for genome-wide significant height genes with either female (orange) or male (blue) bias in one of 12 tissues, either (left) conserved across mammals, (middle) specific to humans, or (right) specific to primates. For each gene, TWAS Z-scores were meta-analyzed across 48 GTEx tissues. (C) TWAS Z-scores for gene-tissue pairs with either female (orange) or male (blue) bias, either (left) conserved across mammals, (middle) specific to humans, or (right) specific to primates, in all cases in same tissue as computed TWAS Z-score. Points represent group means; whiskers represent 95% confidence intervals. P-value for mean difference calculated by 1000 permutations of male/female point labels.
Fig. 6:
Fig. 6:. Evolutionary turnover of motifs for sex-biased transcription factors (TFs) is associated with gains and losses of sex bias.
(A) Representative gained or lost motifs in promoters of genes with lineage-specific gains or losses of sex bias (top) aligned with motifs for sex-biased TFs in same tissue (bottom). The lineage of sex bias gain or loss is indicated above each motif; the sex-biased TF and lineage of its sex bias are indicated below. (B) Total number of matches between gained/lost motifs and sex-biased TFs when considering tissue of TF sex bias (black) or randomly chosen tissues (grey). (C) Enrichment of ChIP-seq peaks in promoters of genes with lineage-specific sex biases containing gained or lost motifs for the TF. The sex-biased TF, along with tissue of sex bias and motif gain/loss and cell-type in which ChIP-seq was performed, are indicated to left. The log2 odds ratio for genes with lineage-specific sex bias and containing the motif as compared to a background set of genes with no motif is shown on x-axis, with 95% confidence intervals by Fisher’s exact test. (D) Effect of Pknox1 knockout (x-axis) (64) versus sex bias (y-axis), both in mouse muscle, for genes that show loss of sex bias in primate lineage and contain a motif for PKNOX1 in mouse.

References

    1. Wells JCK, Sexual dimorphism of body composition. Best Pract. Res. Clin. Endocrinol. Metab 21, 415–430 (2007). - PubMed
    1. Green HJ, Fraser IG, Ranney DA, Male and female differences in enzyme activities of energy metabolism in vastus lateralis muscle. J. Neurol. Sci 65, 323–331 (1984). - PubMed
    1. Ruigrok ANV et al. , A meta-analysis of sex differences in human brain structure. Neurosci. Biobehav. Rev 39, 34–50 (2014). - PMC - PubMed
    1. Klein SL, Flanagan KL, Sex differences in immune responses. Nat. Rev. Immunol 16, 626–638 (2016). - PubMed
    1. Hayward CS, Kalnins WV, Kelly RP, Gender-related differences in left ventricular chamber function. Cardiovasc. Res 49, 340–350 (2001). - PubMed

Publication types

Substances