. 2019 Aug 6;116(32):16086-16094.
doi: 10.1073/pnas.1902513116. Epub 2019 Jul 18.

Exosomes regulate neurogenesis and circuit assembly

Affiliations

Exosomes regulate neurogenesis and circuit assembly

Pranav Sharma et al. Proc Natl Acad Sci U S A. .

Abstract

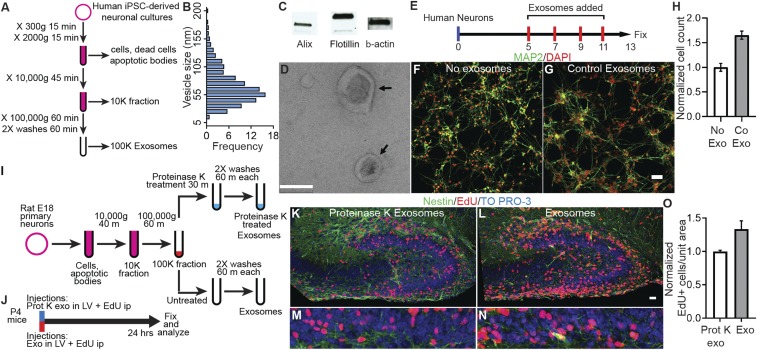
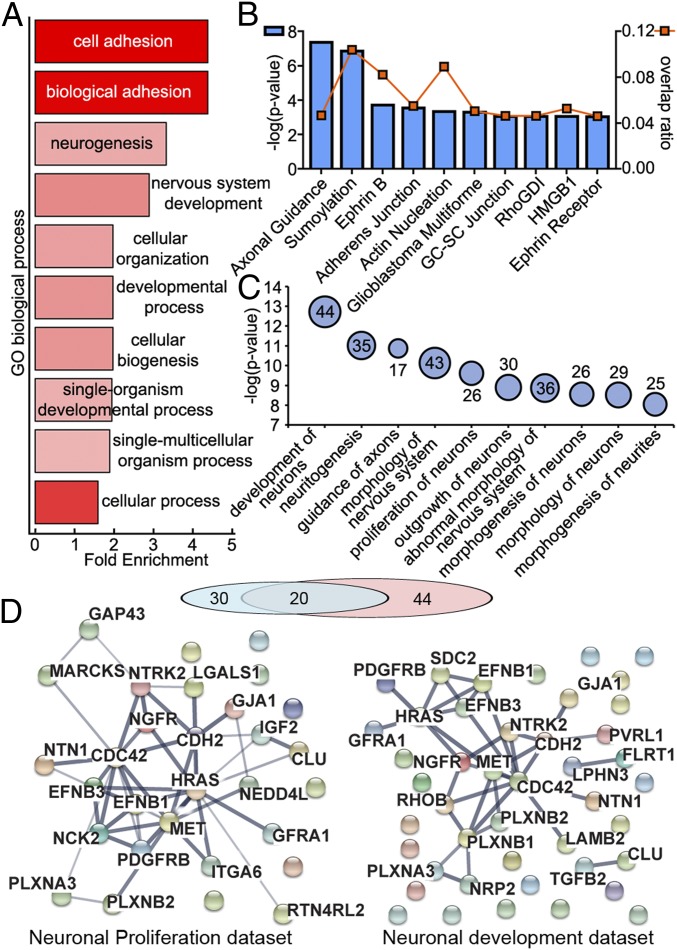
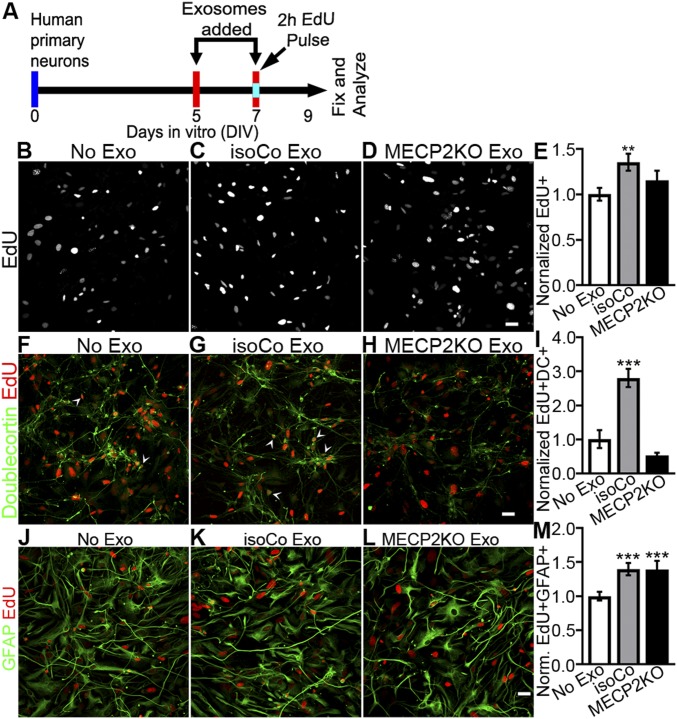
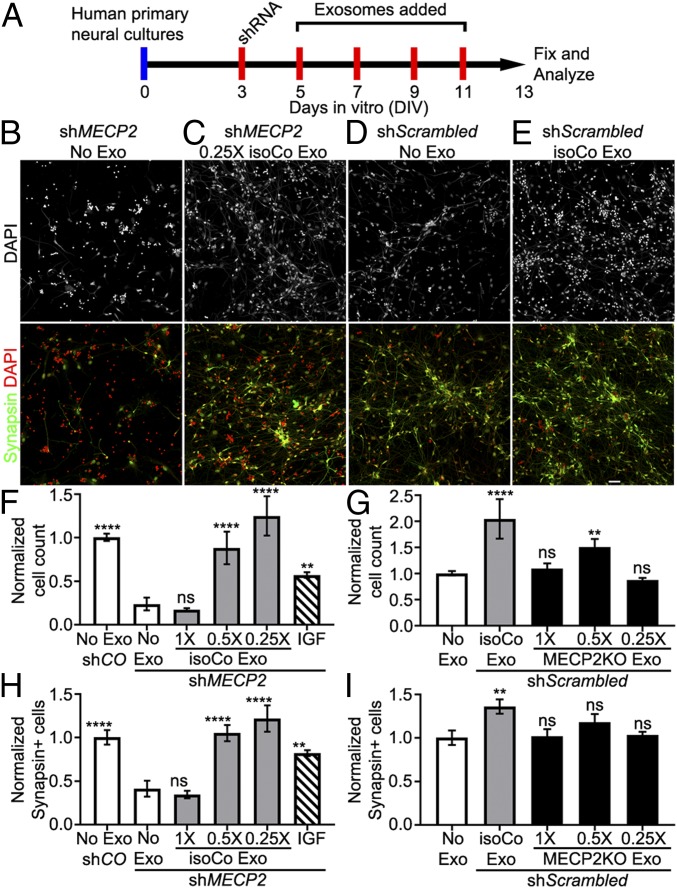
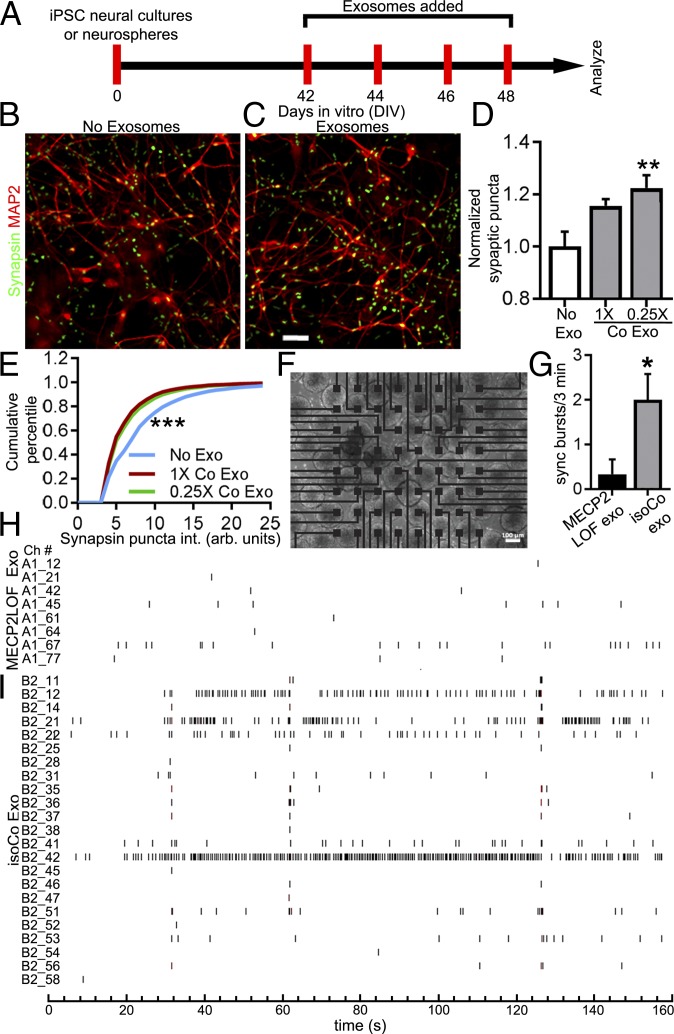
Exosomes are thought to be released by all cells in the body and to be involved in intercellular communication. We tested whether neural exosomes can regulate the development of neural circuits. We show that exosome treatment increases proliferation in developing neural cultures and in vivo in dentate gyrus of P4 mouse brain. We compared the protein cargo and signaling bioactivity of exosomes released by hiPSC-derived neural cultures lacking MECP2, a model of the neurodevelopmental disorder Rett syndrome, with exosomes released by isogenic rescue control neural cultures. Quantitative proteomic analysis indicates that control exosomes contain multiple functional signaling networks known to be important for neuronal circuit development. Treating MECP2-knockdown human primary neural cultures with control exosomes rescues deficits in neuronal proliferation, differentiation, synaptogenesis, and synchronized firing, whereas exosomes from MECP2-deficient hiPSC neural cultures lack this capability. These data indicate that exosomes carry signaling information required to regulate neural circuit development.

Keywords: Rett syndrome; exosomes; extracellular vesicle; neuronal development; synaptogenesis.


Conflict of interest statement

Conflict of interest statement: The authors declare a conflict of interest. A.R.M. is a cofounder and has equity interest in TISMOO, a company dedicated to genetic analysis focusing on therapeutic applications customized for autism spectrum disorder and other neurological disorders with genetic origins. The terms of this arrangement have been reviewed and approved by the University of California San Diego, in accordance with its conflict of interest policies. The remaining authors declare that they have no conflict of interest.

Figures

Fig. 1.
Fig. 1.
Exosomes increase proliferation in vitro and in vivo. (A) Protocol to purify exosomes by sequential ultracentrifugation. (B) Western blot analysis showing exosomal markers Alix and Flotillin in exosomes purified from human iPSC-derived neural cultures. (C) Electron micrograph of purified exosomes. Arrows point to exosomes with typical disk-shaped morphology. (D) Size distribution of exosomes purified from human iPSC-derived neural cultures. Vesicle diameter was calculated from electron micrographs. (E) Protocol for treatment of human primary neural cultures with purified control exosomes (Co Exo) or an equal volume of media (No Exo) added on DIV 5, 7, 9, and 11. Cultures were fixed on DIV 13, labeled, and analyzed. (F and G) Images of human neural cultures treated with media (No Exo, F) or control exosomes (Co Exo, G) labeled with MAP2 antibodies (green) or DAPI (red). (H) Graph of the total cell number in cultures treated with control exosomes compared with media alone (No Exo). Exosome treatment increased total cell number 1.65× ± 0.08 (P = 0.001, n = 4 wells per group, 2-way ANOVA). (I and J) Protocols for preparation of exosomes purified from E18 rat primary neural cultures (I) and treatment of P4 mice (J). Exosomes were purified from serum-free media collected from DIV9 rat neural cultures, and the 100,000 × g exosome pellet was equally divided into 2 tubes. One tube was treated with 100 µg/mL Proteinase K at 37 °C for 30 min to cleave surface proteins, and the other tube was left untreated. P4 mice received exosome injections into the lateral ventricles (LV), followed by intraperitoneal (ip) injections of 25 mg/kg of EdU. The mouse brains were fixed and processed to detect EdU+ cells. (KN) Images of hippocampal dentate gyrus of P4 mice injected with protein-depleted exosomes (K and L) and untreated exosomes (M and N) showing EdU+ cells (red), Nestin (green) immunolabeling, and TO-PRO-3 nuclear stain (blue). Low-magnification images were used to match identical brain regions (SI Appendix, Fig. S3). EdU+ cells were counted in the boxed regions in dentate gyrus region (KM), shown at 3.3× zoom in LN. Proliferation in the granule cell layer (GCL) of the dentate gyrus was quantified by counting EdU+ cells normalized to the area counted. (O) Exosome treatment increased Edu+ cells per unit area 1.34× ± 0.12 (n = 3 mice each) compared with proteinase K-treated exosomes. (Scale bars: C, 0.1 µm; F, G, K, and M, 20 µm.)
Fig. 2.
Fig. 2.
Exosomes contain signaling proteins that are altered with MECP2LOF. (A) Quantitative mass spectrometry comparing exosomes from MECP2LOF or isogenic CRISPR control hiPSC-derived neural cultures identified 2,572 proteins. The PANTHER overrepresentation test was performed on the dataset of 237 proteins with >1.5× change between MECP2LOF or control exosomes using the GO “biological processes” complete annotation dataset. The 237 candidates were classified into annotated GO biological process categories and compared with the normal human database to determine whether they are overrepresented or underrepresented for a given GO biological process. Fold enrichment (x-axis) is the ratio of proteins classified in each GO category from the experimental dataset relative to the number of proteins predicted to be in the GO category from the reference normal human dataset. Positive values indicate overrepresentation of the GO category in the experimental dataset. The y-axis shows the top 10 GO biological processes by P values plotted as a heat map, where color intensity depicts −log(P value) from 15.98 (bright red) to 10.38 (light red). “Neurogenesis” and “nervous system development” are among the most significantly enriched GO categories. (B) Top 10 canonical pathways from Ingenuity analysis using the dataset of 237 proteins. Blue bars, associated with the left y axis, show significance values plotted as −log(P value), and square orange markers, associated with the right y-axis, show the overlap ratios of the number of proteins from our dataset relative to the total number of proteins annotated to each canonical pathway. (C) Bubble chart showing Ingenuity analysis of the relative strength of downstream effects for biological functions and diseases in the nervous system using the dataset of 237 proteins showing >1.5× difference. The top 10 predicted biological functions are plotted vs. significance values plotted as −log(P values), where the bubble size represents the number of proteins from the dataset annotated for given function. The data values for bubble sizes are shown on the bubbles. (D) Functional protein association networks of 2 predicted biological functions from C, neuronal development and neuronal proliferation, are plotted by using the STRING database. The exosome proteins involved in 2 functions form robust networks and show significant overlap. The line thickness represents the confidence of association from highest (0.9) to medium (0.4).
Fig. 3.
Fig. 3.
Isogenic control exosomes increase proliferation and neuronal fate in developing neural cultures, whereas MECP2LOF exosomes have no effect. (A) Protocol for treatment of human primary neural cultures with exosomes to assay proliferation, survival, and cell fate. Human primary neural cultures were treated with media alone or exosomes on DIV 5 and 7. On DIV 7, cultures were exposed to 10 µM EdU for 2 h just before the second exosome or media treatment. Cultures were fixed and immunolabeled for analysis on DIV 9. (BE) Isogenic control exosomes increase cell proliferation. (BD) Confocal images show EdU-labeled human neural cultures treated with media (B, No exo), isogenic control exosomes (C, IsoCo exosomes), and MECP2LOF exosomes (D). (E) Treatment with isogenic control exosomes (gray bars) increased EdU-labeled progeny by 1.35× ± 0.09 (P = 0.006) compared with no exosomes (white bar), whereas MECP2LOF exosome treatment (black bars) had no effect (E). Edu+ cell numbers normalized to no-media condition. (FI) Isogenic control exosomes increase neuronal differentiation. Confocal images of EdU-labeled (red) and doublecortin-labeled (green) cultures treated with media (F), isogenic control exosomes (G), and MECP2LOF exosomes (H). Control exosomes (gray bars) increased neuronal progeny 2.8× ± 0.27 (P = 0.005), whereas MECP2LOF exosomes (black bars) had no effect (I). (JM) Isogenic control exosomes and MECP2LOF exosomes increase astrocyte differentiation. Confocal images of EdU-labeled (red) and GFAP-labeled (green) cultures treated with media (J), isogenic control exosomes (K), and MECP2LOF exosomes (L). Control as well as MECP2LOF exosome treatments increase Edu+GFAP+ astroglial progeny by 1.4× ± 0.09 (P = 0.006) and 1.4× ± 0.13 (P = 0.009), respectively (M). n = 4 wells per group. Statistics computed with 2-way ANOVA with Bonferroni correction. (Scale bar, 20 µm.)
Fig. 4.
Fig. 4.
Control exosomes rescue the reduced number of neurons resulting from MECP2 knockdown, but MECP2LOF exosomes have no adverse affect. (A) Protocol for treatment of human primary neural cultures with exosomes to assay changes in neurons. Human primary neural cultures were infected with lentivirus expressing shRNA to knock down MECP2 (green bars in FH) or control scrambled shRNA (blue bars in FI). Cultures were treated with media alone (No exosomes, white bars in FI), 1×, 0.5×, or 0.25× dose of control exosomes (gray bars in FI) or MECP2LOF exosomes (black bars in FI), or 10 ng/mL IGF (striped bars in FH) on DIV 5, 7, 9, and 11. On DIV 13, cultures were fixed and immunolabeled with Synapsin1 and counterstained with DAPI to quantify the number of neurons and total cells, respectively. (BE) DAPI labeling (grayscale; Top) and results from independent experiments (Bottom) with separate DAPI (red) and Synapsin1 (green) double-labeled wide-field fluorescent images from cultures with MECP2 knockdown (MECP2KD) treated with media alone (no Exo; B) and 0.25× control exosomes (C). Images from cultures with control shRNA and no exosomes (D) or isogenic control exosomes (E). (F and G) Plots of cell counts normalized to control cultures with no exosomes (no Exo shCO). MECP2KD (shMECP2, no exosomes) reduces the number of cells to 0.24× ± 0.07 (P = 0.0001) of control conditions (scrambled shRNA control, No exosomes). Treatment with 0.5× and 0.25× doses of control exosomes rescued the decreased cell number seen with MECP2KD without exosomes to 0.88× ± 0.19 (P = 0.0001 vs. MECP2KD, no exosomes) and 1.25× ± 0.22 (P = 0.0001 vs. MECP2KD, no exosomes) of control, respectively. IGF treatment showed partial rescue to 0.57× ± 0.03 (P = 0.007 vs. MECP2KD, no exosomes) of control. (G) MECP2KD (No exosome) decreases the number of neurons to 0.42× ± 0.09 control (CO-No exosome; P = 0.0001). Treatment with 0.5× control exosomes and 0.25× control exosomes rescued the number of neurons to 1.05× ± 0.09 and 1.22× ± 0.15 of control, respectively (P = 0.0001 each vs. MECP2KD, no exosomes). IGF treatment showed partial rescue to 0.8× ± 0.03 of control (P = 0.003 vs. MECP2KD, no exosomes). (H and I) In human primary neurons infected with lentivirus expressing control scrambled shRNA, treatment with isogenic control exosomes increased the number of cells 2.05× ± 0.69 (P = 4.4 × 10⁻⁴) compared with controls (no exosome) (H). The treatment with 0.5× MECP2LOF exosomes increased the number of cells by 1.48× ± 0.38 (P = 0.0001), whereas treatments with 1× MECP2LOF and 0.25× exosome doses did not show statistical differences from control. (I) Control exosome treatment increased the number of neurons 1.36× ± 0.08 (P = 0.004) compared with control (no exosomes), but none of the MECP2LOF exosome treatments altered neuron numbers compared with control (n = 3 for each group). Statistics computed with 2-way ANOVA with Bonferroni correction. (Scale bar, 20 µm.) ns, not significant.
Fig. 5.
Fig. 5.
Control exosome treatment increases synapse density and neuronal firing in MECP2LOF hiPSC-derived neurospheres. (A) Protocol for treatment of MECP2LOF hiPSC-derived neural cultures or neurospheres with control exosomes or media alone to assay synapses and synchronized firing. (BD) Control exosomes increased synapse density in MECP2LOF iPSC-derived neural cultures. Cultures were fixed on DIV 50 and labeled with the neuronal antibody MAP2 and Synapsin1 to identify synaptic puncta. Synaptic puncta density and intensity were quantified. Images of MAP2 (red) and Synapsin1 (green) labeling in MECP2LOF neural cultures without exosome treatment (B) or with control exosome treatment (C). (D) Exosome treatments increased synapse density. Treatment with control exosomes (0.25× dose) increased presynaptic puncta density to 1.22× ± 0.05 of control (no exosome) values (P = 0.006, n = 4 wells each, 2-way ANOVA with Bonferroni correction). (E) Kolmogorov–Smirnoff plot of cumulative frequency of synaptic puncta intensity shows that control exosome treatments (1× control [red line, D-stat = 0.24, P < 0.0001] and 0.25× control [green line, D-stat = 0.21, P < 0.0001]) increase the fraction of low-intensity puncta compared with no exosome treatment (blue line). (FI) Treatment of MECP2LOF neurospheres with control exosomes increased neural circuit activity. MECP2LOF hiPSC-derived neurospheres were plated on 64-channel multielectrode array (MEA; F) and treated with MECP2LOF exosomes or control exosomes. (G) Graph showing that synchronized bursts of activity occur with a greater frequency in MECP2LOF neurospheres treated with isogenic control exosomes compared with neurospheres treated with MECP2LOF exosomes (MECP2LOF exo, 0.33 ± 0.33 bursts per 3 min; control exo, 2.0 ± 0.68 bursts per 3 min; P = 0.03, n = 3 arrays each, 2-tailed t test). (H and I) Aligned raster plots of spiking activity over 3 min of recordings from active channels. MECP2LOF neurospheres treated with isogenic control exosomes (I) have more overall activity and more synchronized activity across different electrodes compared with neurospheres treated with MECP2LOF exosomes (H). Note also the fewer active channels in neurospheres treated with MECP2LOF exosomes. (Scale bars: B and C, 50 µm; F, 100 µm.)

Comment in

References

    1. Budnik V., Ruiz-Cañada C., Wendler F., Extracellular vesicles round off communication in the nervous system. Nat. Rev. Neurosci. 17, 160–172 (2016). - PMC - PubMed
    1. Sharma P., Schiapparelli L., Cline H. T., Exosomes function in cell-cell communication during brain circuit development. Curr. Opin. Neurobiol. 23, 997–1004 (2013). - PMC - PubMed
    1. Zappulli V., Friis K. P., Fitzpatrick Z., Maguire C. A., Breakefield X. O., Extracellular vesicles and intercellular communication within the nervous system. J. Clin. Invest. 126, 1198–1207 (2016). - PMC - PubMed
    1. Chiasserini D., et al. , Proteomic analysis of cerebrospinal fluid extracellular vesicles: A comprehensive dataset. J. Proteomics 106, 191–204 (2014). - PubMed
    1. Coleman B. M., Hill A. F., Extracellular vesicles–Their role in the packaging and spread of misfolded proteins associated with neurodegenerative diseases. Semin. Cell Dev. Biol. 40, 89–96 (2015). - PubMed

Publication types

MeSH terms

Substances