. 2019 Jul 18;10(1):3182.
doi: 10.1038/s41467-019-11150-8.

Activation of neuronal genes via LINE-1 elements upon global DNA demethylation in human neural progenitors

Affiliations

Activation of neuronal genes via LINE-1 elements upon global DNA demethylation in human neural progenitors

Marie E Jönsson et al. Nat Commun. .

Abstract

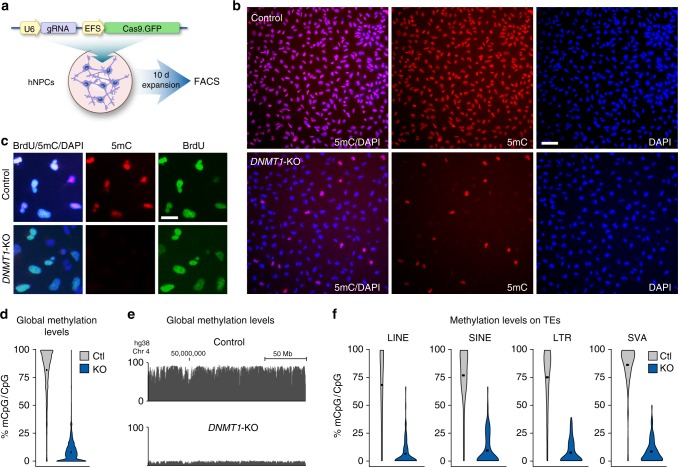
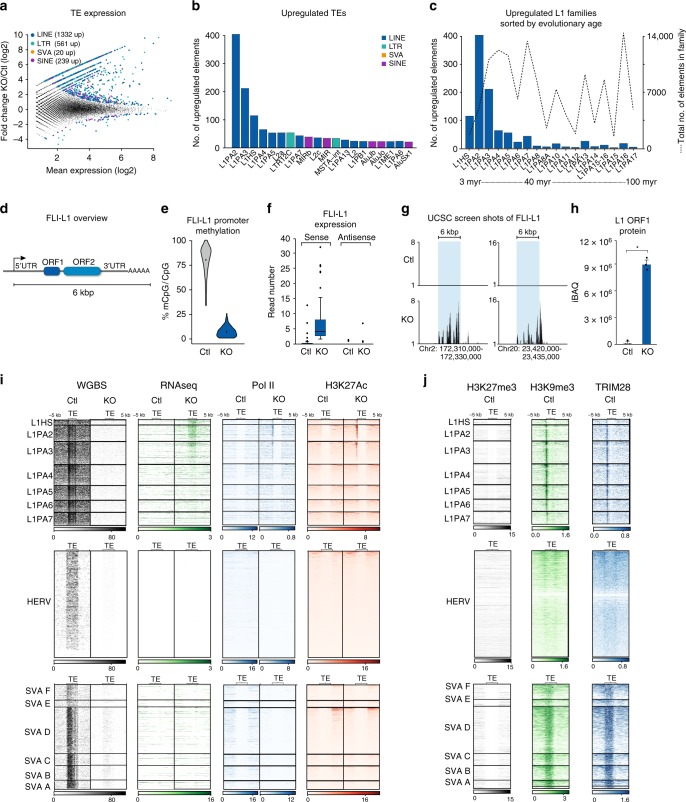
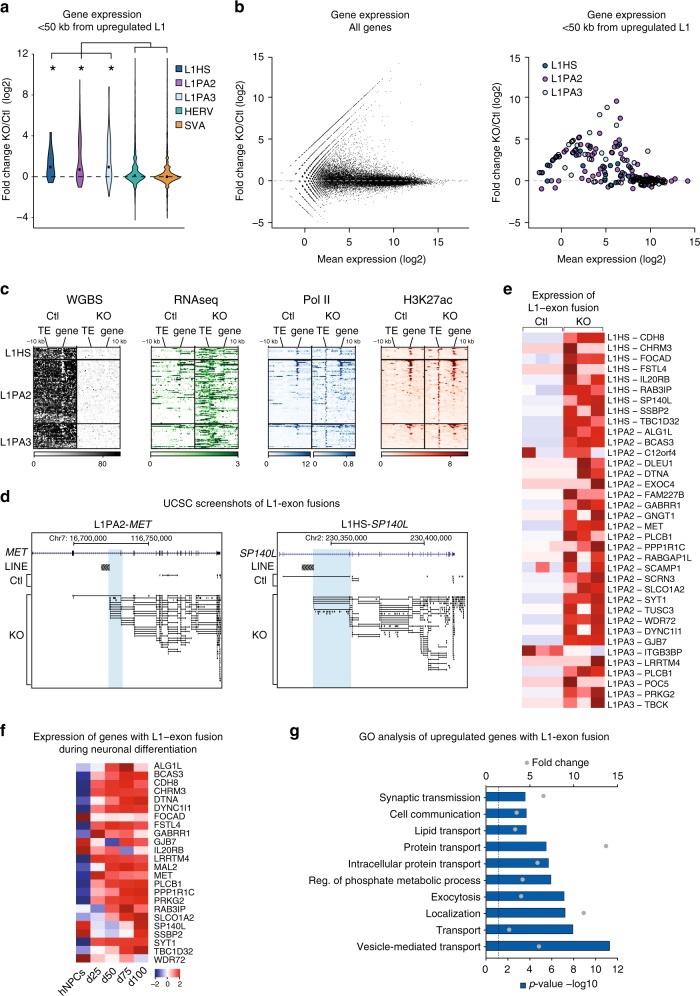
DNA methylation contributes to the maintenance of genomic integrity in somatic cells, in part through the silencing of transposable elements. In this study, we use CRISPR-Cas9 technology to delete DNMT1, the DNA methyltransferase key for DNA methylation maintenance, in human neural progenitor cells (hNPCs). We observe that inactivation of DNMT1 in hNPCs results in viable, proliferating cells despite a global loss of DNA CpG-methylation. DNA demethylation leads to specific transcriptional activation and chromatin remodeling of evolutionarily young, hominoid-specific LINE-1 elements (L1s), while older L1s and other classes of transposable elements remain silent. The activated L1s act as alternative promoters for many protein-coding genes involved in neuronal functions, revealing a hominoid-specific L1-based transcriptional network controlled by DNA methylation that influences neuronal protein-coding genes. Our results provide mechanistic insight into the role of DNA methylation in silencing transposable elements in somatic human cells, as well as further implicating L1s in human brain development and disease.


Conflict of interest statement

The authors declare no competing interests.

Figures

Fig. 1
Fig. 1
Disruption of DNMT1 in hNPCs leads to global loss of DNA methylation. a Schematic workflow of generation of DNMT1-KO hNPCs using LV.CRISPR-DNMT1. b Fluorescent immunostaining of 5mC 10 days post transduction with LV.CRISPR-DNMT1 and the control vector, scalebar 70 μm. c Control and DNMT1-KO hNPCs were allowed to incorporate BrdU between days 10–15 post transduction. Fluorescent immunostaining of 5mC and BrdU revealed that DNMT1-KO cells continued to divide and incorporate BrdU even after loss of DNA methylation, scalebar 25 μm. d The distribution of genome-wide mCpG/CpG ratios of 1 kb tiles is shown by Violin plots. Each data point is the mean mCpG/CpG ratio within each 1 kb tile. The black dot shows the mean of all 1 kb bin means. e UCSC screenshot of a part of chromosome 4 shows global loss of CpG methylation upon loss of DNMT1. f Violin plots show distribution of mCpG/CpG within all LINE, SINE, LTR, and SVA elements in hg38. The black dot shows the mean of all elements
Fig. 2
Fig. 2
Primate-specific L1s are activated upon global demethylation in hNPCs and Pol II and H3K27Ac were deposited on L1 promotors. a The fold change of expression of all individual TEs in the human genome upon DNMT1-KO. Mean expression is taken from all samples of both conditions (n = 3 in both groups). Significance threshold at BH-corrected p < 0.05. b The number of upregulated elements per TE family in the DNMT1-KO (n = 3) vs control (n = 3). The top 20 families with the highest number of upregulated elements are shown. c The L1 families are arranged based on evolutionary age: the average number of upregulated elements in each family upon DNMT1-KO and the total number of elements in each family are plotted on the left and right y-axes, respectively (n = 3 in both groups). d A schematic overview of an FLI-L1. e Distribution of CpG methylation (mCpG/CpG) at FLI-L1s (n = 145). Each data point is the mean mCpG/CpG within an FLI-L1. The black dot shows the mean of all elements. f The expression of FLI-L1s in the sense and antisense directions shown as boxplots. The expression in the sense direction was significantly upregulated, p < 2.2e−16, two-sided Wilcoxon rank sum test. The boxplot elements represent: center line, median; box limits, upper and lower quartiles; whiskers, ×1.5 interquartile range; dots, outliers. g Screenshots from UCSC showing two examples of FLI-L1s (indicated by blue boxes) that are upregulated in the DNMT1-KO hNPCs. h The proteomic analysis detected L1 ORF1 protein in the DNMT1-KO hNPCs. Error bars represent SEM from n = 3 per group, p = 0.0019, student’s t-test. Source data is provided as a Source Data file. i Heatmaps of WGBS, RNA-seq, ChIP-seq of Pol II and H3K27ac in control and DNMT1-KO hNPCs in the eight youngest L1 subfamilies, all FL-HERVs, and all SVAs. WGBS data are shown as % mCpG at all CpG sites. RNA-seq is shown as sum of all three replicates at each base. ChIP-seq of Pol II and H3K27ac is shown as mean signal of both replicates at each base. j Heatmaps of ChIP-seq signals of TRIM28, H3K9me3, and H3K27me3 in hNPCs in the eight youngest L1s, FL-HERVs, and SVAs. ChIP-seq of TRIM28 and H3K9me3 is shown as log2ratio of IP vs input. ChIP-seq of H3K27me3 is shown as mean signal of two replicates at each base
Fig. 3
Fig. 3
Demethylated L1 elements act as alternative promotors and drive the expression of neuronal genes. a The expression of genes within 50 kb of upregulated L1s, FL-HERVs, and SVAs upon DNMT1-KO (n = 3 in both groups), p < 0.05, Wilcoxon rank sum test. The black dot shows the mean expression. b The expression of genes that lie within 50 kb of upregulated L1-HS, L1-PA2, L1-PA3. c Heatmaps of WGBS, RNA-seq, ChIP-seq of Pol II and H3K27ac in control and DNMT1-KO hNPCs of genes that lie within 50 kb of upregulated L1-HS, L1-PA2 and L1-PA3. d UCSC screenshots of two examples of L1-fusion transcripts. Blue boxes are indicating the reads that are initiated in the L1s. e A heatmap showing the relative expression of L1-exon fusion reads in three biological replicates of DNMT1-KO and control hNPCs. Only L1-exon fusion reads for genes in which the L1 overlap annotated TSS are included. f A heatmap showing the expression of L1-driven genes upon neuronal differentiation of hNPCs (n = 2 at all timepoints). Only genes that are significantly upregulated in DNMT1-KO hNPCs and have a hominoid-specific L1-TSS overlap as well as L1-exon fusion reads in the neuronal differentiation data are included. g A GO analysis of the L1-driven genes, using Panther BP ontologies, p < 0.05 (p = 0.05 is indicated with a dotted line). The top 10 terms are listed, for a full list see Supplementary Data 3

References

    1. Jern P, Coffin JM. Effects of retroviruses on host genome function. Annu. Rev. Genet. 2008;42:709–732. doi: 10.1146/annurev.genet.42.110807.091501. - DOI - PubMed
    1. Friedli M, Trono D. The developmental control of transposable elements and the evolution of higher species. Annu. Rev. Cell Dev. Biol. 2015;31:429–451. doi: 10.1146/annurev-cellbio-100814-125514. - DOI - PubMed
    1. Chuong EB, Elde NC, Feschotte C. Regulatory activities of transposable elements: from conflicts to benefits. Nat. Rev. Genet. 2017;18:71–86. doi: 10.1038/nrg.2016.139. - DOI - PMC - PubMed
    1. Coufal NG, et al. L1 retrotransposition in human neural progenitor cells. Nature. 2009;460:1127–1131. doi: 10.1038/nature08248. - DOI - PMC - PubMed
    1. Erwin JA, et al. L1-associated genomic regions are deleted in somatic cells of the healthy human brain. Nat. Neurosci. 2016;19:1583–1591. doi: 10.1038/nn.4388. - DOI - PMC - PubMed

Publication types

MeSH terms

Substances