. 2019 Jul 18;10(1):3178.
doi: 10.1038/s41467-019-11123-x.

Live cell imaging reveals 3'-UTR dependent mRNA sorting to synapses

Affiliations

Live cell imaging reveals 3'-UTR dependent mRNA sorting to synapses

Karl E Bauer et al. Nat Commun. .

Abstract

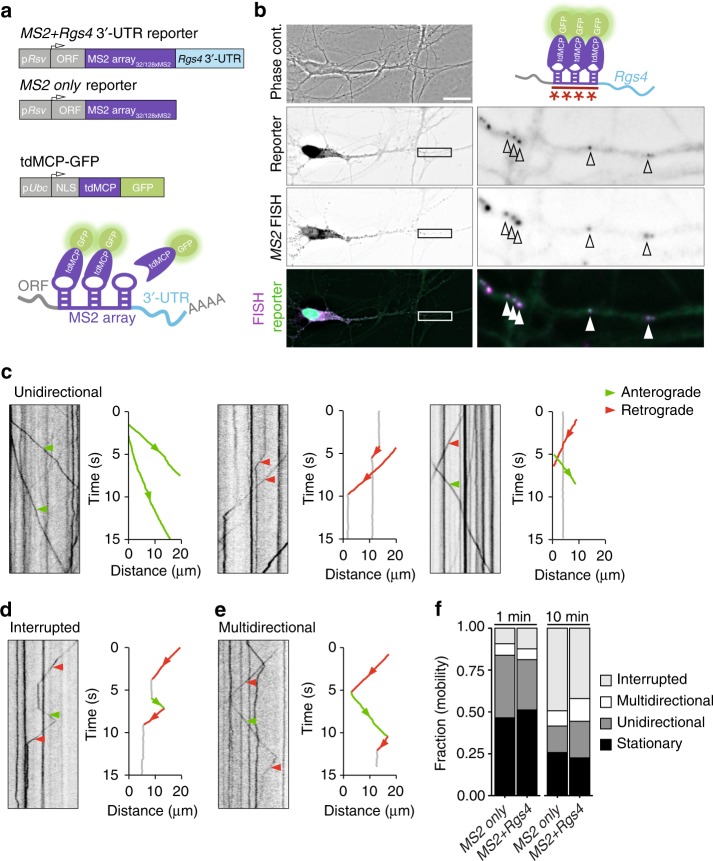
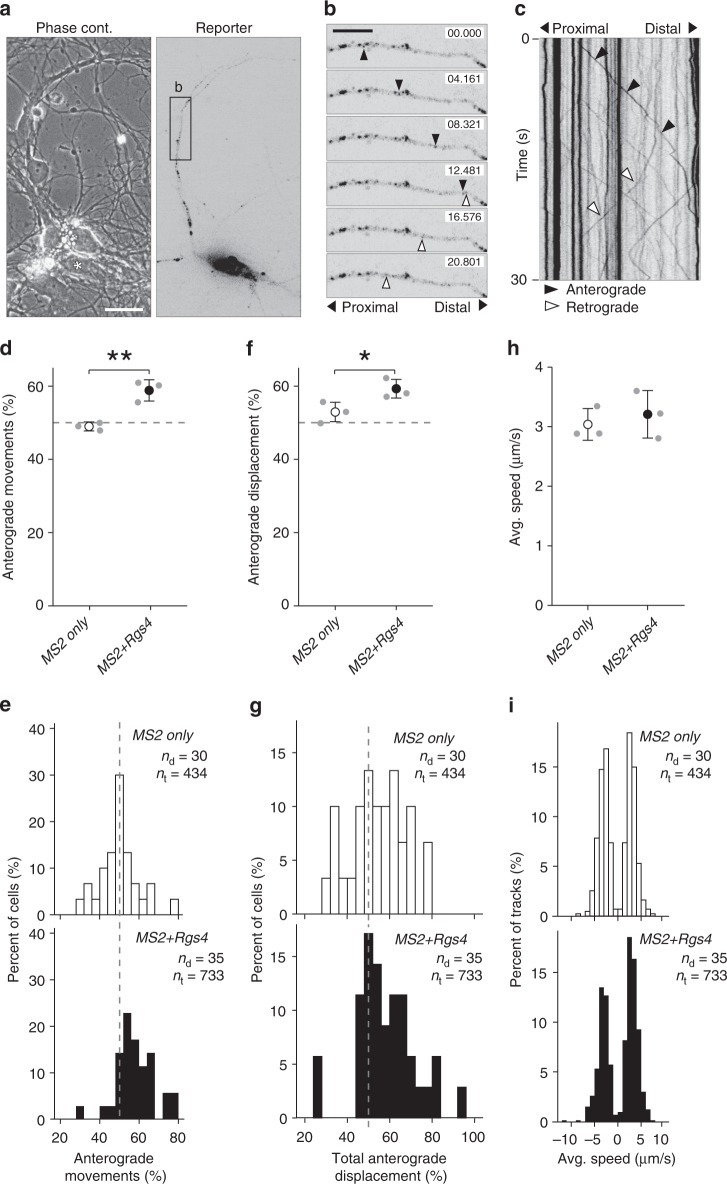
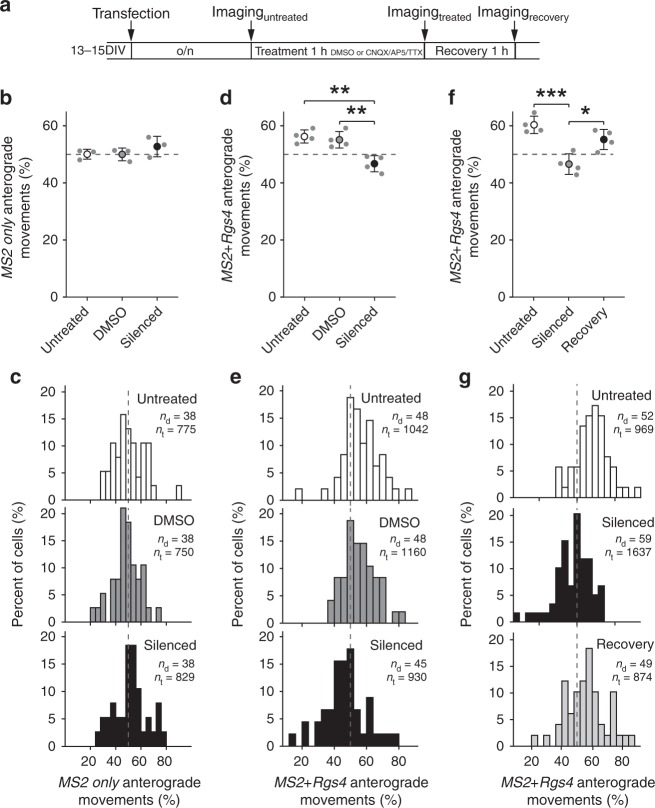
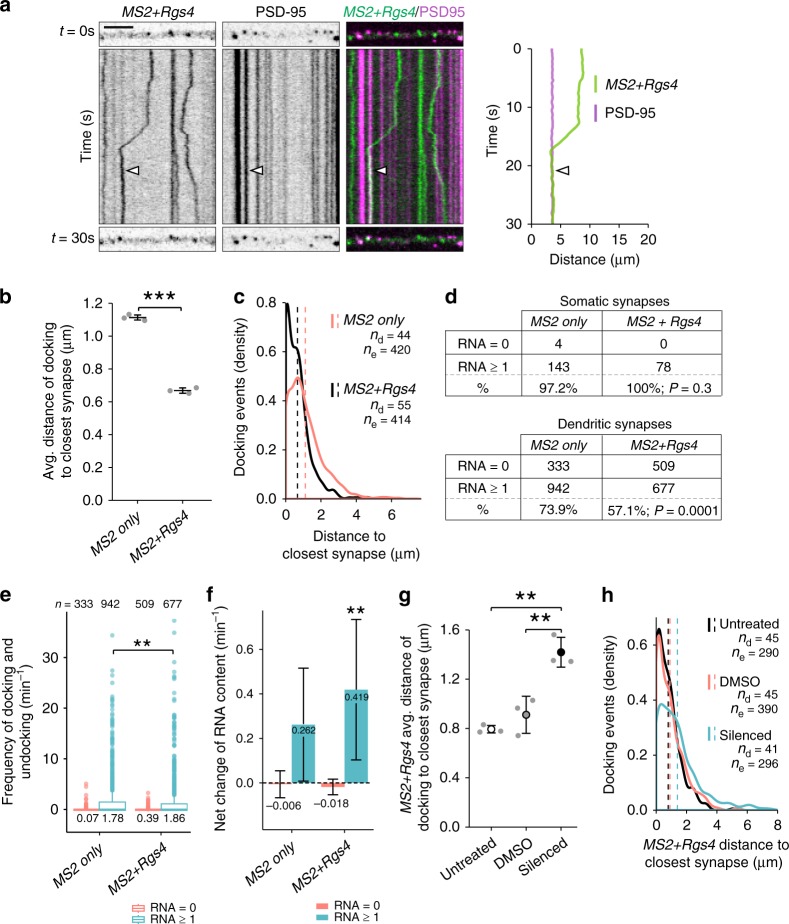
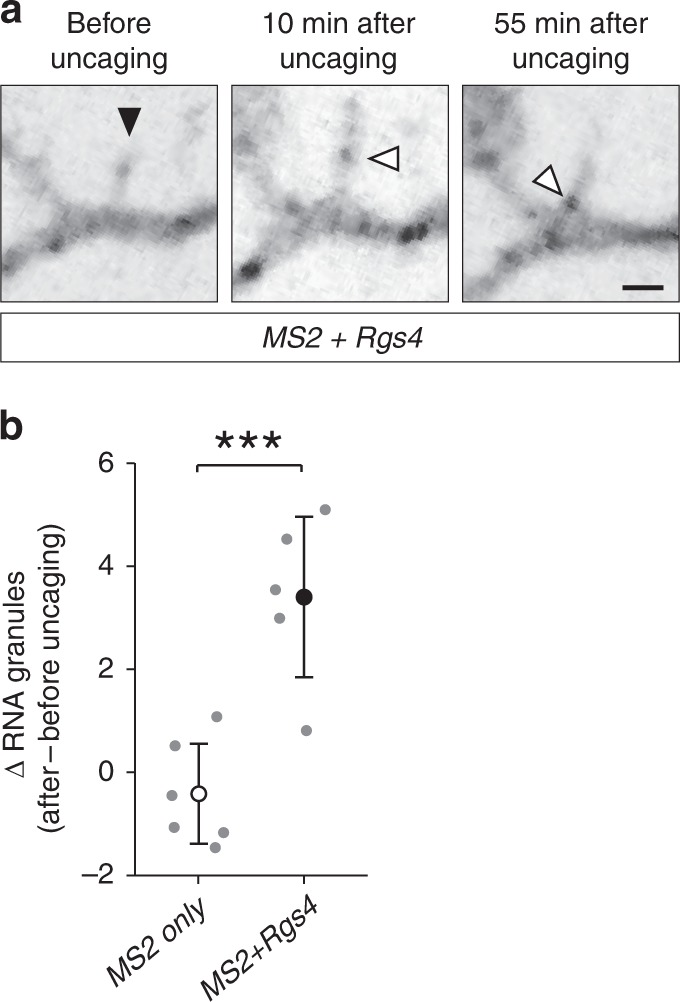
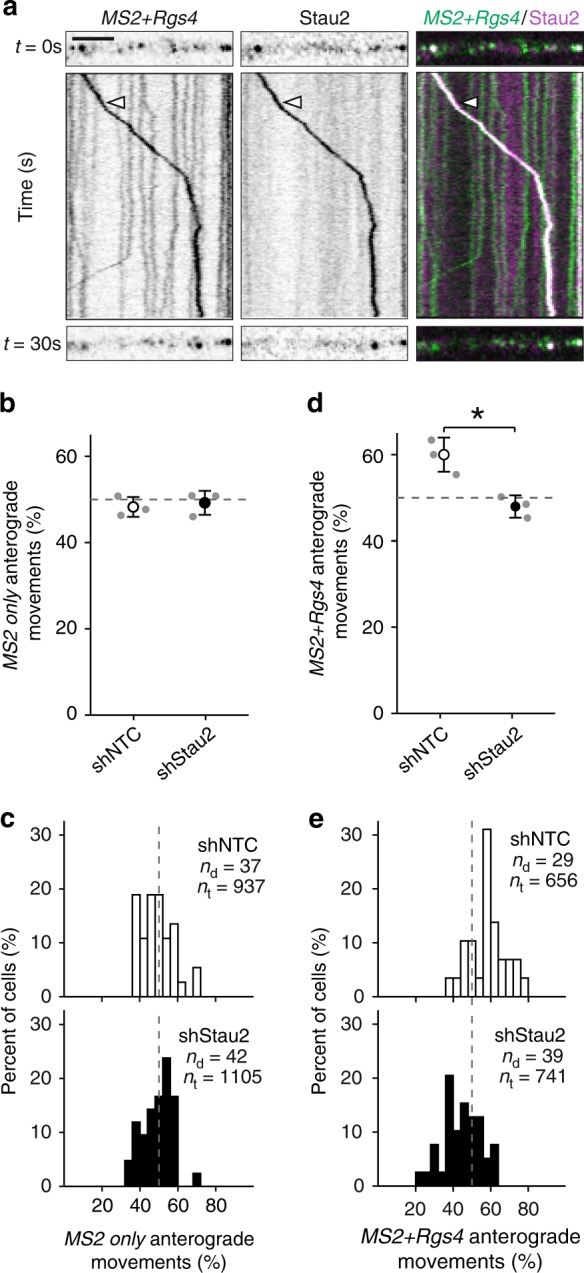
mRNA transport restricts translation to specific subcellular locations, which is the basis for many cellular functions. However, the precise process of mRNA sorting to synapses in neurons remains elusive. Here we use Rgs4 mRNA to investigate 3'-UTR-dependent transport by MS2 live-cell imaging. The majority of observed RNA granules display 3'-UTR independent bidirectional transport in dendrites. Importantly, the Rgs4 3'-UTR causes an anterograde transport bias, which requires the Staufen2 protein. Moreover, the 3'-UTR mediates dynamic, sustained mRNA recruitment to synapses. Visualization at high temporal resolution enables us to show mRNA patrolling dendrites, allowing transient interaction with multiple synapses, in agreement with the sushi-belt model. Modulation of neuronal activity by either chemical silencing or local glutamate uncaging regulates both the 3'-UTR-dependent transport bias and synaptic recruitment. This dynamic and reversible mRNA recruitment to active synapses would allow translation and synaptic remodeling in a spatially and temporally adaptive manner.


Conflict of interest statement

The authors declare no competing interests.

Figures

Fig. 1
Fig. 1
Reporter mRNAs display directed dendritic transport in hippocampal neurons. a Scheme of both MS2 only and MS2+Rgs4 reporter constructs and tdMCP-GFP expression cassettes (upper) and the MS2 system (lower). pRSV Rous sarcoma virus promoter, pUBC Ubiquitin C promoter, ORF open reading frame, NLS nuclear localization signal, tdMCP tandem MS2 coat protein, UTR untranslated region. b Phase contrast, GFP fluorescence (reporter), MS2 single molecule FISH and overlay in a rat hippocampal neuron expressing both tdMCP-GFP and MS2+Rgs4 MS2 reporter mRNA (scheme). Arrowheads indicate overlapping tdMCP-GFP bound MS2 reporter mRNA and MS2 smFISH. Fluorescent images were deconvolved to assess overlap (for unprocessed images see Supplementary Fig. 1e). Scale bar 20 µm. Boxed region is magnified in right panels. Representative kymographs (left) and extracted tracks (right) illustrating differences in unidirectional MS2+Rgs4 3′-UTR mRNA granule transport speed, displacement and directionality (c), as well as interrupted (d) and multidirectional transport (e). Anterograde and retrograde transport are indicated in green or red arrowheads and lines, respectively. f Quantification of relative transport dynamics of MS2 only and MS2+Rgs4 3′-UTR reporter mRNAs in 1 and 10-min time-series acquisitions, respectively
Fig. 2
Fig. 2
Rgs4 3′-UTR mediates an anterograde transport bias. a Representative phase contrast and GFP fluorescence of hippocampal neuronal culture cotransfected with the MS2+Rgs4 3′-UTR reporter and tdMCP-GFP constructs. Scale bar 20 µm. Asterisk denotes GFP positive cell. b Time series of the dendritic boxed region in a. Representative anterograde (black arrowheads) and retrograde (white arrowheads) moving mRNA granules are indicated. Scale bars 10 µm. c Kymograph of the dendritic region in b. Arrowheads indicate mRNA granules signified in b. Dot plots (d, f, h) and histograms (e, g, i) displaying percentage of anterograde moving granules (d, e), percentage of total anterograde displacement (f, g) and average speed (h, i) for MS2 only or MS2+Rgs4 3′-UTR reporter mRNAs, detected by tdMCP-GFP. In (i), positive values indicate anterograde and negative values indicate retrograde transport. Data represent mean ± standard deviation of three independent experiments (individual experiments shown as gray dots). Asterisks represent p-values obtained by Student’s t test (*p < 0.05, **p < 0.01). Data were obtained from 40-µm dendritic segments at a minimal distance of 20 µm from the cell body. At least 10 dendrites/condition/experiment were analyzed. Total number of dendrites (nd) and tracks (nt) analyzed per condition are indicated. Only displacements ≥1.5 µm were considered for analysis
Fig. 3
Fig. 3
Inhibition of neuronal activity abolishes Rgs4 3′-UTR-dependent transport bias. a Scheme of experimental outline. Dot plots (b, d, f) and histograms (c, e, g) displaying percentage of anterograde moving MS2 only (b, c) or MS2+Rgs4 3′-UTR (dg) reporter mRNA granules in rat hippocampal neurons, untreated, vehicle treated (DMSO) or silenced (100 µM CNQX, 50 µM AP5, 1 µM TTX) and after 1-h recovery. Data represent mean ± standard deviation of 3–4 independent experiments (individual experiments shown as gray dots). Asterisks represent p-values assessed by Tukey’s test post-hoc to one-way ANOVA analysis (*p < 0.05, **p < 0.01, ***p < 0.001). Data were obtained from 40-µm dendritic segments at a minimal distance of 20 µm from the cell body. At least 10 dendrites/condition/experiment were analyzed. Total number of dendrites (nd) and tracks (nt) analyzed per condition are indicated. Only displacements ≥1.5 µm were considered for analysis
Fig. 4
Fig. 4
Rgs4 3′-UTR mediates mRNA recruitment to synapses dependent on neuronal activity. a Representative dual-color kymograph showing MS2+Rgs4 3′-UTR reporter mRNA (green) and PSD-95-tagRFPt (magenta) from a dendrite of a rat hippocampal neuron. First and last frames are shown at top and bottom. Scale bar 5 µm. Extracted track (right) of an mRNA granule docking at a PSD-95 positive area indicated by arrowheads. Distance of MS2 only or MS2+Rgs4 3′-UTR reporter mRNA docking events to closest PSD-95 positive cluster in neurons displayed as dot plot (b) and density plot (c). d Distribution of MS2 only or MS2+Rgs4 reporter mRNA-positive (estimated RNA number ≥1 at t = 0 s) and -negative (RNA = 0 at t = 0 s) PSD-95-tagRFPt clusters in soma and dendrites. P-values of Chi tests against control are indicated. e Integrated frequency of reporter docking and undocking events at dendritic synapses. Number of observations and population means are indicated. f Average net change of MS2 only or MS2+Rgs4 mRNA content at mRNA reporter-positive or -negative synapses per min, calculated from estimated reporter molecules docking or undocking at synapses per event. Numbers indicate mean value of net RNA level change. Error bars represent 95% confidence intervals. ** indicates significant (α = 0.01) difference compared to zero (null hypothesis, two sided one-sample t-test). Distance of MS2+Rgs4 3′-UTR reporter mRNA docking events to closest PSD-95 positive cluster under untreated, vehicle treated (DMSO) or silenced (100 µM CNQX, 50 µM AP5, 1 µM TTX) conditions displayed as dot plot (g) and density plot (h). Data represent mean ± standard deviation of three independent experiments (individual experiments shown as gray dots; b, g). Dashed lines represent mean values of single data points (c, h). Asterisks represent p-values obtained by Student’s t test (b), Mann Whitney U test (e) or Tukey’s test post-hoc to one-way ANOVA analysis (g) (**p < 0.01, ***p < 0.001). Data were obtained from 40-µm dendritic segments at a minimal distance of 20 µm from the cell body. At least 10 dendrites/condition/experiment (ac, g, h) or 12 neurons/condition (df) from 3 independent biological replicates were analyzed. Total number of dendrites (nd), events (ne) and synapses (n) analyzed per condition are indicated
Fig. 5
Fig. 5
Local glutamate uncaging at spines triggers Rgs4 3′-UTR-dependent mRNA recruitment. a Representative GFP fluorescence of a hippocampal neuron cotransfected with the MS2+Rgs4 3′-UTR reporter and tdMCP-GFP constructs before (left panel) and after (middle, right panels) local glutamate uncaging. Black arrowhead denotes the uncaging spot at dendritic spine. White arrowheads indicate GFP positive MS2+Rgs4 reporter mRNA granules. Scale bar 2 µm. b Dot plot displaying the change in RNA granule number 40–45 min after uncaging compared to before uncaging within 5 µm of the stimulated spine. Data represent mean ± standard deviation (individual neurons shown as gray dots). Asterisks represent p-values obtained by Student’s t test (***p < 0.001). Data were obtained from six dendrites for MS2 only (five neurons of four biological replicates) and five dendrites for MS2+Rgs4 reporter mRNAs (five neurons of five biological replicates), respectively
Fig. 6
Fig. 6
Stau2 regulates Rgs4 3′-UTR-dependent transport. a Representative dual-color kymograph showing MS2+Rgs4 3′-UTR reporter mRNA (green) and tagRFPt-tagged Stau2 (magenta) from a dendrite of a rat hippocampal neuron. First and last frames are shown at top and bottom. Arrowheads indicate an MS2+Rgs4 reporter and Stau2 positive RNA granule undergoing cotransport. Scale bar 5 µm. Dot plots (b, d) and histograms (c, e) displaying percentage of anterograde moving MS2 only or MS2+Rgs4 3′-UTR reporter mRNA granules in shNTC and shStau2 transduced hippocampal neurons. NTC non-targeting control. Data represent mean ± standard deviation of three independent experiments (individual experiments shown as gray dots). Asterisks represent p-values obtained by Student’s t test (*p < 0.05). Data were obtained from 40-µm dendritic segments at a minimal distance of 20 µm from the cell body. Total number of dendrites (nd) and tracks (nt) analyzed per condition are indicated. Only displacements ≥1.5 µm were considered for analysis

References

    1. Buxbaum AR, Yoon YJ, Singer RH, Park HY. Single-molecule insights into mRNA dynamics in neurons. Trends Cell Biol. 2015;25:468–475. doi: 10.1016/j.tcb.2015.05.005. - DOI - PMC - PubMed
    1. Holt CE, Bullock SL. Subcellular mRNA localization in animal cells and why it matters. Science. 2009;326:1212–1216. doi: 10.1126/science.1176488. - DOI - PMC - PubMed
    1. Palacios IM, St Johnston D. Getting the message across: the intracellular localization of mRNAs in higher eukaryotes. Annu Rev. Cell Dev. Biol. 2001;17:569–614. doi: 10.1146/annurev.cellbio.17.1.569. - DOI - PubMed
    1. Cajigas IJ, et al. The local transcriptome in the synaptic neuropil revealed by deep sequencing and high-resolution imaging. Neuron. 2012;74:453–466. doi: 10.1016/j.neuron.2012.02.036. - DOI - PMC - PubMed
    1. Andreassi C, Riccio A. To localize or not to localize: mRNA fate is in 3’UTR ends. Trends Cell Biol. 2009;19:465–474. doi: 10.1016/j.tcb.2009.06.001. - DOI - PubMed

Publication types