. 2019 Jul 18;9(1):10425.
doi: 10.1038/s41598-019-46929-8.

Metabolomic Analysis of Skeletal Muscle in Aged Mice

Affiliations

Metabolomic Analysis of Skeletal Muscle in Aged Mice

Ran Uchitomi et al. Sci Rep. .

Abstract

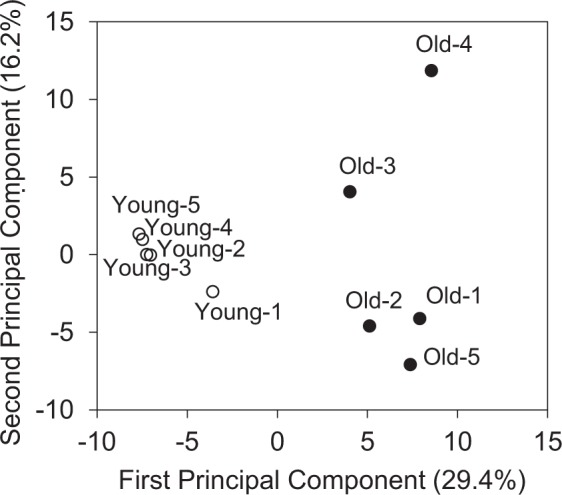
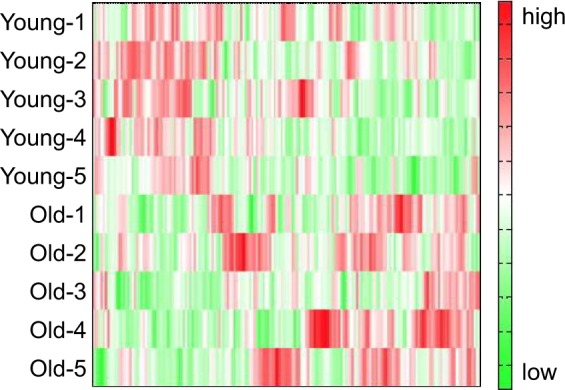
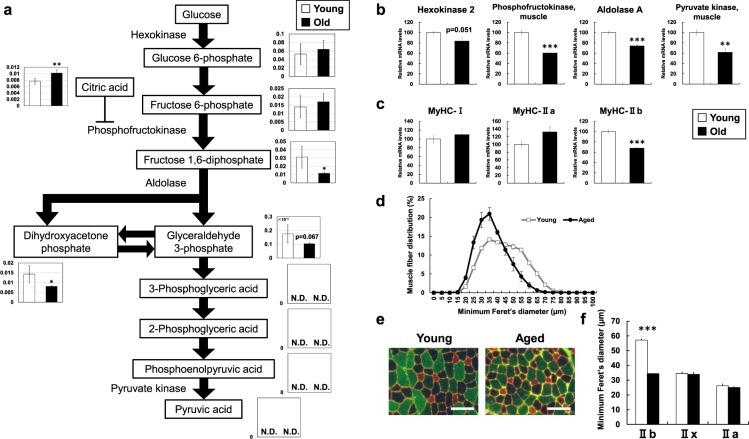
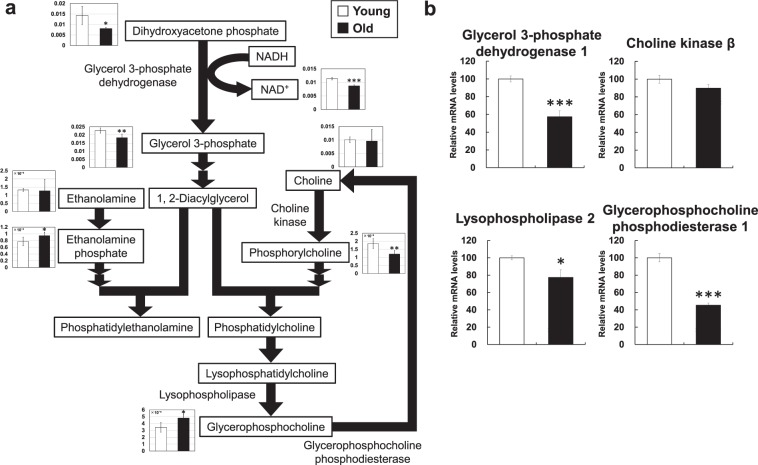
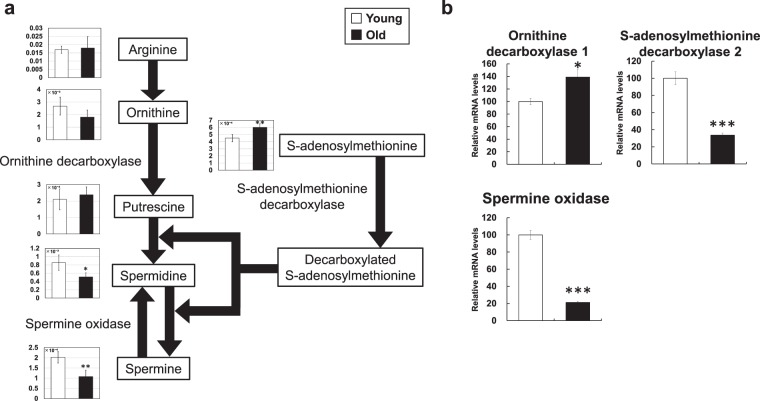
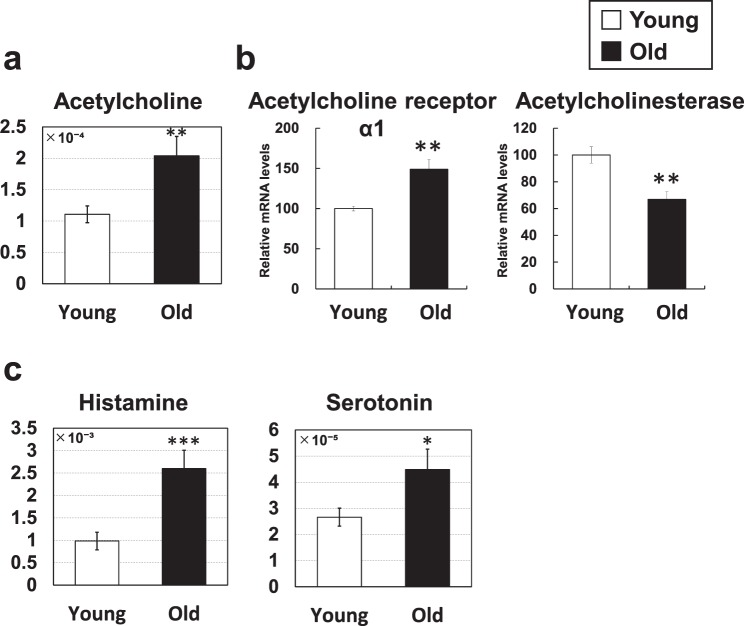
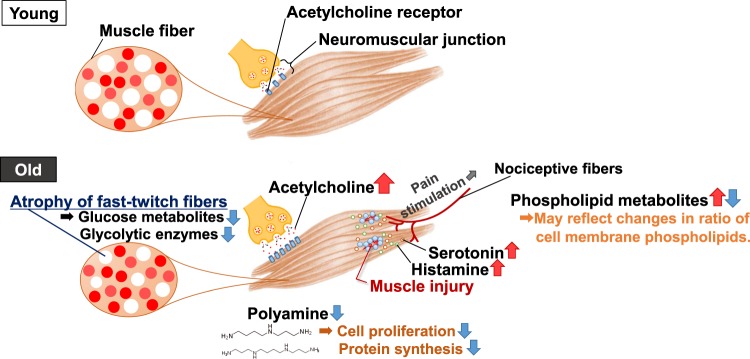
Sarcopenia is the age-induced, progressive loss of skeletal muscle mass and function. To better understand changes in skeletal muscle during sarcopenia, we performed a metabolomic analysis of skeletal muscle in young (8-week-old) and aged (28-month-old) mice by using capillary electrophoresis with electrospray ionization time-of-flight mass spectrometry. Principal component analysis showed clear changes in metabolites between young and aged mice. Glucose metabolism products were decreased in aged mice, specifically fructose 1,6-diphosphate (0.4-fold) and dihydroxyacetone phosphate (0.6-fold), possibly from decreased glycolytic muscle fibers. Multiple metabolic products associated with phospholipid metabolism were significantly changed in aged mice, which may reflect changes in cell membrane phospholipids of skeletal muscle. Products of polyamine metabolism, which are known to increase nucleic acid and protein synthesis, decreased in spermine (0.5-fold) and spermidine (0.6-fold) levels. By contrast, neurotransmitter levels were increased in skeletal muscle of aged mice, including acetylcholine (1.8-fold), histamine (2.6-fold), and serotonin (1.7-fold). The increase in acetylcholine might compensate for age-associated dropout of neuromuscular junctions, whereas the increases in histamine and serotonin might be due to muscle injury associated with aging. Further analysis focusing on the altered metabolites observed in this study will provide essential data for understanding aging muscles.


Conflict of interest statement

The authors declare no competing interests.

Figures

Figure 1
Figure 1
Principal component analysis (PCA) of metabolomic datasets of skeletal muscle from young and aged mice. Five mice were used in each group (Young-1 to Young-5 for young mice and Old-1 to Old-5 for aged mice). PCA was conducted with the determined data peaks using SampleStat ver. 3.14. Plots of young (open circles) and aged mice (filled circles) are clearly distinguished on the first principal component axis (x-axis).
Figure 2
Figure 2
A heat map comparing metabolite changes between young mice and aged mice. The vertical axis shows sample names corresponding to the samples used in Fig. 1 (Young-1 to Young-5 for young mice and Old-1 to Old-5 for aged mice). The heat map patterns between young (upper five lanes) and aged (lower five lanes) are clearly distinguishable. Red indicates that the relative content of metabolites is high, whereas green indicates that the relative content of metabolites is low.
Figure 3
Figure 3
Metabolic changes related to glucose metabolism. (a) Metabolite changes in the skeletal muscle of young and aged mice are shown. Relative metabolite changes shown in the graphs were obtained by CE-TOFMS (Supplementary Table 1). Open bars, young mice; filled bars, aged mice. Data are expressed as mean ± SD (N = 5); **p < 0.01, *p < 0.05. Gene expression of (b) glucose metabolism and (c) myosin heavy chain in skeletal muscle from young and aged mice. Open bars, young mice; filled bars, aged mice. Data are expressed as mean ± SE (N = 5); ***p < 0.001, **p < 0.01. (d) Feret’s diameter of total fiber in tibilias anterior (TA) muscle. (e) Immunohistochemical analysis of the fiber-type composition in TA muscles. Red, type IIa and laminin; unstained, type IIx; green, type IIb. Scale bars 100 μm. (f) Myofiber Feret’s diameter of individual fiber types in TA muscle. ***p < 0.001. There were few type I fibers in all samples.
Figure 4
Figure 4
Metabolic changes related to phospholipid metabolism. (a) Metabolite changes in the skeletal muscle of young and aged mice are shown. Relative metabolite changes shown in the graphs were obtained by CE-TOFMS (Supplementary Table 1). Open bars, young mice; filled bars, aged mice. Data are expressed as mean ± SD (N = 5); ***p < 0.001, **p < 0.01, *p < 0.05. (b) Gene expression of phospholipid metabolism in skeletal muscle from young and aged mice. Open bars, young mice; filled bars, aged mice. Data are expressed as mean ± SE (N = 5); ***p < 0.001, *p < 0.05.
Figure 5
Figure 5
Metabolic changes related to polyamine metabolism. (a) Metabolite changes in the skeletal muscle of young and aged mice are shown. Relative metabolite changes shown in the graphs were obtained by CE-TOFMS (Supplementary Table 1). Open bars, young mice; filled bars, aged mice. Data are expressed as mean ± SD (N = 5); **p < 0.01, *p < 0.05. (b) Gene expression of polyamine metabolism in skeletal muscle from young and aged mice. Open bars, young mice; filled bars, aged mice. Data are expressed as mean ± SE (N = 5); ***p < 0.001, *p < 0.05.
Figure 6
Figure 6
Metabolic changes related to neurotransmitters. (a,c) Metabolite changes in the skeletal muscle of young and aged mice are shown. Relative metabolite changes shown in the graphs were obtained by CE-TOFMS (Supplementary Table 1). Open bars, young mice; filled bars, aged mice. Data are expressed as mean ± SD (N = 5); ***p < 0.001, **p < 0.01, *p < 0.05. (b) Gene expression of acetylcholine receptor and acetylcholinesterase in skeletal muscle from young and aged mice. Open bars, young mice; filled bars, aged mice. Data are expressed as mean ± SE (N = 5); **p < 0.01.
Figure 7
Figure 7
Metabolic changes related to amino acids. (a,c) Metabolite changes in the skeletal muscle of young and aged mice are shown. Relative metabolite changes shown in the graphs were obtained by CE-TOFMS (Supplementary Table 1). Open bars, young mice; filled bars, aged mice. Data are expressed as mean ± SD (N = 5); ***p < 0.001, **p < 0.01. (b) Gene expression of collagen in skeletal muscle from young and aged mice. Open bars, young mice; filled bars, aged mice. Data are expressed as mean ± SE (N = 5); ***p < 0.001.
Figure 8
Figure 8
Schematic summary of this study. In the skeletal muscle of aged mice, several metabolite changes were observed. (1) Glucose metabolites decreased, likely due to preferential atrophy of fast-twitch fibers. (2) Phospholipid metabolites changed, likely reflecting changes in the ratio of cell membrane phospholipids. (3) Neurotransmitter levels significantly increased, likely because of neuromuscular junction dropout and muscle injury. (4) Products of polyamine metabolism decreased, probably contributing to aging phenotypes.

References

    1. Studenski S, et al. Gait speed and survival in older adults. Jama. 2011;305:50–58. doi: 10.1001/jama.2010.1923. - DOI - PMC - PubMed
    1. Chiba T, et al. Overexpression of FOXO1 in skeletal muscle does not alter longevity in mice. Mechanisms of ageing and development. 2009;130:420–428. doi: 10.1016/j.mad.2009.04.004. - DOI - PubMed
    1. Shavlakadze T, McGeachie J, Grounds MD. Delayed but excellent myogenic stem cell response of regenerating geriatric skeletal muscles in mice. Biogerontology. 2010;11:363–376. doi: 10.1007/s10522-009-9260-0. - DOI - PubMed
    1. Balagopal P, Schimke JC, Ades P, Adey D, Nair KS. Age effect on transcript levels and synthesis rate of muscle MHC and response to resistance exercise. American journal of physiology. Endocrinology and metabolism. 2001;280:E203–208. doi: 10.1152/ajpendo.2001.280.2.E203. - DOI - PubMed
    1. Holloszy JO, Chen M, Cartee GD, Young JC. Skeletal muscle atrophy in old rats: differential changes in the three fiber types. Mechanisms of ageing and development. 1991;60:199–213. doi: 10.1016/0047-6374(91)90131-I. - DOI - PubMed

Publication types