. 2019 Jul 18;9(1):10420.
doi: 10.1038/s41598-019-46927-w.

Overweight/obesity affects histological features and inflammatory gene signature of synovial membrane of Rheumatoid Arthritis

Affiliations

Overweight/obesity affects histological features and inflammatory gene signature of synovial membrane of Rheumatoid Arthritis

Stefano Alivernini et al. Sci Rep. .

Abstract

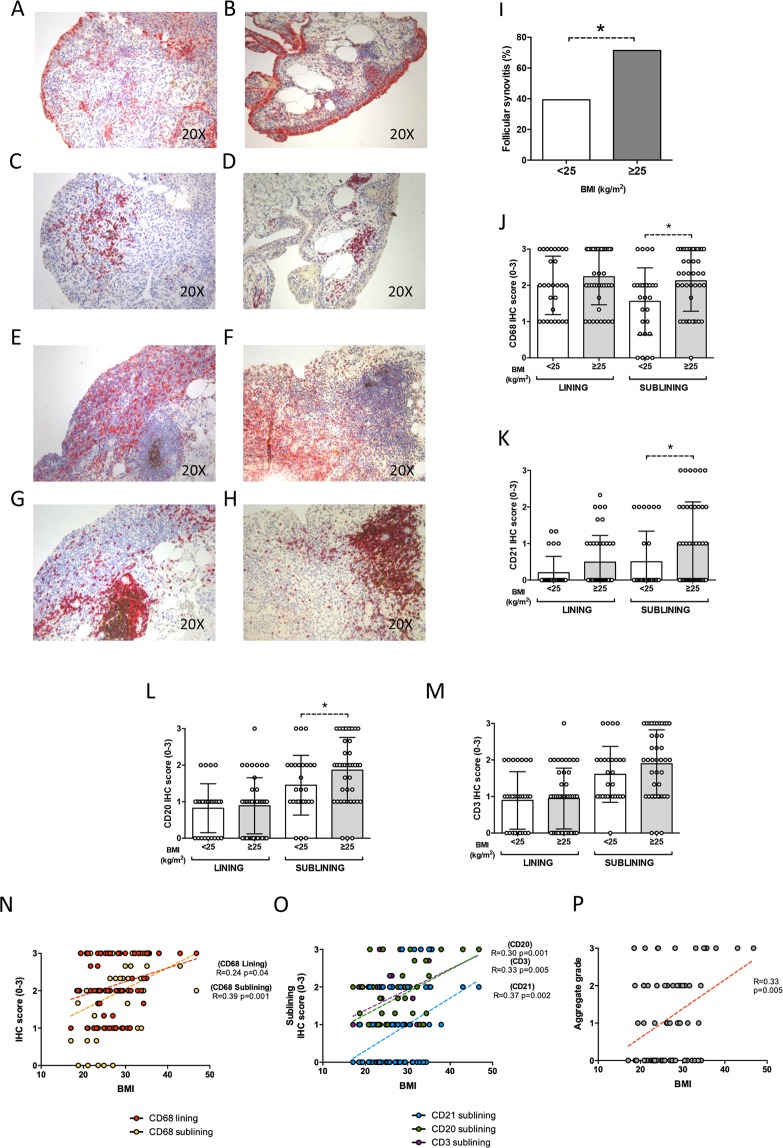
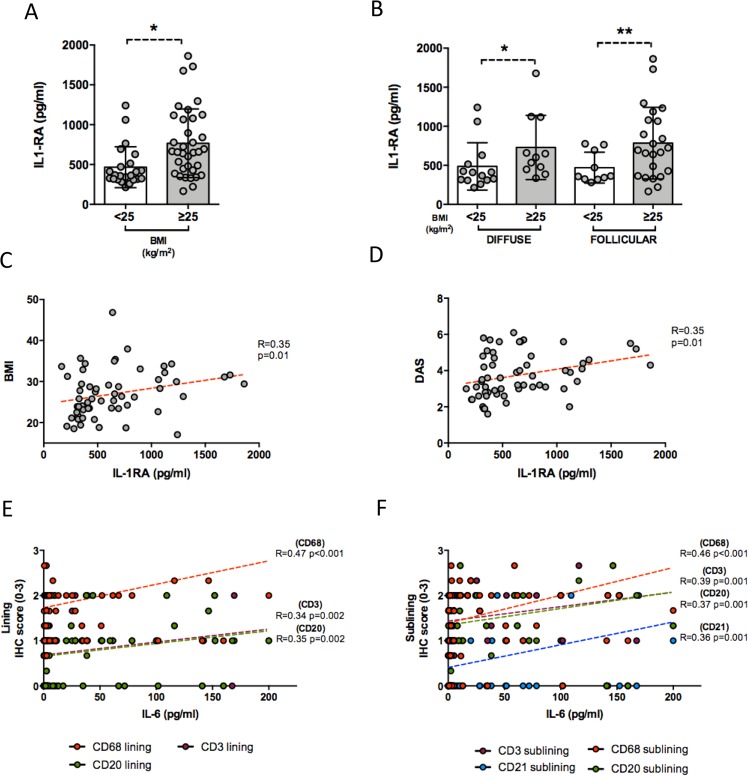
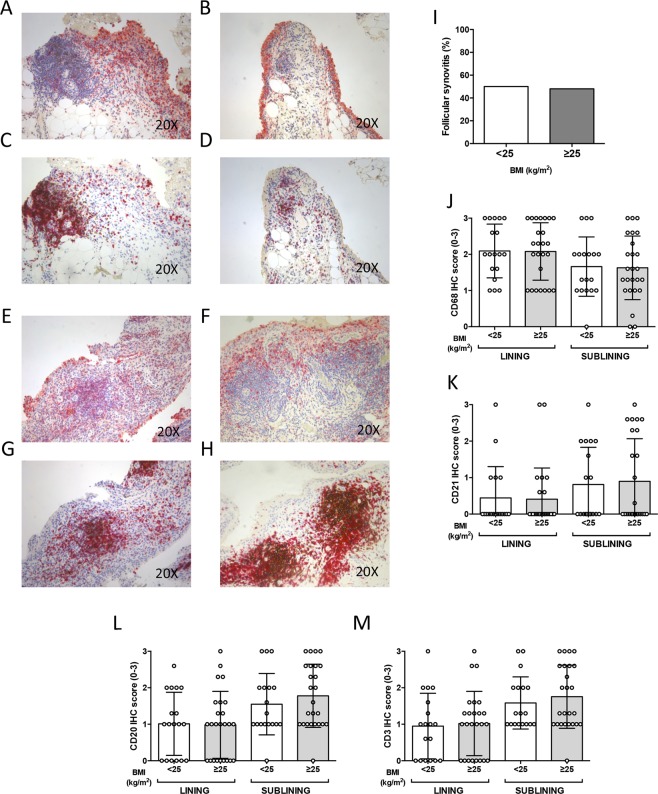
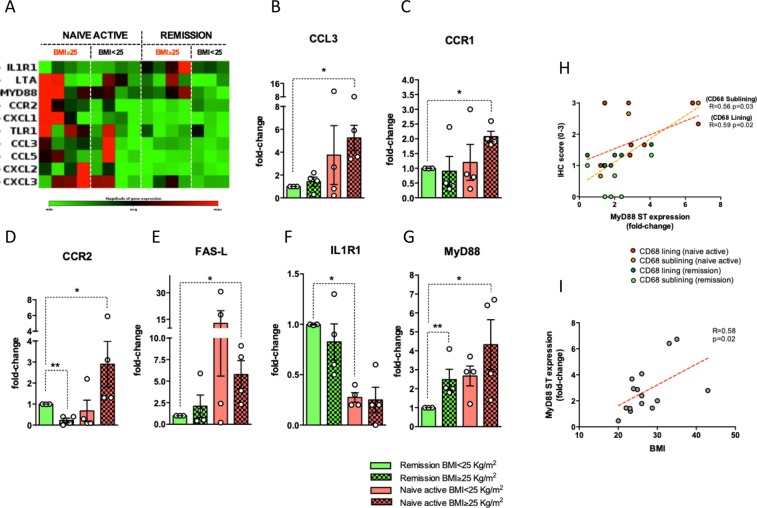
Overweight/obesity influence disease burden and clinical outcome of Rheumatoid Arthritis (RA). The impact of overweight/obesity on synovial tissue (ST) inflammation is largely unknown. Here, we investigated the histological and transcriptional signature of ST obtained from RA in different disease phases (disease onset, failure to first-line conventional DMARDs and in sustained clinical and ultrasound remission) finding that overweight/obese DMARDs naive RA showed higher likelihood of follicular synovitis, higher IHC scores for sublining inflammatory cells (CD68+, CD21+ and CD20+) and higher IL-1RA plasma levels than normal weight RA. Regardless to the synovitis pattern, overweight/obese DMARDs naive RA showed a worse clinical response to "Treat-to-target" (T2T) than normal weight RA at 6 and 12 months follow-up. Conversely, MTX-IR RA did not show significant differences in synovial inflammation based on BMI category. Overweight/obese RA in stable clinical and US remission showed higher degree of residual synovitis in terms of sublining CD68+, CD20+ cells and lining and sublining CD3+ compared to normal weight RA. Finally, gene expression profile analysis revealed that ST of overweight/obese DMARDs naive RA is enriched by CCL3 and MyD88 compared to normal weight RA in sustained disease remission, the latter correlating with BMI and IHC scores for synovial CD68+ cells. These findings suggest that indeed overweight/obese RA show higher degree of synovitis at disease onset and after remission achievement that influences the response rate to T2T and should be considered within the management of patients with RA.


Conflict of interest statement

The authors declare no competing interests.

Figures

Figure 1
Figure 1
(AP) Legend: IHC staining for CD68/CD21 and CD3/CD20 on ST of naive to DMARDs treatment Rheumatoid Arthritis patients based on the BMI category. (A,B) Example photos of CD68(red)/CD21(brown) staining of ST biopsies from naive to DMARDs RA with BMI < 25 kg/m2; (C,D) Example photos of CD3(red)/CD20(brown) staining of ST biopsies from naive to DMARDs RA with BMI < 25 kg/m2; (E,F) Example photos of CD68(red)/CD21(brown) staining of ST biopsies from naive to DMARDs RA with BMI ≥ 25 kg/m2; (G,H) Example photos of CD3(red)/CD20(brown) staining of ST biopsies from naive to DMARDs RA patients with BMI ≥ 25 kg/m2 (all magnifications 20X); (I) Rate of follicular synovitis in naive to DMARDs RA at disease onset with BMI < 25Kg/m2 (39.3%) vs RA with BMI ≥ 25 kg/m2 (71.4%, *p = 0.001); (J) Lining and sublining IHC score for CD68 cells in ST of naive to DMARDs RA based on BMI category; Lining and sublining CD68 IHC score of overweight/obese vs normal weight naive to DMARDs RA (p = 0.21 and *p = 0.01 respectively); (K) Lining and sublining IHC score for CD21 cells in ST of naive to DMARDs RA based on BMI category; Lining and sublining CD21 IHC score of overweight/obese vs normal weight naive to DMARDs RA (p = 0.06 and *p = 0.03 respectively); (L) Lining and sublining IHC score for CD20 cells in ST of naive to DMARDs RA based on BMI category; Lining and sublining CD20 IHC score of overweight/obese vs normal weight naive to DMARDs RA (p = 0.71 and *p = 0.05 respectively); (M) Lining and sublining IHC score for CD3 cells in ST of naive to DMARDs RA based on BMI category; Lining and sublining CD3 IHC score of overweight/obese vs normal weight naive to DMARDs RA patients (p = 0.79 and p = 0.17 respectively); (N) Correlations between lining and sublining IHC scores for CD68+ cells and BMI in naive to DMARDs RA patients; (O) Correlations between sublining IHC score of CD21+, CD20+ and CD3+ cells and BMI in naive to DMARDs RA patients; (P) Correlations between synovial aggregate grade value and BMI (R = 0.33; p = 0.005) in naïve to DMARDs RA; RA: Rheumatoid Arthritis; DMARDs: Disease Modifying Anti-Rheumatic Drugs; BMI: Body Mass Index; ST: Synovial Tissue; IHC: Immunohistochemistry; CD: Cluster Designation.
Figure 2
Figure 2
(AF) Legend: Association between cytokines plasma levels, BMI and degree of synovial inflammation in naïve RA patients and in RA patients in stable clinical and ultrasound remission. (A) IL-1RA plasma levels in naïve to treatment RA patients based on the BMI category, *p = 0.002; (B) IL-1RA plasma levels in naïve to treatment RA based on the BMI category and synovitis pattern, *p = 0.05 and **p = 0.04; (C) Correlation between IL-1RA plasma levels and BMI value in naïve to treatment RA patients; (D) Correlation between IL-1RA plasma levels and DAS value in naïve to treatment RA patients; (E) Correlations between IL-6 plasma levels and lining IHC scores for CD68+, CD3+ and CD20+ cells in naïve to treatment RA patients and RA patients in stable clinical and ultrasound remission; (F) Correlations between IL-6 plasma levels and sublining IHC scores for CD68+, CD21+, CD3+ and CD20+ cells in naïve to treatment RA patients and RA in stable clinical and ultrasound remission; RA: Rheumatoid Arthritis; BMI: Body Mass Index; IHC: Immunohistochemistry; CD: Cluster Designation.
Figure 3
Figure 3
(AM) Legend: IHC staining for CD68/CD21 and CD3/CD20 on ST of patients with Rheumatoid Arthritis inadequately responder to MTX based on the BMI category. (A,B) Example photos of CD68(red)/CD21(brown) staining of ST biopsies from MTX-IR RA with BMI < 25 kg/m2; (C,D) Example photos of CD3(red)/CD20(brown) staining of ST biopsies from MTX-IR RA with BMI < 25 kg/m2; (E,F) Example photos of CD68(red)/CD21(brown) staining of ST biopsies from MTX-IR RA with BMI ≥ 25 kg/m2; (G,H) Example photos of CD3(red)/CD20(brown) staining of ST biopsies from MTX-IR RA patients with BMI ≥ 25 kg/m2; (all magnifications 20X) (I) Rate of follicular synovitis in MTX-IR RA with BMI < 25 Kg/m2 (50.0%) vs MTX-IR RA with BMI ≥ 25 Kg/m2 (48.0%; p = 0.97); (J) Lining and sublining IHC score for CD68 cells in ST of MTX-IR RA based on BMI category; Lining and sublining CD68 IHC score of overweight/obese vs normal weight MTX-IR RA (p = 0.95 and p = 0.90 respectively); (K) Lining and sublining IHC score for CD21 cells in ST of MTX-IR RA based on BMI category; Lining and sublining CD21 IHC score of overweight/obese vs normal weight MTX-IR RA (p = 0.89 and p = 0.79 respectively); (L) Lining and sublining IHC score for CD20 cells in ST of MTX-IR RA based on BMI category; Lining and sublining CD20 IHC score of overweight/obese vs normal weight MTX-IR RA (p = 0.92 and p = 0.38 respectively); (M) Lining and sublining IHC score for CD3 cells in ST of MTX-IR RA based on BMI category; Lining and sublining CD3 IHC score of overweight/obese vs normal weight MTX-IR RA (p = 0.80 and p = 0.49 respectively); RA: Rheumatoid Arthritis; MTX-IR: inadequately responder to Methotrexate; ST: Synovial Tissue; IHC: Immunohistochemistry; BMI: Body Mass Index; CD: Cluster Designation.
Figure 4
Figure 4
(AL) Legend: IHC staining for CD68/CD21 and CD3/CD20 on ST of patients with Rheumatoid Arthritis in clinical and ultrasound remission under MTX + TNF-i based on the BMI category. (A,B) Example photos of CD68(red)/CD21(brown) staining of ST from RA with BMI < 25 kg/m2 in clinical and ultrasound remission under MTX + TNF-i; (C,D) Example photos of CD3(red)/CD20(brown) staining of ST from RA with BMI < 25 kg/m2 in clinical and ultrasound remission under MTX + TNF-i; (E,F) Example photos of CD68(red)/CD21(brown) staining of ST from RA with BMI ≥ 25 kg/m2 in clinical and ultrasound remission under MTX + TNF-i; (G,H) Example photos of CD3(red)/CD20(brown) staining of ST from RA with BMI ≥ 25 kg/m2 in clinical and ultrasound remission under MTX + TNF-i (all magnifications 20X); (I) Lining and sublining IHC score for CD68 cells in ST of RA in clinical and ultrasound remission under MTX + TNF-i based on BMI category; Lining and sublining CD68 IHC score of overweight/obese vs normal weight RA in clinical and ultrasound remission under MTX + TNF-i (p = 0.17 and *p < 0.001 respectively); (J) Lining and sublining IHC score for CD20 cells in ST of RA in clinical and ultrasound remission under MTX + TNF-i based on BMI category; Lining and sublining CD20 IHC score of overweight/obese vs normal weight RA in clinical and ultrasound remission under MTX + TNF-i (p = 0.95 and *p = 0.02 respectively); (K) Lining and sublining IHC score for CD3 cells in ST of RA in clinical and ultrasound remission under MTX + TNF-i based on BMI category; Lining and sublining CD3 IHC score of overweight/obese vs normal weight RA in clinical and ultrasound remission under MTX + TNF-i (*p = 0.02 and *p = 0.04 respectively); (L) Correlations between IHC scores of sublining CD68+, CD20+ and CD3+ cells and BMI (R = 0.39, p = 0.001 for CD68+, R = 0.10, p = 0.63 for CD20+ and R = 0.30, p = 0.14 for CD3+ cells respectively) in RA in stable clinical and ultrasound remission under MTX + TNF-i; (M) Correlation between IL-6 PB levels and IHC of sublining CD68+ cells (R = 0.43; p = 0.04) in RA in stable clinical and ultrasound remission under MTX + TNF-i (red dots indicate RA with BMI ≥ 25 kg/m2 and green dots indicate RA with BMI < 25 kg/m2, respectively); RA: Rheumatoid Arthritis; IHC: Immunohistochemistry; BMI: Body Mass Index; CD: Cluster designation; MTX: Methotrexate; TNF-i: Tumor Necrosis factor inhibitor.
Figure 5
Figure 5
(AI) Legend: Gene expression profile of synovial tissue of RA patients with naive to treatment active disease and in sustained clinical and ultrasound remission based on BMI category. (A) Clustergram of the dataset displaying a heat map indicating expression of genes across individual samples (naive to treatment active RA and RA in sustained clinical and ultrasound remission based on BMI category); (B) CCL3 expression in naive to treatment active RA and RA in sustained clinical and ultrasound remission based on BMI category; *p = 0.02 CCL3 gene expression in synovial tissue of naive to treatment active RA with BMI ≥ 25 Kg/m2 compared to RA patients in sustained clinical and ultrasound remission with BMI < 25 Kg/m2; (C) CCR1 expression in naive to treatment active RA and RA in sustained clinical and ultrasound remission based on BMI category; *p = 0.03 CCR1 gene expression in synovial tissue of naive to treatment active RA with BMI ≥ 25 Kg/m2 compared to RA patients in sustained clinical and ultrasound remission with BMI < 25 Kg/m2; (D) CCR2 expression in naive to treatment active RA and RA in sustained clinical and ultrasound remission based on BMI category; *p = 0.02 CCR2 gene expression in synovial tissue of naive to treatment active RA with BMI ≥ 25 Kg/m2 and **p = 0.001 CCR2 in RA patients in sustained clinical and ultrasound remission BMI ≥ 25 Kg/m2 compared to RA patients in sustained clinical and ultrasound remission with BMI < 25 Kg/m2; (E) FAS-L expression in naive to treatment active RA and RA in sustained clinical and ultrasound remission based on BMI category; *p = 0.03 FAS-L gene expression in synovial tissue of naive to treatment active RA with BMI ≥ 25 Kg/m2 compared to RA patients in sustained clinical and ultrasound remission with BMI < 25 Kg/m2; (F) IL1R1 expression in naive to treatment active RA and RA in sustained clinical and ultrasound remission based on BMI category; *p = 0.02 IL1R1 gene expression in synovial tissue of naive to treatment active RA with BMI < 25 Kg/m2 compared to RA patients in sustained clinical and ultrasound remission with BMI < 25 Kg/m2; (G) MyD88 expression in naive to treatment active RA and RA in sustained clinical and ultrasound remission based on BMI category; *p = 0.02 MyD88 gene expression in synovial tissue of naive to treatment active RA with BMI ≥ 25 Kg/m2 and **p = 0.04 MyD88 gene expression in synovial tissue of RA in sustained remission with BMI ≥ 25 Kg/m2 compared to RA patients in sustained clinical and ultrasound remission with BMI < 25 Kg/m2; (H) Correlations between MyD88 expression in synovial tissue of RA patients and IHC scores for lining (R = 0.59; p = 0.02) and sublining (R = 0.56; p = 0.03) CD68+ cells; (I) Correlations between MyD88 expression in synovial tissue of RA patients and BMI value (R = 0.58; p = 0.02); IHC: Immunohistochemistry; CD: Cluster designation. RA: Rheumatoid Arthritis; BMI: Body Mass Index.

References

    1. Gremese E, et al. Obesity and reduction of the response rate to anti-tumor necrosis factor α in rheumatoid arthritis: an approach to a personalized medicine. Arthritis Care Res. (Hoboken) 2013;65:94–100. doi: 10.1002/acr.21768. - DOI - PubMed
    1. Gremese E, Tolusso B, Gigante MR, Ferraccioli G. Obesity as a risk and severity factor in rheumatic diseases (autoimmune chronic inflammatory diseases) Front. Immunol. 2014;5:576. doi: 10.3389/fimmu.2014.00576. - DOI - PMC - PubMed
    1. Ajeganova S, Andersson ML, Hafstrom I. BARFOT study group. Association of obesity with worse disease severity in rheumatoid arthritis as well as with comorbidities: a long-term follow-up from disease onset. Arthritis Care Res (Hoboken) 2013;65:78–87. doi: 10.1002/acr.21710. - DOI - PubMed
    1. Klaasen R, Wijbrandts CA, Gerlag DM, Tak PP. Body mass index and clinical response to infliximab in rheumatoid arthritis. Arthritis Rheumato.l. 2011;63:359–64. doi: 10.1002/art.30136. - DOI - PubMed
    1. Heimans L, et al. Association of high body mass index with decreased treatment response to combination therapy in recent-onset rheumatoid arthritis patients. Arthritis Care Res. (Hoboken) 2013;65:1235–42. doi: 10.1002/acr.21978. - DOI - PubMed

Publication types