

Extending Classification Algorithms to Case-Control Studies
- PMID: 31320812
- PMCID: PMC6630079
- DOI: 10.1177/1179597219858954
Extending Classification Algorithms to Case-Control Studies
Abstract
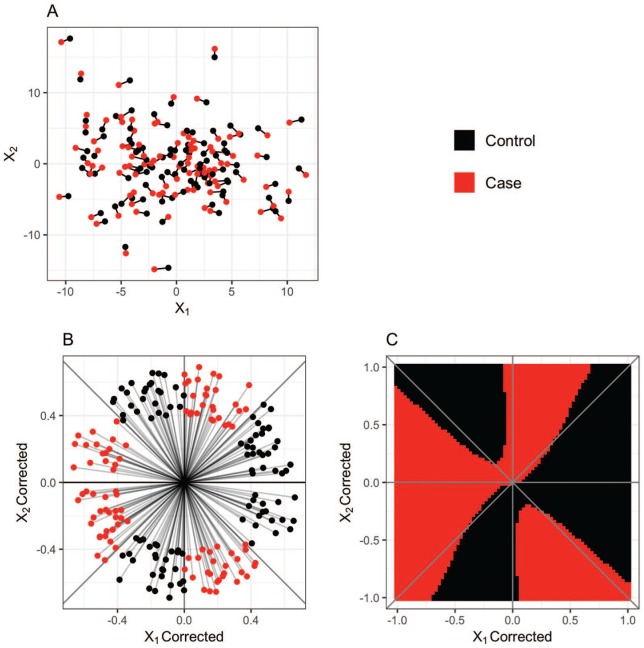
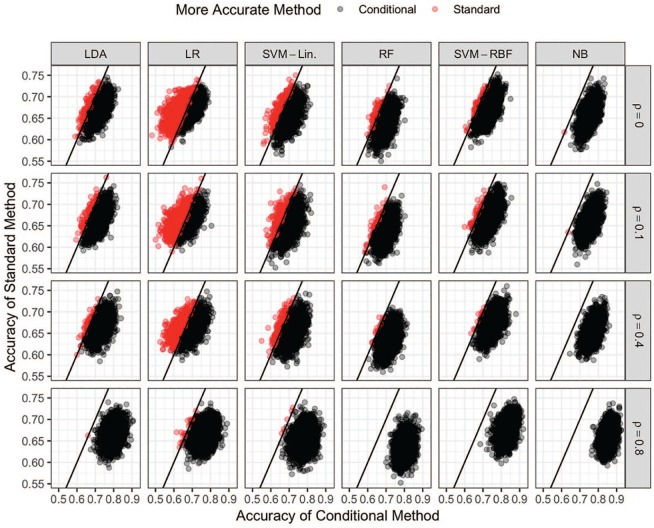
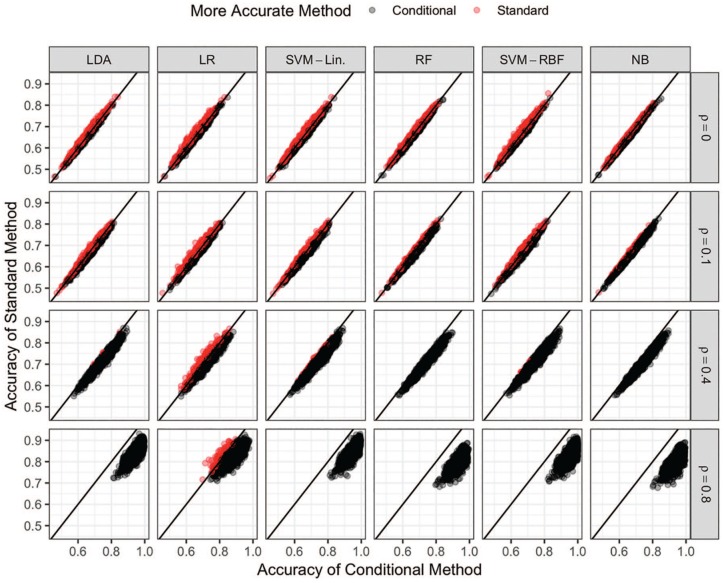
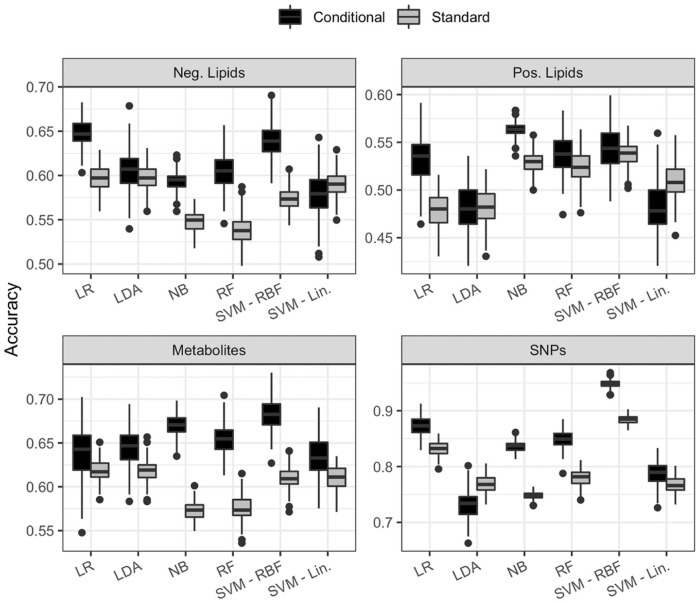
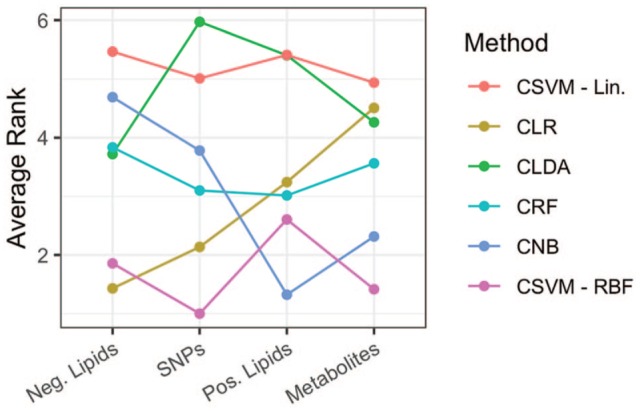
Classification is a common technique applied to 'omics data to build predictive models and identify potential markers of biomedical outcomes. Despite the prevalence of case-control studies, the number of classification methods available to analyze data generated by such studies is extremely limited. Conditional logistic regression is the most commonly used technique, but the associated modeling assumptions limit its ability to identify a large class of sufficiently complicated 'omic signatures. We propose a data preprocessing step which generalizes and makes any linear or nonlinear classification algorithm, even those typically not appropriate for matched design data, available to be used to model case-control data and identify relevant biomarkers in these study designs. We demonstrate on simulated case-control data that both the classification and variable selection accuracy of each method is improved after applying this processing step and that the proposed methods are comparable to or outperform existing variable selection methods. Finally, we demonstrate the impact of conditional classification algorithms on a large cohort study of children with islet autoimmunity.
Keywords: Diabetes; biomarker discovery; machine learning; support vector machines; variable selection.
Conflict of interest statement
Declaration of conflicting interests:The author(s) declared no potential conflicts of interest with respect to the research, authorship, and/or publication of this article.
Figures
References
-
- Adewale AJ, Dinu I, Yasui Y. Boosting for correlated binary classification. J Comput Graph Stat. 2010;19:140–153.
-
- Conway A, Rolley JX, Fulbrook P, Page K, Thompson DR. Improving statistical analysis of matched case–control studies. Res Nurs Health. 2013;36:320–324. - PubMed
-
- Breslow N, Day N, Halvorsen K, Prentice RL, Sabai C. Estimation of multiple relative risk functions in matched case-control studies. Am J Epidemiol. 1978;108:299–307. - PubMed
-
- Hogg T, Petkau J, Zhao Y, Gustafson P, Wijnands JM, Tremlett H. Bayesian analysis of pair-matched case-control studies subject to outcome misclassification. Stat Med. 2017;36:4196–4213. - PubMed
Grants and funding
- U01 DK063821/DK/NIDDK NIH HHS/United States
- UC4 DK063863/DK/NIDDK NIH HHS/United States
- HHSN267200700014C/DK/NIDDK NIH HHS/United States
- U01 DK063861/DK/NIDDK NIH HHS/United States
- U01 DK063790/DK/NIDDK NIH HHS/United States
- UL1 TR001082/TR/NCATS NIH HHS/United States
- UL1 TR000064/TR/NCATS NIH HHS/United States
- U01 DK063836/DK/NIDDK NIH HHS/United States
- U01 DK063829/DK/NIDDK NIH HHS/United States
- U01 DK063865/DK/NIDDK NIH HHS/United States
- UC4 DK095300/DK/NIDDK NIH HHS/United States
- UC4 DK063861/DK/NIDDK NIH HHS/United States
- UC4 DK063829/DK/NIDDK NIH HHS/United States
- UC4 DK063821/DK/NIDDK NIH HHS/United States
- UC4 DK117483/DK/NIDDK NIH HHS/United States
- UC4 DK063836/DK/NIDDK NIH HHS/United States
- UC4 DK112243/DK/NIDDK NIH HHS/United States
- UC4 DK063865/DK/NIDDK NIH HHS/United States
- U01 DK063863/DK/NIDDK NIH HHS/United States
- UC4 DK106955/DK/NIDDK NIH HHS/United States
- UC4 DK100238/DK/NIDDK NIH HHS/United States
LinkOut - more resources
Full Text Sources
