

How do age and major risk factors for mortality interact over the life-course? Implications for health disparities research and public health policy
- PMID: 31321279
- PMCID: PMC6612923
- DOI: 10.1016/j.ssmph.2019.100438
How do age and major risk factors for mortality interact over the life-course? Implications for health disparities research and public health policy
Erratum in
-
Erratum regarding missing Declaration of Competing Interest statements in previously published articles.SSM Popul Health. 2020 Dec 10;12:100714. doi: 10.1016/j.ssmph.2020.100714. eCollection 2020 Dec. SSM Popul Health. 2020. PMID: 33381636 Free PMC article.
Abstract
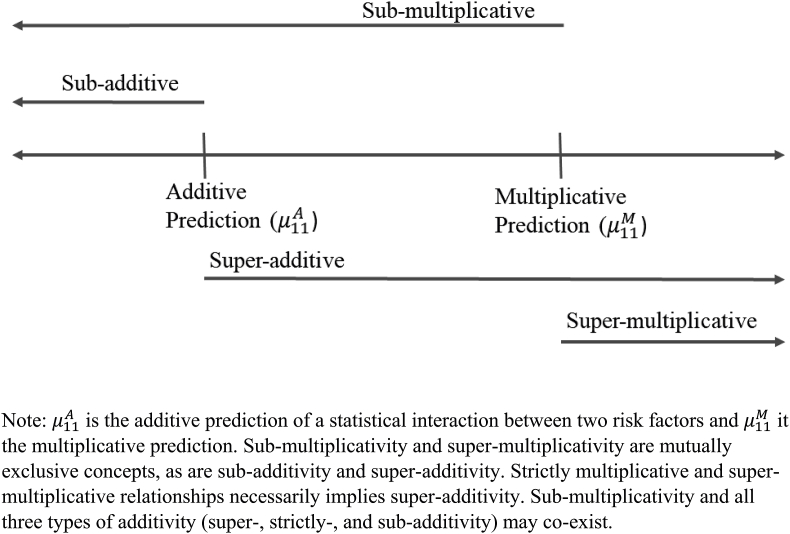
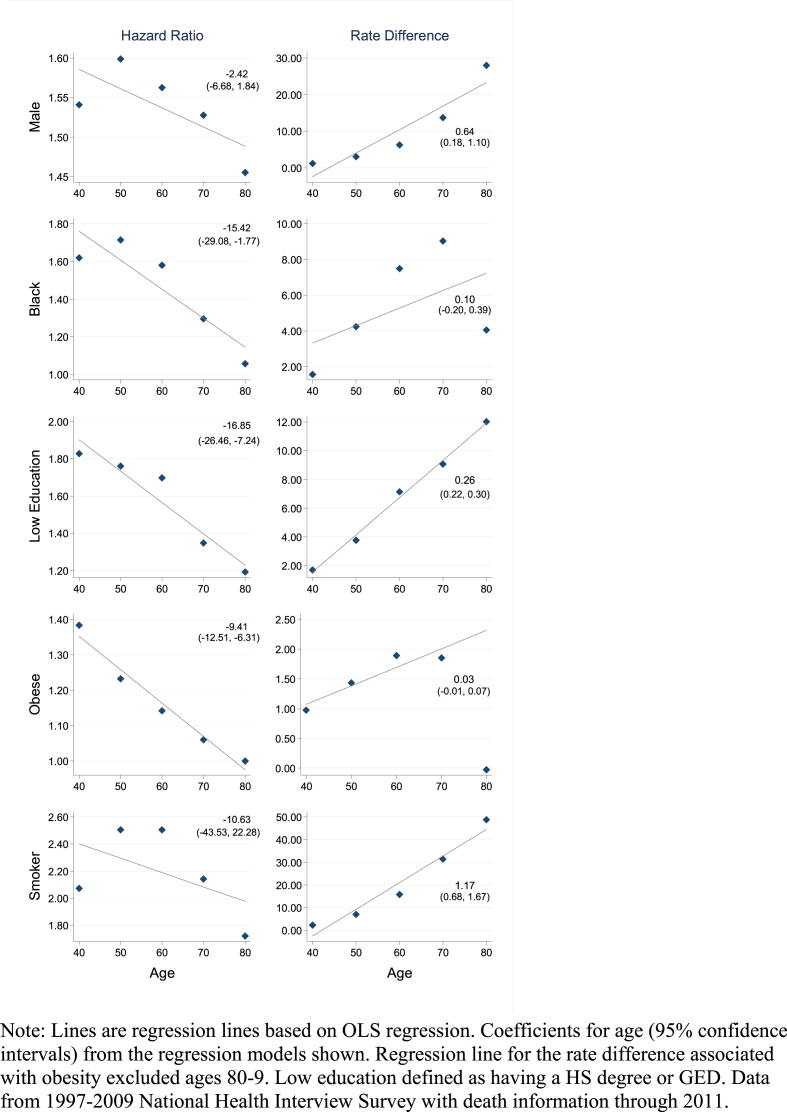
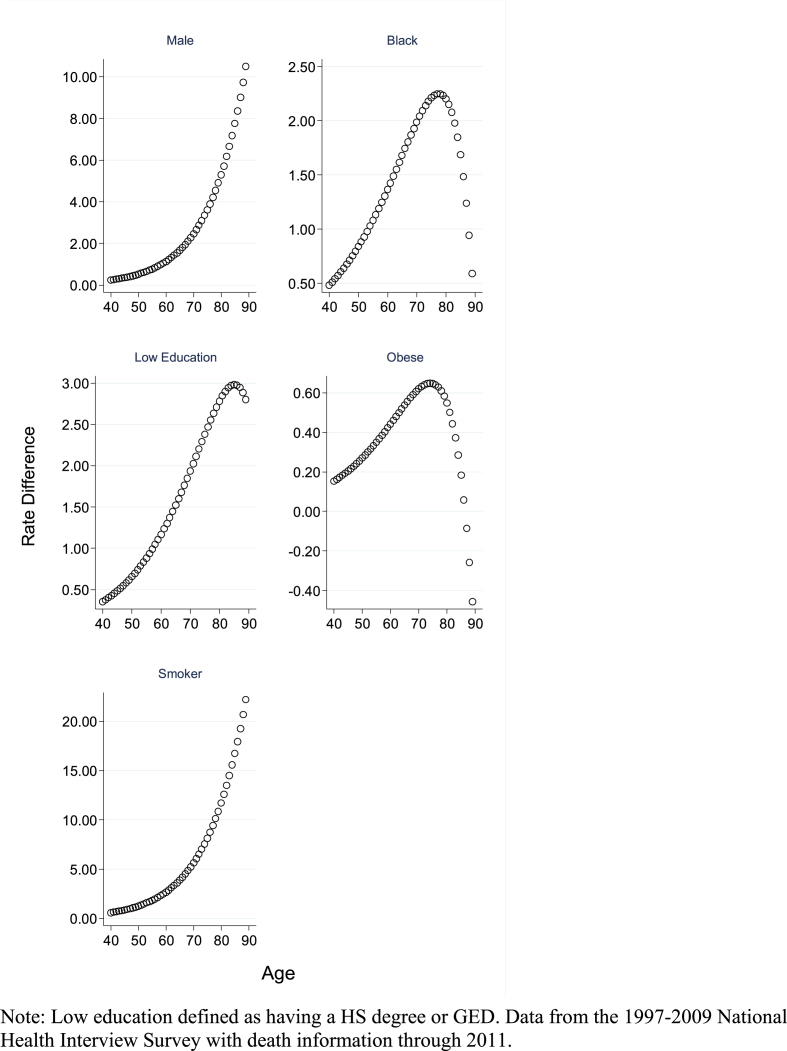
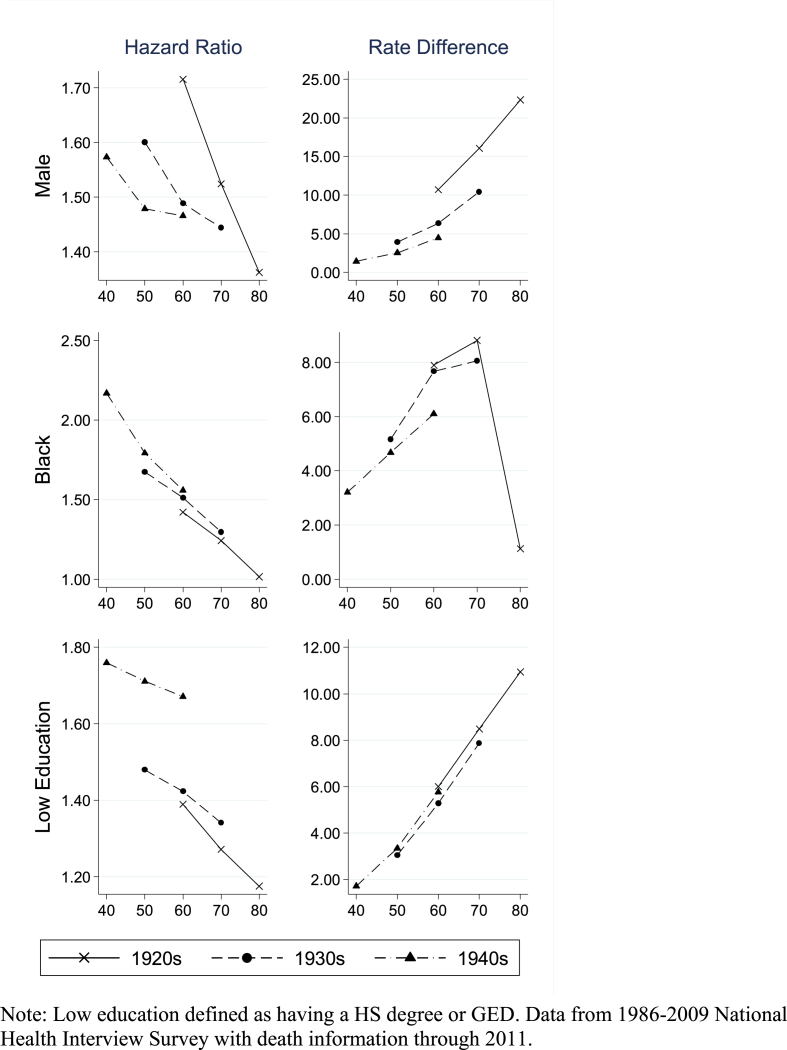
A critical question in life-course research is whether the relationship between a risk factor and mortality strengthens, weakens, or remains constant with age. The objective of this paper is to shed light on the importance of measurement scale in examining this question. Many studies address this question solely on the multiplicative (relative) scale and report that the hazard ratio of dying associated with a risk factor declines with age. A wide set of risk factors have been shown to conform to this pattern including those that are socioeconomic, behavioral, and physiological in nature. Drawing from well-known principles on interpreting statistical interactions, we show that evaluations on the additive (absolute) scale often lead to a different set of conclusions about how the association between a risk factor and mortality changes with age than interpretations on the multiplicative scale. We show that on the additive scale the excess death risks posed by key socio-demographic and behavioral risk factors increase with age. Studies have not generally recognized the additive interpretation, but it has relevancy for testing life-course theories and informing public health interventions. We discuss these implications and provide general guidance on choosing a scale. Data from the U.S. National Health Interview Survey are used to provide empirical support.
Keywords: Health inequalities; Life-course; Mortality; Obesity; Smoking; Socioeconomic status; Statistical interaction.
Figures
References
-
- Brown G.W. Statistical interaction and the role of social factors in the aetiology of clinical depression. Sociology. 1986;20:601–606. doi: 10.1177/0038038586020004009. - DOI
Grants and funding
LinkOut - more resources
Full Text Sources
