. 2019 Nov 1;317(5):E879-E898.
doi: 10.1152/ajpendo.00065.2019. Epub 2019 Jul 19.

Mechanistic inferences on metabolic dysfunction in posttraumatic stress disorder from an integrated model and multiomic analysis: role of glucocorticoid receptor sensitivity

Affiliations

Mechanistic inferences on metabolic dysfunction in posttraumatic stress disorder from an integrated model and multiomic analysis: role of glucocorticoid receptor sensitivity

Pramod R Somvanshi et al. Am J Physiol Endocrinol Metab. .

Abstract

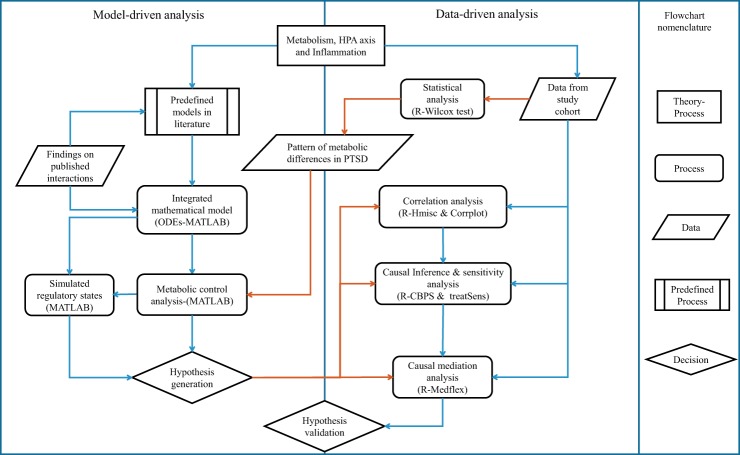
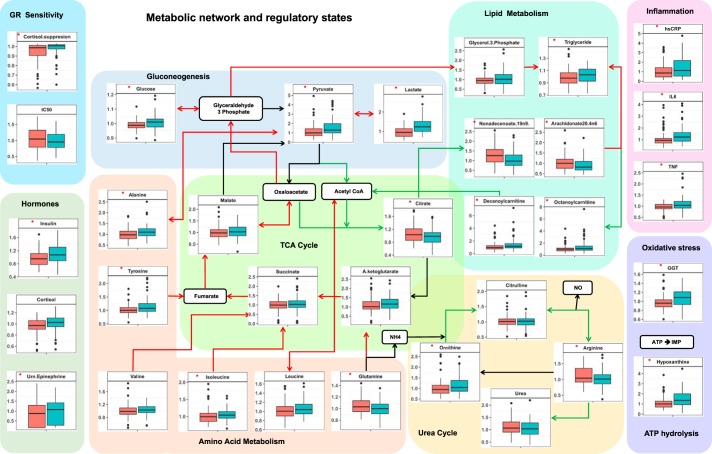
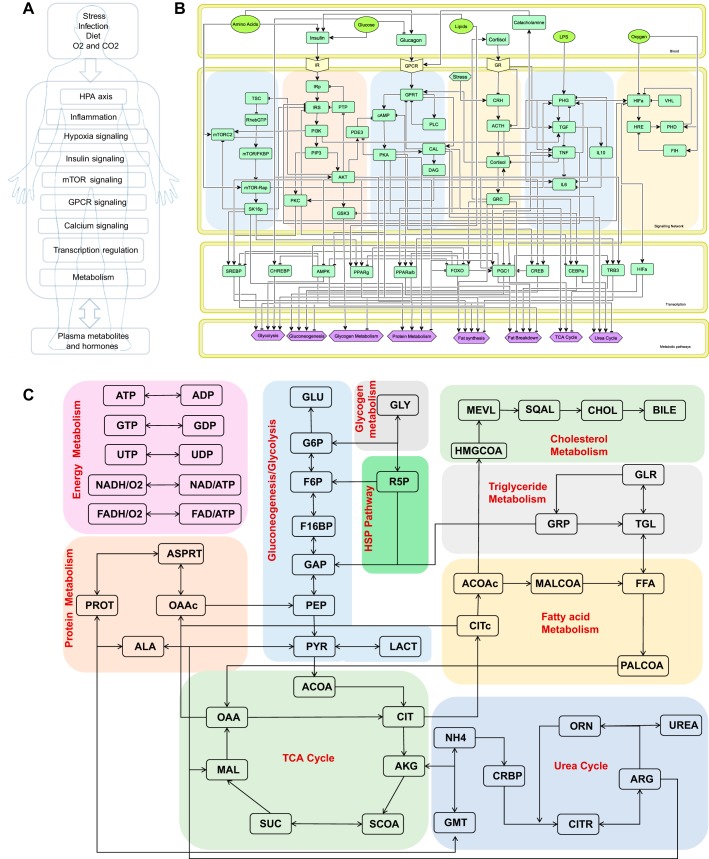
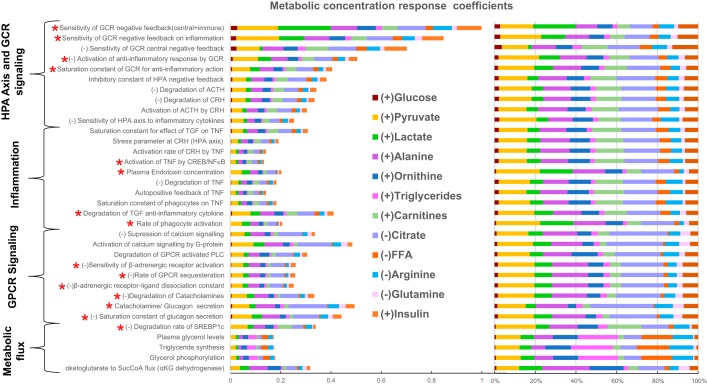
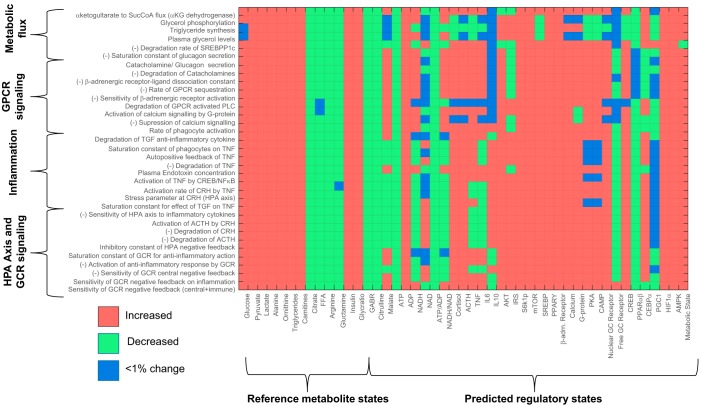
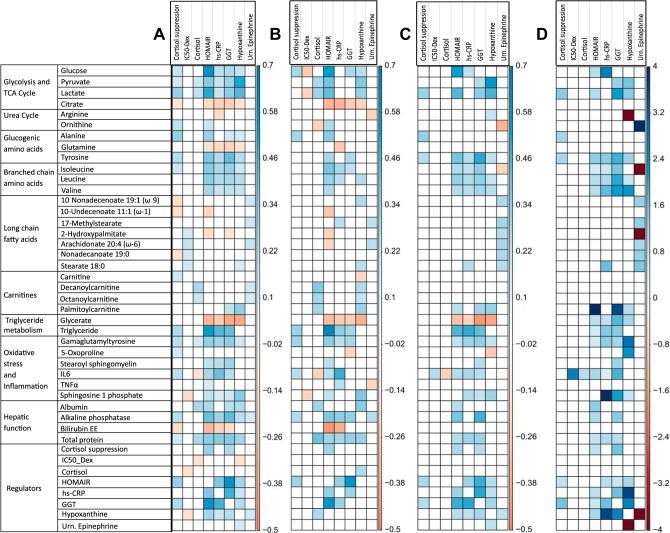
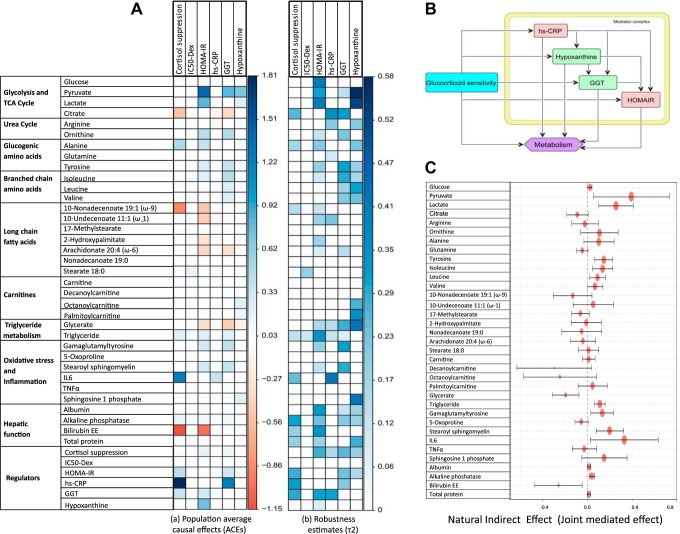
Posttraumatic stress disorder (PTSD) is associated with neuroendocrine alterations and metabolic abnormalities; however, how metabolism is affected by neuroendocrine disturbances is unclear. The data from combat-exposed veterans with PTSD show increased glycolysis to lactate flux, reduced TCA cycle flux, impaired amino acid and lipid metabolism, insulin resistance, inflammation, and hypersensitive hypothalamic-pituitary-adrenal (HPA) axis. To analyze whether the co-occurrence of multiple metabolic abnormalities is independent or arises from an underlying regulatory defect, we employed a systems biological approach using an integrated mathematical model and multiomic analysis. The models for hepatic metabolism, HPA axis, inflammation, and regulatory signaling were integrated to perform metabolic control analysis (MCA) with respect to the observations from our clinical data. We combined the metabolomics, neuroendocrine, clinical laboratory, and cytokine data from combat-exposed veterans with and without PTSD to characterize the differences in regulatory effects. MCA revealed mechanistic association of the HPA axis and inflammation with metabolic dysfunction consistent with PTSD. This was supported by the data using correlational and causal analysis that revealed significant associations between cortisol suppression, high-sensitivity C-reactive protein, homeostatic model assessment of insulin resistance, γ-glutamyltransferase, hypoxanthine, and several metabolites. Causal mediation analysis indicates that the effects of enhanced glucocorticoid receptor sensitivity (GRS) on glycolytic pathway, gluconeogenic and branched-chain amino acids, triglycerides, and hepatic function are jointly mediated by inflammation, insulin resistance, oxidative stress, and energy deficit. Our analysis suggests that the interventions to normalize GRS and inflammation may help to manage features of metabolic dysfunction in PTSD.

Keywords: HPA axis; PTSD; glucocorticoid signaling; mathematical modeling; neuroendocrine.


Conflict of interest statement

No conflicts of interest, financial or otherwise, are declared by the authors.

Figures

Fig. 1.
Fig. 1.
Process flowchart representing an outline of the steps that were implemented in the analysis presented in the paper. Published mathematical models for metabolism, hypothalamic-pituitary-adrenal (HPA) axis, inflammation, and hypoxia signaling were integrated into a single composite model based on the data reported in literature. Model was recalibrated, and metabolic control analysis (MCA) was performed to obtain metabolite concentration response coefficients (MCRCs) and associated regulatory states with reference to the pattern of statistically different metabolites in subjects with posttraumatic stress disorder (PTSD). Orange arrows represent flow of data from statistics to model analysis and causal inference. Response coefficients were used to generate hypothesis on the potential process that could be affected in PTSD. To validate the hypotheses, correlation analysis followed by causal inference and mediation analysis were performed using estimation of propensity scores and average causal effects, sensitivity analysis, and natural effects models. CBPS, covariate balancing propensity scores; ODEs, ordinary differential equations.
Fig. 2.
Fig. 2.
Box plot representation of metabolite differences in controls and posttraumatic stress disorder (PTSD). Red arrows represent the upregulated fluxes, and green arrows represent downregulated metabolic fluxes. Side panels represent differences in metabolic regulatory hormones, tests for glucocorticoid receptor (GR) sensitivity, and markers for inflammation, oxidative stress, and ATP hydrolysis. Red asterisks on the box plots represent the statistically significant difference (P < 0.05) in PTSD vs. controls. Green box, PTSD; red box, controls. It is noted that gluconeogenesis potentially in liver, hypoxic adaptation potentially in muscle, amino acid catabolism, triglyceride synthesis, and ATP hydrolysis are upregulated, whereas urea cycle, lipogenesis, and β-oxidation are downregulated. Measures of GR sensitivity, inflammation, and oxidative stress and the hormones insulin, cortisol, and urinary (Urn.) epinephrine are also elevated in PTSD. GGT, γ-glutamyltransferase; hsCRP, high-sensitivity C-reactive protein.
Fig. 3.
Fig. 3.
A: schematic of the components of the integrated model. B: regulatory network representing 6 signaling pathways, 10 transcription factors, and the metabolic processes that are regulated by the network. Network comprises 1) mammalian target of rapamycin (mTOR) pathway, 2) insulin signaling pathway, 3) G protein-coupled receptor (GPCR) signaling pathway, 4) hypothalamic-pituitary-adrenal (HPA) axis, 5) inflammatory signaling, and 6) hypoxia signaling. These signaling pathways interact to activate downstream transcription regulatory network as shown in the transcription factor compartment. Signaling and transcription network collectively influence metabolic processes as represented in the metabolic pathways compartment. C: metabolic pathways coded in the metabolic simulator. Model constitutes glycolysis, gluconeogenesis, TCA cycle, urea cycle, lipogenesis, amino acid metabolism, hexose amine pathway, pentose phosphate pathway, oxidative phosphorylation, cholesterol pathway, and plasma metabolite fluxes. This model is further integrated with regulations from the regulatory network. ACOAc, acetyl Co-enzyme A (cytosolic); ADP, adenosine diphosphate; AKG, alpha-ketoglutarate; ALA, alanine; ARG, arginine; ASPRT, aspartate; ATP, adenosine triphosphate; CHOL, cholesterol; CIT, citrate; CITc, citrate (cytosolic); CITR, citrulline; CRBP, carbamoyl phosphate; F16BP, fructose-1-6-biphosphate; F6P, fructose-6-phosphate; FAD, flavin adenine dineucleotide; FFA, free fatty acids; GAP, glyceraldehyde phosphate; GDP, guanosine diphosphate; GLR, glycerol; TGL, triglycerides; GLU, glucose; G6P, glucose-6-phosphate; GLY, glycogen; GMT, glutamine; GRP, glycerol-3-phosphate; GTP, guanosine triphosphate; HMGCOA, β-hydroxy-β-methylglutaryl-CoA; LACT, lactate; MAL, malate; MALCOA, malonyl co-enzyme A; MEVL, mevelonate; NAD, nicotinamide adenine dinucleotide; NADP, nicotinamide denine dinucleotide phosphate; NH4, ammonia; OAA, oxaloacetic acid; OAAc, oxaloacetic acid (cytosolic); ORN, ornithine; PALCOA, palmitoyl co-enzyme A; PEP, phopsphoenoyl pyruvate; PROT, protein; PYR, pyruvate; R5P, ribose-5-phosphate; SCOA, succinyl Co-enzyme A; SQAL, squalene; SUC, succinate; UDP, uridine diphosphate; UTP, uridine triphosphate.
Fig. 4.
Fig. 4.
Plot represents the result of metabolic control analysis: 34 model parameters that elicited the metabolic signature as observed in subjects with posttraumatic stress disorder along with their mean cumulative metabolic concentration response coefficient measured across 12 metabolites with ≥0.1 mean cumulative metabolite concentration response coefficient. Sign (±) in prefix of the parameters represents the direction of change that yielded the metabolic dysfunction signature. These parameters belong to the hypothalamic-pituitary-adrenal (HPA)-axis and glucocorticoid receptor (GCR) signaling, G protein-coupled receptor (GPCR) signaling, inflammation, and metabolic fluxes for triglyceride synthesis, plasma lactate, and amino acid levels (Supplemental Table S5). Red asterisk at the prefix of the labels indicates the parameters that were selected when additionally accounted for group differences in cortisol, ACTH, IL6, and TNF along with the 12 metabolites. Colors in the bars code for the fraction of the response coefficients corresponding to each metabolite. It is noted that citrate and pyruvate were mostly affected by these parameters contributing to ~40% of the total effect per parameter followed by the effect on amino acid (alanine and glutamine) concentration (~15%), lipid metabolite (carnitine, fatty acids, and triglycerides) concentration (~15%), urea cycle metabolites (~15%), and glucose, lactate, and insulin together (~15%). CREB, cAMP response element-binding; CRH, corticotropin-releasing hormone; FFA, free fatty acid; SREBP1c, sterol regulatory element-binding protein 1c; TGF, transforming growth factor.
Fig. 5.
Fig. 5.
Matrix representation of the changes in the states of metabolite and regulatory component with respect to reference state for perturbation in the 34 parameter, identified through metabolic control analysis. States are coded as either increased (red) or decreased (green) and <1% change (blue) per cell corresponding to the parameter-state combination. It can be noted that the trends in reference metabolites (metabolic dysfunction signature observed in posttraumatic stress disorder) are replicated for the parameters on y-axis. Predicted states of other regulatory components corresponding to these parameter perturbations are shown appended to reference metabolites. It is noted that G protein-coupled receptor (GPCR) pathway and glucocorticoid (GC) receptor (GCR) nuclear translocation are upregulated for most parameters along with an upregulation of catabolic state. ATP-to-ADP ratio is also reduced for all of the parameter perturbation along with upregulation of cAMP response element-binding (CREB), AMP-activated protein kinase (AMPK), and hypoxia-inducible factor 1α (HIF1α). Net catabolic state can be observed (last column: metabolic state) for all of the 34 parameter perturbations. β-adrn., β-Adrenergic; CEBPα, CCAAT/enhancer-binding protein-α; CRH, corticotropin-releasing hormone; FFA, free fatty acid; GABR (global arginine bioavailability ratio), arginine/(ornithine + citrulline); Glycratio (glycolytic ratio), (pyruvate + lactate)/citrate; HPA, hypothalamic-pituitary-adrenal; IRS, insulin receptor substrate; mTOR, mammalian target of rapamycin; PGC1, peroxisome proliferator-activated receptor-γ coactivator 1; PPARγ, peroxisome proliferator-activated receptor-γ; S6k1p, phosphorylated ribosomal protein S6 kinase; SREBP1c, sterol regulatory element-binding protein 1c; TGF, transforming growth factor.
Fig. 6.
Fig. 6.
Correlation plot for regulatory components with respect to metabolites in entire cohort (A), controls (B), subjects with posttraumatic stress disorder (PTSD; C), and fold change in correlations with respect to correlations in controls (the fold changes >4 are capped at 4; D). Correlations are shown for the statistically significant correlations (P < 0.05; Supplemental Table S6). It is observed that across the correlation plots AC, significant correlations are conserved for the cross-correlations between homeostatic model assessment of insulin resistance (HOMAIR), γ-glutamyltransferase (GGT), high-sensitivity C-reactive protein (hs-CRP), hypoxanthine and glycolytic metabolites, amino acid metabolites, and triglyceride metabolites. On the fold change plot, it is noted around 2- to 4-fold higher correlations in subjects with PTSD between GGT, hs-CRP, hypoxanthine, and HOMAIR, indicating stronger association between oxidative stress, inflammation, and insulin resistance, along with similar level of increase in correlation between regulatory components and metabolites except for fatty acids. There is a notable increase in association between cortisol suppression and citrate, alanine, tyrosine, HOMAIR, and GGT. Dex, dexamethasone; Urn., urinary.
Fig. 7.
Fig. 7.
A: plots for average causal estimates (ACEs) for regulatory components on metabolites (left). Right shows the robustness estimates obtained through sensitivity analysis. ACEs are shown for the statistically significant effects (P < 0.05; Supplemental Table S7). Cortisol suppression (CS) shows negative effect on citrate, bilirubin, and nonadecanoate but positive effect on triglycerides, IL6, alkaline phosphatase, plasma proteins, homeostatic model assessment of insulin resistance (HOMA-IR), γ-glutamyltransferase (GGT), and high-sensitivity C-reactive protein (hs-CRP). HOMA-IR shows an identical effect to metabolic dysfunction (MD) signature for glycolytic metabolites, amino acids, fatty acids, CS, GGT, and hypoxanthine along with hepatic function. hs-CRP shows a negative association with citrate, glutamine, undecenoate, and glycerate and a positive effect on IL6, CS, triglyceride, and GGT. GGT shows a causal effect identical to the MD signature for pyruvate and citrate, ornithine, amino acids, triglycerides, stearoyl sphingomyelin and γ-glutamyltyrosine, hepatic function components, CS, HOMA-IR, and hs-CRP. Hypoxanthine corroborates with several features of MD signature: pyruvate, lactate, amino acids, carnitines, and HOMA-IR along with glycerate, sphingosine 1 phosphate, hepatic function, and CS. B: causal graph used to test for mediation hypothesis of the effect of GRS measured by dexamethasone (Dex) suppression test (DST). Mediator complex of hs-CRP, hypoxanthine, GGT, and HOMA-IR was considered as the joint mediators. C: forest plot representation of the natural indirect effects (joint-mediated effects) of increased GC feedback sensitivity (measured by cortisol suppression test) on 35 metabolites for the causal hypothesis tested on the entire cohort adjusting for the group effects (Supplemental Table S8). Error bar represents 95% confidence intervals of the point estimates of the effects. It is noted that the joint-mediated effects on pyruvate, lactate, citrate, gluconeogenic and branched-chain amino acids, oxidative stress, inflammation, and hepatic function components are statistically significant.

References

    1. American Psychiatric Association Diagnostic and Statistical Manual of Mental Disorders (5th ed.). Washington, DC: American Psychiatric Association, 2013. doi:10.1176/appi.books.9780890425596. - DOI
    1. Apostolopoulou M, Gordillo R, Koliaki C, Gancheva S, Jelenik T, De Filippo E, Herder C, Markgraf D, Jankowiak F, Esposito I, Schlensak M, Scherer PE, Roden M. Specific hepatic sphingolipids relate to insulin resistance, oxidative stress, and inflammation in nonalcoholic steatohepatitis. Diabetes Care 41: 1235–1243, 2018. doi:10.2337/dc17-1318. - DOI - PubMed
    1. Bangsgaard EO, Hjorth PG, Olufsen MS, Mehlsen J, Ottesen JT. Integrated inflammatory stress (ITIS) model. Bull Math Biol 79: 1487–1509, 2017. doi:10.1007/s11538-017-0293-2. - DOI - PubMed
    1. Bartels K, Grenz A, Eltzschig HK. Hypoxia and inflammation are two sides of the same coin. Proc Natl Acad Sci USA 110: 18351–18352, 2013. doi:10.1073/pnas.1318345110. - DOI - PMC - PubMed
    1. Bersani FS, Morley C, Lindqvist D, Epel ES, Picard M, Yehuda R, Flory J, Bierer LM, Makotkine I, Abu-Amara D, Coy M, Reus VI, Lin J, Blackburn EH, Marmar C, Wolkowitz OM, Mellon SH. Mitochondrial DNA copy number is reduced in male combat veterans with PTSD. Prog Neuropsychopharmacol Biol Psychiatry 64: 10–17, 2016. doi:10.1016/j.pnpbp.2015.06.012. - DOI - PubMed