. 2019 Sep 10:309:289-301.
doi: 10.1016/j.jconrel.2019.07.019. Epub 2019 Jul 16.

Noninvasive characterization of in situ forming implant diffusivity using diffusion-weighted MRI

Affiliations

Noninvasive characterization of in situ forming implant diffusivity using diffusion-weighted MRI

Kelsey A Hopkins et al. J Control Release. .

Abstract

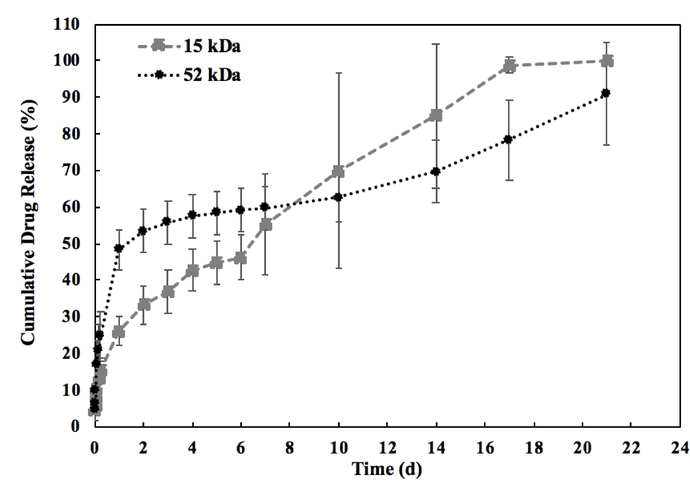
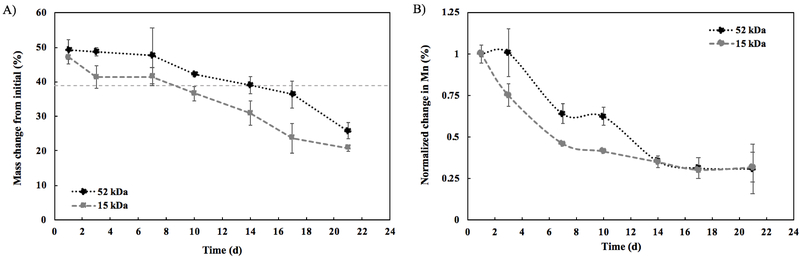
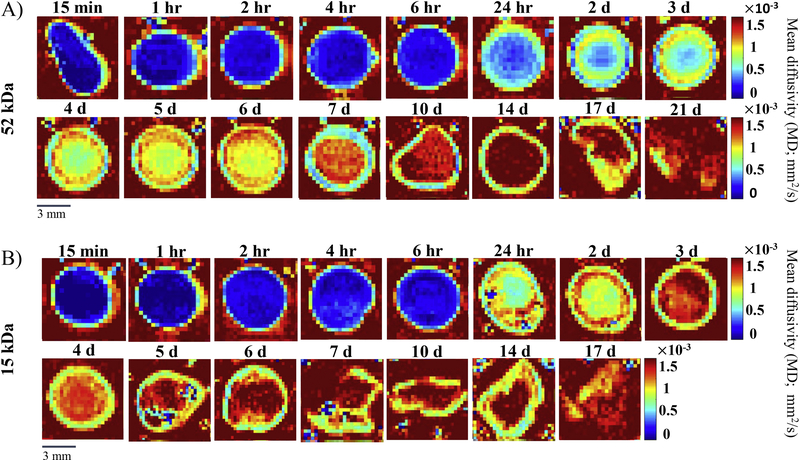
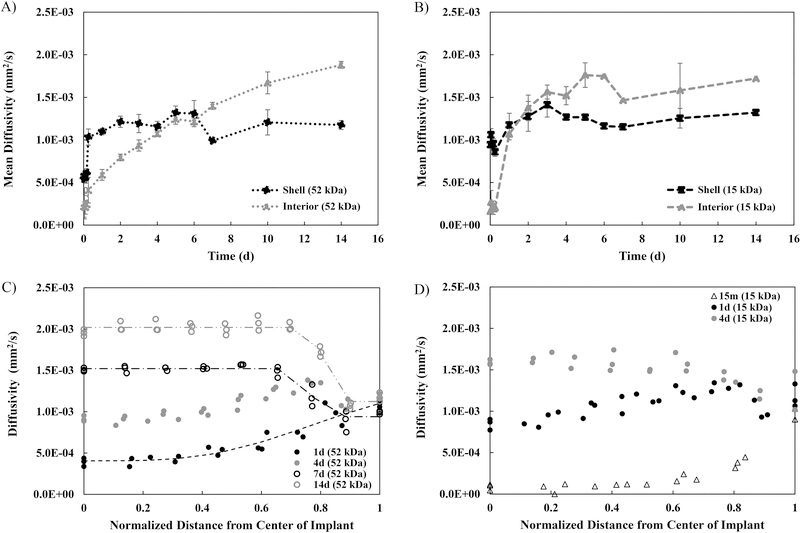
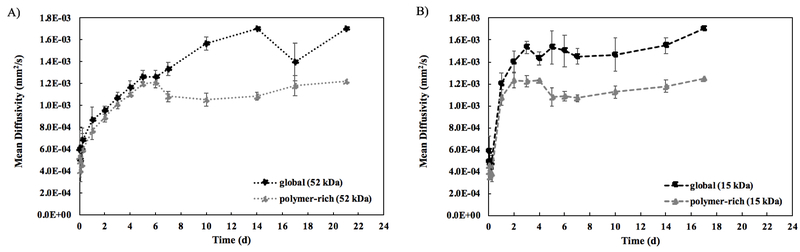
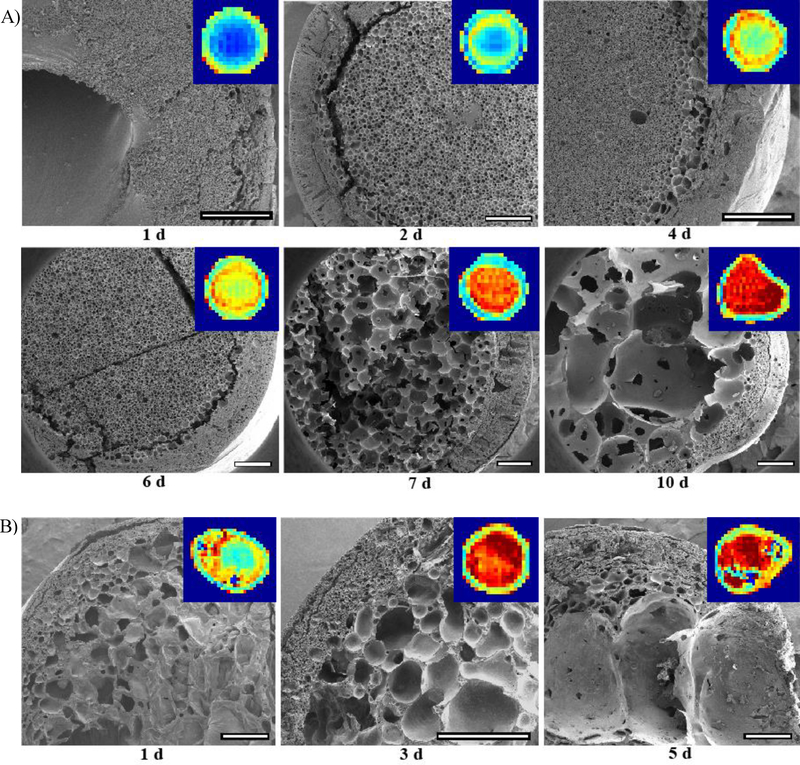
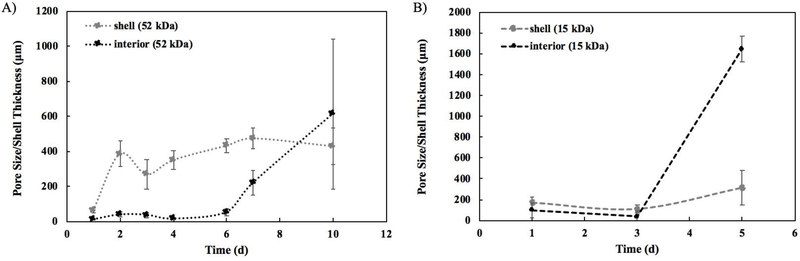
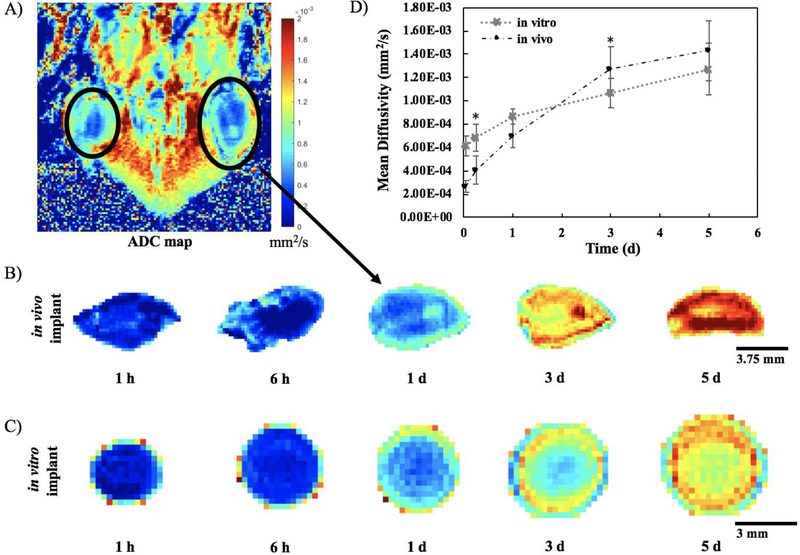
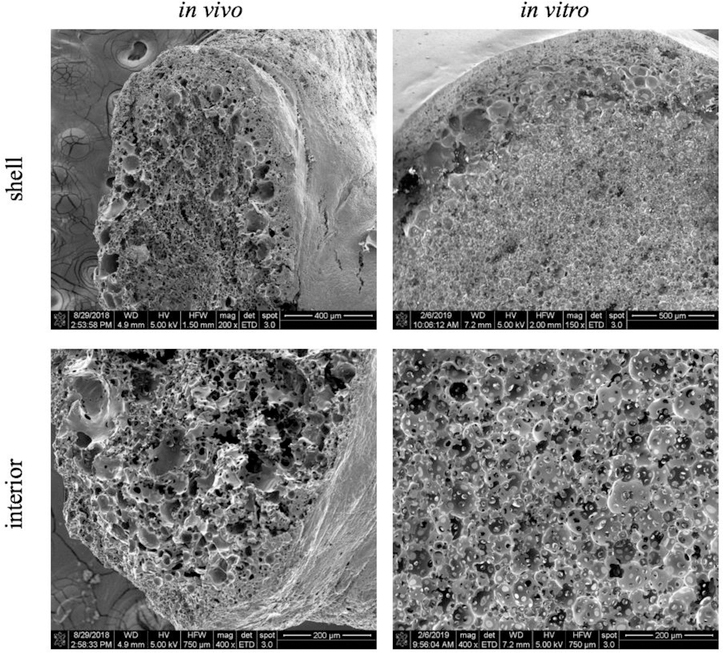
In situ forming implants (ISFIs) form a solid drug-eluting depot, releasing drug for an extended period of time after a minimally-invasive injection. Clinical use of ISFIs has been limited because many factors affect drug release kinetics. The aim of this study was to use diffusion-weighted MRI (DWI) to noninvasively quantify spatial-temporal changes in implant diffusivity in situ. ISFIs were formed using poly(lactic-co-glycolic) acid, with a molecular weight of either 15 kDa or 52 kDa, and fluorescein as the mock drug. Drug release, polymer erosion, polymer degradation, and implant diffusivity were analyzed in vitro over 21 days. DWI was also performed in vivo over 5 days. Spatial diffusivity maps of the implant were generated using DWI data. Results showed constant diffusivity at the implant shell ((1.17 ± 0.13) × 10-3 mm2/s) and increasing diffusivity within the interior over time (from (0.268 ± 0.081) × 10-3 mm2/s during day 1 to (1.88 ± 0.04) × 10-3 mm2/s at 14 d), which correlated with increasing porosity of the implant microstructure. Implants formed in vivo followed the same diffusivity trend as those in vitro. This study validates the use of DWI to provide novel functional information about implant behavior through its ability to noninvasively characterize transport properties within the implant both in vitro and in vivo.

Keywords: Controlled release; Diffusion-weighted imaging; Diffusivity; Drug delivery; MRI; in situ forming implants.


Conflict of interest statement

Declarations of interest: none

Figures

Figure 1:
Figure 1:. Cumulative mass release of fluorescein from the implants.
Release measured over 21 d with black circles indicating the 52 kDa implant and gray squares indicating the 15 kDa implant (n = 5, error bars are mean ± SD).
Figure 2:
Figure 2:. Polymer erosion and degradation.
A) Polymer erosion over 21 d (n = 3, errors bars are mean ± SD); 39% line represents the theoretical mass of polymer in the implant. B) Polymer degradation over 21 d (n = 3, errors bars are mean ± SD). Change in molecular weight reported using number average molecular weight (Mn) and normalized to the Mn of the implant at day 1. For both, black circles represent the 52 kDa implant and gray squares represent the 15 kDa implant.
Figure 3:
Figure 3:. Apparent diffusion coefficient (ADC) maps of a representative implant at each time point.
A) ADC maps of the 52 kDa implant over 21 d. B) ADC maps of the 15 kDa implants over 17 d. Red represents high diffusivity, while blue represents low diffusivity. A different implant was imaged at each timepoint. The full set of ADC maps can be found in the supplemental material (Supplemental Figure 2).
Figure 4:
Figure 4:. Spatial profiles of diffusivity from the ADC maps.
MD of the shell compared to the interior over 14 d for A) the 52 kDa implants and for B) the 15 kDa implants. Diffusivity as a function of distance from the center of the implant at selected timepoints for C) the 52 kDa implants and for D) the 15 kDa implants. For all, errors bars are mean ± SD. Sample size of n=3 except for the following implants due to implant degradation: 52 kDa 21d (n=1), 15 kDa 6d, 7d, 14d (n=2), and 15 kDa 17d (n=1).
Figure 5:
Figure 5:. Mean diffusivity calculations comparing MD calculated from entire implant (global) to MD obtained from thresholding out the water, leaving only polymer-rich domains (polymer-rich).
A) MD over 21 d for the 52 kDa implants. B) MD over 17 d for the 15 kDa implants. For all, errors bars are mean ± SD. Sample size of n=3 except for the following implants due to implant degradation: 52 kDa 21d (n=1), 15 kDa 6d, 7d, 14d (n=2), and 15 kDa 17d (n=1).
Figure 6:
Figure 6:. Comparison of ADC maps to implant microstructure.
SEM images inset with corresponding ADC map A) taken over 10 d for the 52 kDa implant and B) taken over 5 d for the 15 kDa implant. All scale bars are 500 μm.
Figure 7:
Figure 7:. Quantification of the pore diameter in the implant interior and quantification of shell thickness of the implants from the SEM images.
A) Analysis over 10 d for the 52 kDa implants. B) Analysis over 5 d for the 15 kDa implants. For all, errors bars are mean ± SD using samples taken from three separate regions of each image.
Figure 8:
Figure 8:. In vivo DWI analysis.
A) Representative ADC map from one slice through one mouse at 1 d. Top of the image is towards the head of the mouse and bottom of image is the tail. B) Representative in vivo implant isolated from the ADC maps at each timepoint. C) Representative in vitro implant isolated from the ADC maps at the same timepoints for comparison. D) Mean Diffusivity (MD) over 5 d comparing implants formed in vivo (n=6) versus those formed in vitro (n=3). (errors bars are mean ± SD). * indicates p < 0.05
Figure 9:
Figure 9:. Comparison of implant microstructure in vivo versus in vitro.
SEM images taken of the implant after the final 5d timepoint in vivo compared to an in vitro 5 d timepoint.

References

    1. Wertheimer A, Santella T, Finestone A, Levy R. Clinical and Economic Advantages of Modern Dosage Forms: Improving Medication Adherence [Internet]. Npcnow.org. 2006. [cited 2018 Nov 4]. Available from: https://www.npcnow.org/system/files/research/download/Clinical-and-Econo...
    1. Brown MT, Bussell JK, Medication Adherence: WHO Cares?, Mayo Clinic Proceedings, 86 (2011) 304–314. - PMC - PubMed
    1. Jimmy B, Jose J, Patient Medication Adherence: Measures in Daily Practice, Oman Medical Journal, 26 (2011) 155–159. - PMC - PubMed
    1. Dunn R, English J, Cowsar D, Vanderbilt D. Biodegradable in-situ forming implants and methods of producing the same. USA; US4938763A, 1988.
    1. Anselmo AC, Mitragotri S, An overview of clinical and commercial impact of drug delivery systems, Journal of controlled release: official journal of the Controlled Release Society, 190 (2014) 15–28. - PMC - PubMed

Publication types

MeSH terms