Review
. 2019 Jul 18;11(7):351.
doi: 10.3390/pharmaceutics11070351.

Evolution from Covalent to Self-Assembled PAMAM-Based Dendrimers as Nanovectors for siRNA Delivery in Cancer by Coupled In Silico-Experimental Studies. Part I: Covalent siRNA Nanocarriers

Affiliations
Review

Evolution from Covalent to Self-Assembled PAMAM-Based Dendrimers as Nanovectors for siRNA Delivery in Cancer by Coupled In Silico-Experimental Studies. Part I: Covalent siRNA Nanocarriers

Domenico Marson et al. Pharmaceutics. .

Abstract

Small interfering RNAs (siRNAs) represent a new approach towards the inhibition of gene expression; as such, they have rapidly emerged as promising therapeutics for a plethora of important human pathologies including cancer, cardiovascular diseases, and other disorders of a genetic etiology. However, the clinical translation of RNA interference (RNAi) requires safe and efficient vectors for siRNA delivery into cells. Dendrimers are attractive nanovectors to serve this purpose, as they present a unique, well-defined architecture and exhibit cooperative and multivalent effects at the nanoscale. This short review presents a brief introduction to RNAi-based therapeutics, the advantages offered by dendrimers as siRNA nanocarriers, and the remarkable results we achieved with bio-inspired, structurally flexible covalent dendrimers. In the companion paper, we next report our recent efforts in designing, characterizing and testing a series of self-assembled amphiphilic dendrimers and their related structural alterations to achieve unprecedented efficient siRNA delivery both in vitro and in vivo.

Keywords: PAMAM dendrimers; RNAi therapeutics; covalent dendrimers; gene silencing; nanovectors; siRNA delivery.


Conflict of interest statement

The authors declare no conflict of interest.

Figures

Figure 1
Figure 1
(a) Cartoon representation of a dendrimer structure highlighting its three, distinct structural motifs: The core (in light blue), the branching units forming the different G generations (in light green), and the terminal groups (in light pink). According to a consolidate dendrimer nomenclature, the core constitutes Generation 0 (G0). Therefore, the subsequent Generations G1, G2, … Gn refer to the corresponding level of branching, as annotated in panel (a). (b) Molecular structure of the triethanolamine (TEA)-core poly(amidoamine) dendrimers. For clarity, in panel (b), only a dendrimer of Generation 4 (G4) is shown.
Figure 2
Figure 2
Equilibrated molecular dynamics conformations of G5 TEA-core (a) and NH3-core (b) poly(amidoamine) (PAMAM) dendrimers in physiological solution (pH = 7.4, ionic strength = 0.15 M NaCl). Each dendrimer molecule is represented as colored sticks, some ions and counterions are visualized as purple (Na+) and green (Cl) spheres, and water molecules are not shown for clarity. Average radial monomer density ρ(r) for subsequent generations (from G0 to G5) of the TEA-core (c) and the NH3-core PAMAMs (d). In all cases, the origin was set at the molecular center of mass. Adapted from [37], published by RSC, 2013.
Figure 3
Figure 3
Equilibrated molecular dynamics conformations of G5 TEA-core (a) and NH3-core (b) PAMAM dendrimers in complex with Hsp27 siRNA in physiological solution (pH = 7.4, ionic strength = 0.15 M NaCl). Each dendrimer molecule is represented as colored sticks, some ions and counterions are visualized as light pink (Na+) and light green (Cl) spheres, the siRNAs are portrayed as light blue ribbons, and water molecules are not shown for clarity. Radial density distribution ρ(r) of the dendrimer terminal nitrogen atoms in G5 TEA-core (c) and NH3-core (d) PAMAMs in complex with Hsp27 siRNA (continuous lines). The corresponding distributions of the siRNA phosphorous atoms in each siRNA/dendrimer complex are shown as dashed lines. Adapted from [35,36] with permission of John Wiley and Sons and Bentham Science Publishers.
Figure 4
Figure 4
Three-dimensional atomic force microscopy (AFM) images of (a) Hsp27 siRNA in complex with TEA-core PAMAM dendrimers of increasing generation (G1G7) and (b) a single spherical siRNA/TEA-core dendrimer (G7) complex at a final siRNA concentration of 0.0125 mg/L and at a dendrimer-to-siRNA charge ratio (N/P) of 10. (c) Gel retardation of Hsp27 siRNA with three different TEA-core PAMAMs ((G1) (a), (G4) (b) and (G7) (c)) as a function of the N/P ratio (from 10/1 to 1/10 from left to right; last lane: Naked siRNA). Adapted from [41] with the permission of the RSC.
Figure 5
Figure 5
(a) Confocal fluorescence imaging of G7 TEA-core dendrimer-mediated cellular uptake of siRNA using a non-silencing siRNA sequence labeled with the green fluorescent dye Alexa 488. (b) Blue fluorescence images of a nucleus of the same cells stained by TOPRO-3. (c) Merged fluorescent images of a and b confirming the exclusive cytoplasm localization of the dendrimer/siRNA complexes. Adapted from [42] with permission of John Wiley and Sons.
Figure 6
Figure 6
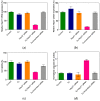
Quantitative analysis of (a) Hsp27 mRNA levels (determined by quantitative reverse transcription polymerase chain reaction (RT-qPCR)), (b) Hsp27 protein expression (determined by western blot analysis), (c) cell proliferation (determined by the 3-(4,5-dimethylthiazol-2-yl)-2,5-diphenyl tetrazolium bromide (MTT) assay), and (d) caspase-3/7 activity (measured by a colorimetric assay) in prostate cancer-3 (PC-3) cells three days after the TEA-core G7-mediated delivery of 50 nM Hsp27-targeting siRNA (N/P = 10) (hot pink bars in all panels). Data for dendrimer G7 alone (blue bars), naked Hsp27 siRNA (orange bars), and scrambled siRNA–G7 complexes (gray bars) are shown for comparison. Values are expressed as % relative to control (non-treated cells, green bars). Adapted from [42] with permission of John Wiley and Sons.
Figure 7
Figure 7
(a) Effect of N/P ratio on Hsp27 gene silencing, (b) inhibition of cell growth, and (c) caspase-3/7 activity in PC-3 cells three days after TEA-core G7-mediated delivery of 50 nM Hsp27-targeting siRNA in the presence of 10% serum (hot pink bars in all panels). Data for scrambled siRNA–G7 complexes (gray bars) are shown for comparison. Values are expressed as % relative to control (non-treated cells, green bars). Adapted from [42], with permission of John Wiley and Sons.
Figure 8
Figure 8
(a) Simulation of G6 TEA-core PAMAM dendrimers in complex with AKT siRNA at N/P = 5. The dendrimers are portrayed as wine-colored spheres, with charged amine groups depicted in pink. siRNA molecules are shown as turquoise sticks. A transparent gray field is used to represent the solvent environment. (b) Zoomed view of one single G6 TEA-core PAMAM molecule in complex with one AKT siRNA (colors as in panel a). Some Cl- and Na+ counterions are shown as white and light gray spheres, respectively; water molecules are not shown for clarity. siRNA concentration-dependent inhibition of AKT (c) and its downstream effector p706SK (d) in SKOV-3 cells three days after TEA-core G6-mediated delivery (N/P = 5). Data for non-specific (NS) siRNA–G6 complexes are shown for comparison. Protein expression levels were determined by western blotting, quantified by densitometry, and are expressed as fold-change normalized to β-actin. (e) Time-dependent growth inhibition of SKOV-3 cells transfected with G6 TEA-core PAMAM dendrimers (N/P = 5) and with non-specific (NS) siRNA–G6 complexes, as determined by the MTT assay. Values are expressed as % relative to control (non-treated cells). Filled bars: 24 h post transfection (p.t.), striped bars: 48 p.t., checked bars: 72 h p.t. (f) Caspase-3 activation in SKOV-3 cells determined 72 p.t. with G6 TEA-core PAMAM dendrimers at N/P = 5. Data for non-specific (NS) siRNA–G6 complexes are shown for comparison. Values are expressed as fold change normalized to β-actin used as control. Adapted from [47], which is an open access article published under an ACS AuthorChoice License.
Figure 9
Figure 9
SKOV-3 cell viability (a) and relative caspase-3 activation (b) after transfection with non-specific (NS) siRNA or AKT siRNA delivered by the G6 TEA-core dendrimer nanovectors (N/P = 5) alone or in combination with paclitaxel (100 nM). Non-treated cells and β-actin were used as respective controls. (c) Tumor volumes from SKOV-3 xenografted mice treated with non-specific (NS) siRNA (top panel, left) or AKT siRNA delivered by the G6 TEA-core dendrimer nanovectors (N/P = 5) alone (top panel, right) or in combination with paclitaxel (100 nM, bottom panel). (d) Drastic reduction of AKT levels in tumor xenografts injected with AKT siRNA G6 TEA-core dendriplexes (bottom, left), and the corresponding histological sample showing sign of necrosis (bottom, right), compared with xenografts treated with NS siRNA delivered with the same nanovectors showing no reduction of AKT levels (top, left) and no necrosis (top, right). (e) Tumor volume during combined treatment of AKT siRNA G6 TEA-core dendriplexes/paclitaxel (filled hot pink circles) of SKOV-3 mice xenografts, compared with nanodelivered AKT siRNA (open hot pink circles) or paclitaxel alone (filled gray circles). Data for nanodelivered NS siRNA are shown for control (open gray circles). Adapted from [47], which is an open access article published under an ACS AuthorChoice License.
Figure 10
Figure 10
(a) Hsp27 gene silencing upon delivery of complementary ssiRNAs mediated by different generations of TEA-core PMAMAM to PC-3 cells. Checked bars: Data for A5/T5 ssiRNA; solid bars: Data for A7/T7 ssiRNA. In these experiments, vinculin was used as reference and non-treated cells were used for control. (b) Long-term Hsp27 silencing achieved with A5/T5 and A7/T7 ssiRNAs (50 nM) delivered by G5 TEA-core PAMAMs at N/P = 10. Redrawn from [56], with permission of the American Chemical Society.
Figure 11
Figure 11
Total effective free energy (ΔGbind,eff = ΔHbind,eff–TΔSbind,eff), enthalpic (ΔHbind,eff), and entropic (–TΔSbind,eff) components for the binding of (a) ssiRNAs featuring complementary and non-complementary overhangs of different length and (b) dimeric ssiRNAs with the G5 TEA-core PAMAM dendrimer. Neff is the number of effective dendrimer positive charges involved in nucleic acid binding (see Table A1 and Table A2 in Appendix A and text for more details). (b) Redrawn from [57], with permission of the American Chemical Society.
Figure 12
Figure 12
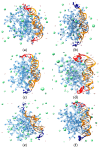
Examples of equilibrated molecular dynamics (MD) snapshots of G5 TEA-core dendrimer in complex with A5/A5 (a), T5/T5 (b), A5/T5 (c), A7/A7 (d), T7/T7 (e), and A7/T7 (f) ssiRNAs at pH 7.4 and in the presence of 0.15 M NaCl. In all panels, the dendrimer is shown as cornflower blue sticks, and the terminal charged amine groups are highlighted as sticks-and-balls. The ssiRNA is portrayed as an orange ribbon, with the two overhangs (An) and (Tn) colored in red and navy blue, respectively. Some Cl and Na+ ions and counterions are shown as light green and light pink spheres, respectively. Water molecules are not shown for clarity. Redrawn from [57], with permission of the American Chemical Society.
Figure 13
Figure 13
Equilibrated MD snapshots of the (A5/T5)2 (a) and (A7/T7)2 (b) dimeric ssiRNAs in complex with the G5 TEA-core dendrimer pH 7.4 and in the presence of 0.15 M NaCl. Molecule representations and color scheme as in Figure 12. The double-stranded portion of the concatenated (hybridized) ssiRNAs is highlighted in purple. (c) and (d) Experimental binding of ssiRNAs bearing complementary and non-complementary overhangs with the G5 TEA-core dendrimer by ethidium bromide (EB) displacement assay. Color legend: (c) Light blue, T5/T5 ssiRNA; orange, A5/A5 ssiRNA; light purple, A5/T5 ssiRNA; dark blue; (d) T7/T7 ssiRNA; red, A7/A7 ssiRNA; light green, A7/T7 ssiRNA. Adapted from [57], with permission of the American Chemical Society.
Figure 14
Figure 14
(a) Profiles of the average force required to unbind ssiRNAs from their G5 TEA-core dendrimer nanovectors as obtained from steered molecular dynamics (SMD) simulations. Color legend: Dark blue, (T7/T7) ssiRNA; light blue, (T5/T5) ssiRNA; gray, (T2/T2) (i.e., non-sticky) siRNA; red, (A7/A7) ssiRNA; orange, (A5/A5) ssiRNA. (b) Relationship between the SMD peak force and the corresponding effective free energy of binding ΔGbind,eff for the corresponding ssiRNA and the G5 dendrimers. Redrawn from [57], with permission of the American Chemical Society.
Figure 15
Figure 15
(a) Effect of cytochalasin D (a macropinocytosis inhibitor, red bars), genistein (a caveolae-mediated endocytosis inhibitor, light blue bars), and chlorpromazine (a clathrin-mediated endocytosis inhibitor, gray bars) on the uptake of Alexa 647-labelled A5/T5 ssiRNA/G5 TEA-core dendrimer nanoparticles by PC-3 cells. Values are normalized to Alexa 647-labeled ssiRNA/G5 TEA-core dendrimer nanoparticles uptake in the absence of any inhibitor. (b) Colocalization of the Alexa 647-labelled A5/T5 ssiRNA/G5 TEA-core dendrimer nanoparticles with different endocytosis biomarkers: Top panel, dextran (macropinocytosis biomarker); middle panel, cholera toxin B (caveolae-mediated endocytosis biomarker); bottom panel, transferrin (clathrin-mediated endocytosis biomarker).
Figure 16
Figure 16
Hsp27 gene silencing upon delivery of different ssiRNAs (50 nM) mediated by G5 TEA-core PAMAM (N/P = 10) to PC-3 cells (a), MDA-MB-231 cells (b), and MCF-7 cells (c). Checked bars: Data for ssiRNA with n = 5; solid bars: Data for ssiRNA with n = 7. In these experiments, vinculin was used as reference, and non-treated cells were used for control (green solid bar). Data for non-sticky siRNA (A2/T2) are also shown for comparison (red solid bar). MDA-MB-231 and MCF-7 are two different breast cancer cell lines. Redrawn from [57], with permission of the American Chemical Society.
Figure 17
Figure 17
(a) Cell proliferation, (b) apoptosis, and (c) caspase 3/7 activity in PC-3 cells treated with A7/T7 ssiRNAs (50 nM) delivered by G5 TEA-core PAMAM (N/P = 10). Non-treated cells, the G5 dendrimer alone and a scrambled (non-silencing) ssiRNA sequence were used for control. Data in panels (a) and (c) were measured as described in Figure 6. The apoptotic index was measured with fluorescence-activated cell sorting (FACS) flow cytometry by the annexin V assay four days after treatment. Redrawn from [56], with permission of the American Chemical Society.
Figure 18
Figure 18
In vivo downregulation of Hsp27 at both mRNA (a) and protein (b) levels achieved after treating PC-3 cell xenografted nude mice with intratumoral injection of Hsp27 A7/T7 ssiRNA/G5 complex, buffer solution (control), the dendrimer G5 alone, the A7/T7 ssiRNA alone and a scrambled (non-silencing) ssiRNA sequence/G5 complex (all used as negative controls). (c) Evaluation of tumor cell proliferation via immunohistochemistry using Ki-67 staining after treatment with a scrambled ssiRNA sequence/G5 (left) and the Hsp27 A7/T7 ssiRNA/G5 complexes (right). Adapted from [56], with permission of the American Chemical Society.
Figure 18
Figure 18
In vivo downregulation of Hsp27 at both mRNA (a) and protein (b) levels achieved after treating PC-3 cell xenografted nude mice with intratumoral injection of Hsp27 A7/T7 ssiRNA/G5 complex, buffer solution (control), the dendrimer G5 alone, the A7/T7 ssiRNA alone and a scrambled (non-silencing) ssiRNA sequence/G5 complex (all used as negative controls). (c) Evaluation of tumor cell proliferation via immunohistochemistry using Ki-67 staining after treatment with a scrambled ssiRNA sequence/G5 (left) and the Hsp27 A7/T7 ssiRNA/G5 complexes (right). Adapted from [56], with permission of the American Chemical Society.

Similar articles

Cited by

References

    1. Fire A., Xu S., Montgomery M.K., Kostas S.A., Driver S.E., Mello C.C. Potent and specific genetic interference by double-stranded RNA in Caenorhabditis elegans. Nature. 2005;391:806–811. doi: 10.1038/35888. - DOI - PubMed
    1. Bernstein E., Caudy A.A., Hammond S.M., Hannon G.J. Role for a bidentate ribonuclease in the initiation step of RNA interference. Nature. 2001;409:363–366. doi: 10.1038/35053110. - DOI - PubMed
    1. Ameres S.L., Martinez J., Schroeder R. Molecular basis for target RNA recognition and cleavage by RISC. Cell. 2007;131:101–112. doi: 10.1016/j.cell.2007.04.037. - DOI - PubMed
    1. Bobbin M.L., Rossi J.J. RNA interference (RNAi)-based therapeutics: Delivery on the promise? Annu. Rev. Pharmacol. Toxicol. 2016;56:103–122. doi: 10.1146/annurev-pharmtox-010715-103633. - DOI - PubMed
    1. Pecot C.V., Calin G.A., Coleman R.L., Lopez-Berestein G., Sood A.K. RNA interference in the clinic: Challenges and future directions. Nat. Rev. Cancer. 2011;11:59–67. doi: 10.1038/nrc2966. - DOI - PMC - PubMed

LinkOut - more resources