. 2019 Jul 19;20(1):593.
doi: 10.1186/s12864-019-5967-8.

Gene expression profile of human T cells following a single stimulation of peripheral blood mononuclear cells with anti-CD3 antibodies

Affiliations

Gene expression profile of human T cells following a single stimulation of peripheral blood mononuclear cells with anti-CD3 antibodies

Isabel Garcia Sousa et al. BMC Genomics. .

Abstract

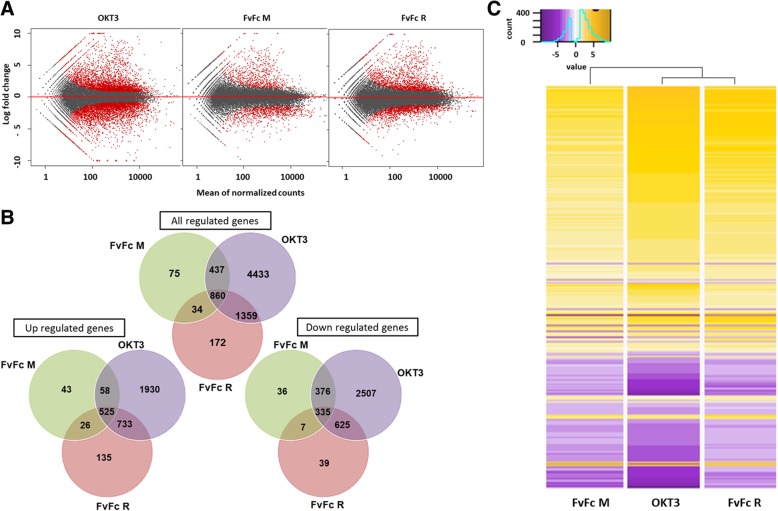
Background: Anti-CD3 immunotherapy was initially approved for clinical use for renal transplantation rejection prevention. Subsequently, new generations of anti-CD3 antibodies have entered clinical trials for a broader spectrum of therapeutic applications, including cancer and autoimmune diseases. Despite their extensive use, little is known about the exact mechanism of these molecules, except that they are able to activate T cells, inducing an overall immunoregulatory and tolerogenic behavior. To better understand the effects of anti-CD3 antibodies on human T cells, PBMCs were stimulated, and then, we performed RNA-seq assays of enriched T cells to assess changes in their gene expression profiles. In this study, three different anti-CD3 antibodies were used for the stimulation: two recombinant antibody fragments, namely, a humanized and a chimeric FvFc molecule, and the prototype mouse mAb OKT3.

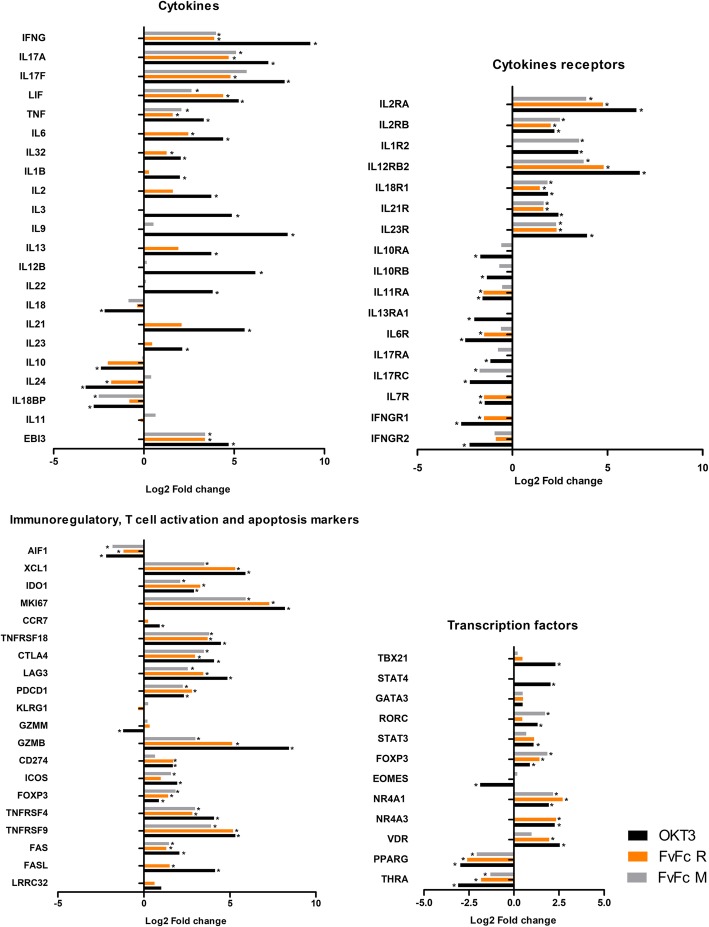
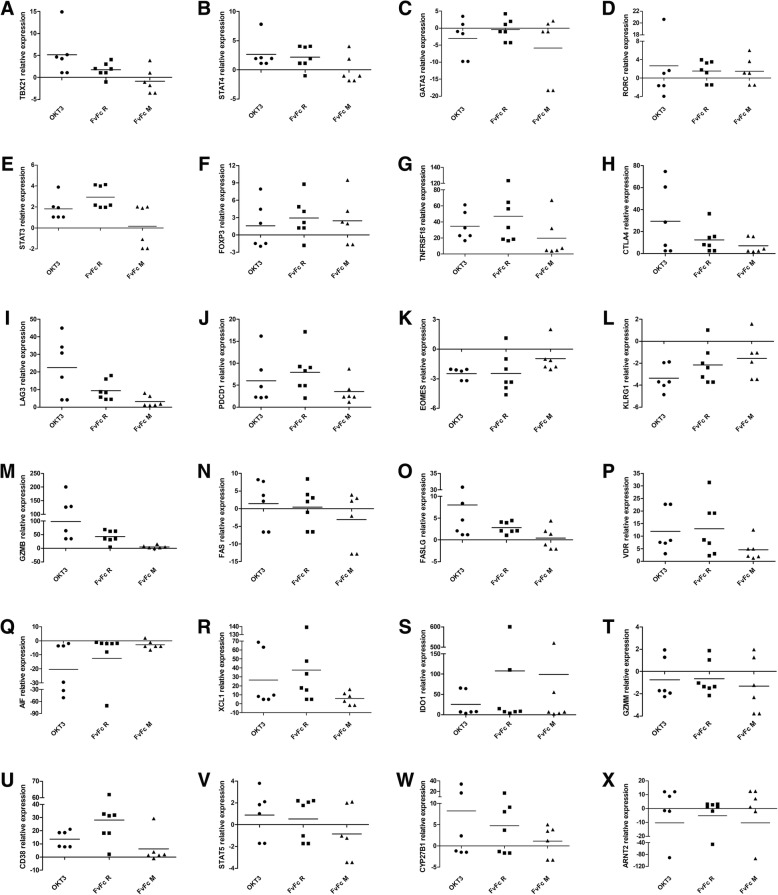
Results: Gene Ontology categories and individual immunoregulatory markers were compared, suggesting a similarity in modulated gene sets, mainly those for immunoregulatory and inflammatory terms. Upregulation of interleukin receptors, such as IL2RA, IL1R, IL12RB2, IL18R1, IL21R and IL23R, and of inhibitory molecules, such as FOXP3, CTLA4, TNFRSF18, LAG3 and PDCD1, were also observed, suggesting an inhibitory and exhausted phenotype.

Conclusions: We used a deep transcriptome sequencing method for comparing three anti-CD3 antibodies in terms of Gene Ontology enrichment and immunological marker expression. The present data showed that both recombinant antibodies induced a compatible expression profile, suggesting that they might be candidates for a closer evaluation with respect to their therapeutic value. Moreover, the proposed methodology is amenable to be more generally applied for molecular comparison of cell receptor dependent antibody therapy.

Keywords: Anti-CD3; Antibody engineering; Antibody therapy; RNA-seq; Regulatory T cells.


Conflict of interest statement

The authors declare that they have no competing interests.

Figures

Fig. 1
Fig. 1
Global gene expression profiles in anti-CD3-treated human T cells by RNA-seq data. The transcriptome was obtained in CD3 T cells collected from a healthy donor at two different moments, treated or untreated with anti-CD3 antibodies. Only genes with padj ≤ 0.05 were considered differentially expressed. a MA-plot with the global gene expression profile; red dots indicate up- or downregulated genes. b Venn diagrams showing an overlap of regulated expressed genes compared to the control, among different anti-CD3 treatments. c Clustering analysis and heatmap of gene expression based on fold change data. Cluster analysis was performed with 860 commonly regulated genes (shown in rows) for each sample (columns). Gradient colors from purple to gold represent lower to higher expression (range from − 9.27 to 9.22)
Fig. 2
Fig. 2
Gene set enrichment analysis of differentially expressed genes. Gene ontologies associated with upregulated genes in peripheral blood CD3 cells following anti-CD3 treatment. The top twelve enriched biological process categories were calculated using Panther. GO terms associated with cell proliferation was found to be overrepresented. a FvFc M-treated, (b) FvFc R-treated, and (c) OKT3-treated T cells
Fig. 3
Fig. 3
Gene set enrichment analysis of differentially expressed genes associated with immune terms. Radar Plot of the GO term profile enrichment, coverage (completeness) and FDR adjusted p-value of immune-associated terms. The terms were selected among up- and downregulated DEGs for each antibody treatment, accessing those associated with immune response and inflammation typically associated with anti-CD3 therapy. The black line represents OKT3 treatment; the orange line, FvFc R treatment; and the gray line, FvFc M treatment
Fig. 4
Fig. 4
Differentially expressed genes in treated T cells assessed by RNA-seq data. Individual anti-CD3-induced DEG fold changes were grouped according to their biological function. The results are presented as the mean gene expression fold change from two RNA-seq experiments. The asterisk represents padj <0.05. OKT3 (black bars), FvFc R (orange bars) or FvFc M (gray bars)
Fig. 5
Fig. 5
Cytokines and their receptor genes regulated by anti-CD3 stimulation. qPCR assays were performed with total RNA extracted from T cells, 72 h post anti-CD3 stimulation. The results are expressed as the fold change relative to unstimulated T cells (n = 7; p < 0,05). B2M was used as an internal control for data normalization. a IL17A, (b) IL2RA, (c) IL23R, (d) IL10, (e) IL17RA, (f) IL7R, (g) TGFB1
Fig. 6
Fig. 6
T cell subpopulation signatures. Cluster analysis based on the fold change data of regulated genes (shown in rows) for each sample (columns) and grouped into T cell populations. Only genes with padj ≤ 0.05 were considered differentially expressed. Gradient colors from blue to dark brown represent lower to higher expression (range from − 2.69 to 9.22)
Fig. 7
Fig. 7
Quantitative analysis of T cell marker expression in anti-CD3-treated T cells. qPCR assays were performed with total RNA extracted from T cells, 72 h post anti-CD3 stimulation; the results are expressed as fold changes relative to levels in unstimulated T cells (n = 7; p < 0,05). B2M was used as an internal control for data normalization. (a) TBX21, (b) STAT4, (c) GATA, (d) RORC, (e) STAT3, (f) FOXP3, (g) TNFRSF18, (h) CTLA4, (i) LAG3, (j) PDCD1, (k) EOMES, (l) KLRG1, (m) GZMB, (n) FAS, (o) FASLG, (p) VDR, (q) AIF1, (r) XCL1, (s) IDO1, (t) CD38, (u) GZMM, (v) STAT5A, (w) CYP27B1, (x) ARNT2

References

    1. Cosimi AB, Urton B, Colvin RB, Goldstein G, Laquaglia MP, Tolkoff-Rubin N, et al. Treatment of acute renal allograft rejection with OKT3 monoclonal antibody. Transplantation. 1981;32(6):535–539. - PubMed
    1. Reichert JM. Marketed therapeutic antibodies compendium. MAbs. 2012;4(3):413–415. - PMC - PubMed
    1. Chatenoud L, Primo J, Bach JF. CD3 antibody-induced dominant self tolerance in overtly diabetic NOD mice. J Immunol. 1997;158(6):2947–2954. - PubMed
    1. Chatenoud L, Bluestone JA. CD3-specific antibodies: a portal to the treatment of autoimmunity. Nat Rev Immunol. 2007;7(8):622–632. - PubMed
    1. Utset TO, Auger JA, Peace D, Zivin RA, Xu D, Jolliffe L, et al. Modified anti-CD3 therapy in psoriatic arthritis: a phase I/II clinical trial. J Rheumatol. 2002;29(9):1907–1913. - PubMed