. 2019 Aug 22;75(4):741-755.e11.
doi: 10.1016/j.molcel.2019.06.012. Epub 2019 Jul 16.

High-Throughput Analysis Reveals Rules for Target RNA Binding and Cleavage by AGO2

Affiliations

High-Throughput Analysis Reveals Rules for Target RNA Binding and Cleavage by AGO2

Winston R Becker et al. Mol Cell. .

Abstract

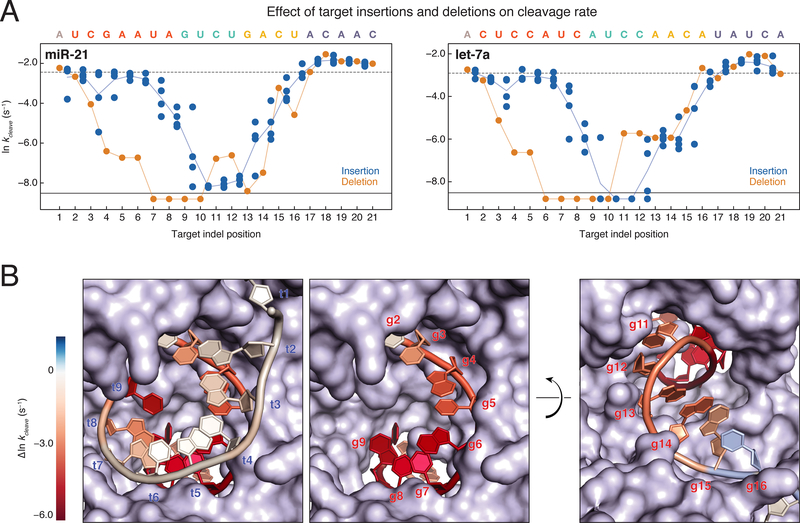
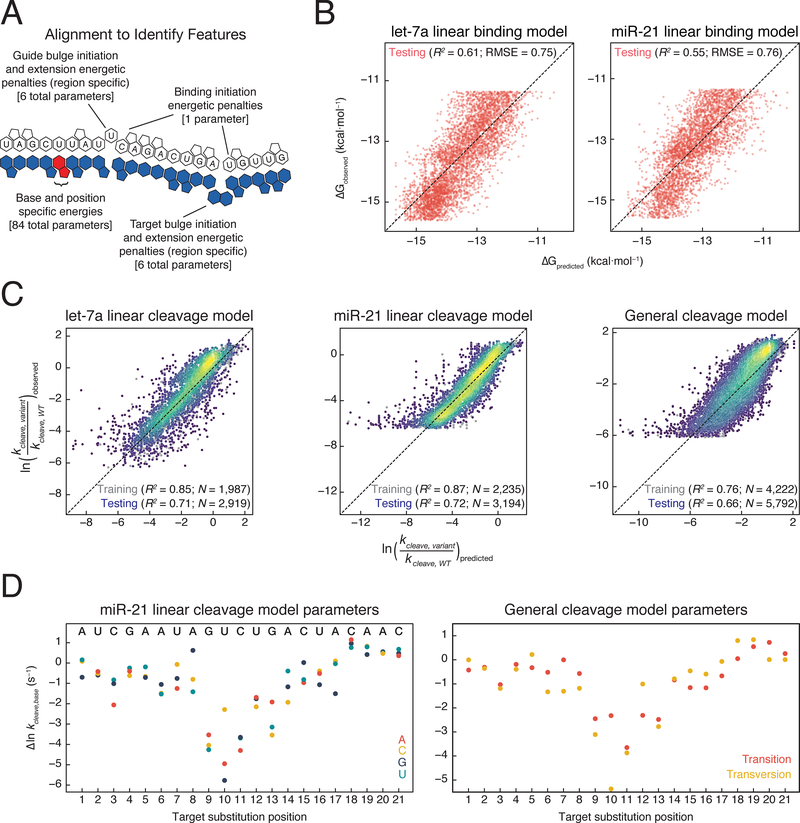
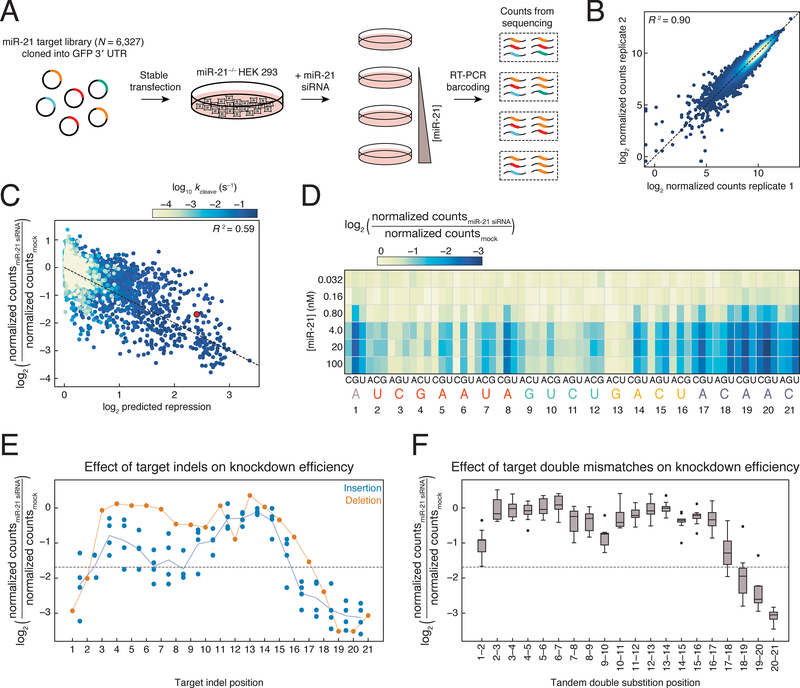
Argonaute proteins loaded with microRNAs (miRNAs) or small interfering RNAs (siRNAs) form the RNA-induced silencing complex (RISC), which represses target RNA expression. Predicting the biological targets, specificity, and efficiency of both miRNAs and siRNAs has been hamstrung by an incomplete understanding of the sequence determinants of RISC binding and cleavage. We applied high-throughput methods to measure the association kinetics, equilibrium binding energies, and single-turnover cleavage rates of mouse AGO2 RISC. We find that RISC readily tolerates insertions of up to 7 nt in its target opposite the central region of the guide. Our data uncover specific guide:target mismatches that enhance the rate of target cleavage, suggesting novel siRNA design strategies. Using these data, we derive quantitative models for RISC binding and target cleavage and show that our in vitro measurements and models predict knockdown in an engineered cellular system.

Keywords: RISC; RNA interference; RNA-protein interactions; argonaute; high-throughput biophysics; miRNA; post-transcriptional regulation; siRNA.


Figures

Figure 1.
Figure 1.. High-throughput Characterization of RISC Binding to in situ Transcribed RNA
(A) Schematic of RISC binding to RNA targets in a sequenced flow cell. (B) Summary of the let-7a target library. The number of targets in each class is indicated by the sum of targets with an affinity <10 pM (dark blue), affinities ranging between 10 pM and 10 nM (light blue), and targets with affinity > 10 nM (gray). The number of targets for which association was measured is shown in orange. (C) A representative set of RISC association data for a single target. Error bars correspond to the 95% confidence interval on the median fluorescence. The plot to the right shows the relationship between RISC concentration and observed rate, from which the association rate was determined. (D) Representative binding isotherms for four RISC targets (shown in corresponding color in schematic) containing different degrees of complementarity to the guide (in gray). See also Figure S1.
Figure 2.
Figure 2.. Sequence Determinants of AGO2 Association Kinetics
(A) Association rates for miR-21 (upper left) and let-7a (lower right) loaded RISC binding to single and double mismatched targets. To find the rate corresponding to a particular double mismatch, identify the first mismatch on the horizontal axis, and the second mismatch on the vertical axis. The intersection indicates the double mismatched target. Axes are labeled with the 3′ end of the target (5′ end of the guide) starting at position 1. Gray crosses indicate missing data. Colors are centered on the association rate of the perfectly complementary (PC) target (white) with blue representing faster and red slower. Color bar is displayed in panel C. (B) Association rates for tandem double mismatches mapped onto the AGO2 crystal structure (PDB ID: 4W5N). (C) Association rates for miR-21 (upper left) and let-7a (lower right) targets containing stretches of complementary nucleotide mismatches (e.g., A to U). Examples are shown for mismatch stretches 2–4 and 5–9 on the right of the panel. For the 2–4 mismatches, the corresponding targets in the heatmap are located at the intersection of 2 on the ‘beginning complement mismatch’ axis and 4 on the ‘ending complement mismatch’ axis. Colors are scaled as in panel A. (D) Change in association rates for tandem triple mismatches of miR-21 targets relative to a PC target (dotted line). Each boxplot includes the 27 triple substitutions for the three indicated target bases. (E) Change in association rates for perfect complement miR-21 targets with increasingly long hairpins bound to either the seed (blue) or non-seed (orange) end of the target sequence relative to a PC target with no flanking complementarity (dotted line). For each length of complementarity to the target sequence, there are up to five corresponding stem loops of different lengths. (F) Change in association rates for miR-21 targets containing 1–3 insertions of each base relative to a PC target (dotted line). (G) Change in association rates for miR-21 targets containing single and double deletions relative to a PC target (dotted line). See also Figure S2.
Figure 3.
Figure 3.. Target Sequence Contributions to AGO2 Binding Energies
(A) Binding energies for miR-21 (upper left) and let-7a (lower right) loaded RISC binding to single and double mismatched targets. Axes are labeled with the 3′ end of the target (5′ end of the guide) starting at position 1. White boxes represent missing data. Color bar is displayed in panel C. (B) Effect of tandem triple substitutions in the target sequence on miR-21 (top) and let-7a (bottom) binding affinity. Dashed lines indicate the limits of detection and the numbers above and below the line indicate the number of targets in each group that fell beyond those limits. (C) Binding energies for miR-21 (upper left) and let-7a (lower right) targets containing different length stretches of complementary nucleotide mismatches (e.g., A to U). (D) Binding affinities for targets containing progressively more complementarity to RISC. (E) Binding affinities for RISC loaded with miR-21 (top) or let-7a (bottom) to targets with 1–7 nucleotides insertions. Dashed lines indicate the limits of detection and points below the line bound with higher affinity than the detection limit. See also Figure S3.
Figure 4.
Figure 4.. RISC Cleave ’n-Seq (CNS) Enables High-throughput Measurement of Single Turnover Cleavage Kinetics
(A) Method to determine single turnover cleavage rates for RISC targets. (B) Cleavage rates for miR-21 (upper left) and let-7a (lower right) targets with single and double substitutions. Deep red represents targets for which no detectable cleavage was observed. Targets colored in blue were cleaved faster than the fully complementary target. (C) Cleavage rates of miR-21 (upper left) and let-7a (lower right) targets containing different length stretches of complementary nucleotide mismatches (e.g., A to U). Color bar as in (B). (D) Cleavage rates for miR-21 (top) and let-7a (bottom) targets containing three consecutive substitutions. The black dotted line represents the cleavage rate of the fully complementary RNA target, whereas the gray dotted line indicates the cleavage rate detection limit. The numbers at the bottom of the plot represent the number of targets in each group for which no cleavage was observed. See also Figure S4.
Figure 5.
Figure 5.. Target Insertions and Deletions Result in Out of Phase Trends for Cleavage Rates
(A) Cleavage rates for miR-21 (left) and let-7a (right) single insertions (blue dots) and single deletions (orange dots). Indels that correspond to multiple target positions are plotted in all possible target positions. The cleavage rate of the fully complementary target is indicated by the dotted line. Targets for which no cleavage was detected are plotted below the solid black line. Orange line, all single deletions; blue line, mean of the single insertions. (B) let-7a cleavage rates were mapped onto the RNA components of the AGO2 crystal structure (PDB ID: 4W5O). Target insertions were mapped onto the 9mer RNA target such that the mean of all insertions between t1 and t2 are mapped onto t1. Single deletion cleavage rates were mapped onto the guide strand of the structure. Cleavage rates near the wild-type rate are colored white, while immeasurably slow cleavage rates are colored deep red. The first frame shows both the guide and target strands as they enter the central cleft of the protein, while the second frame shows only the guide strand. The third frame shows the guide strand as it exits the central cleft of the protein. See also Figure S5.
Figure 6.
Figure 6.. Predictive Models for AGO2 Binding Affinity and Cleavage Kinetics
(A) Schematic of alignment of guide and target sequences to identify bound orientation. (B) Comparison of binding affinity predicted by let-7a and miR-21 specific models to observed binding affinities. (C) Comparison of cleavage rates predicted by let-7a and miR-21 specific models, or by a general cleavage model to observed cleavage rates. The color of the points represents the density of points at that position, with yellow being the densest and purple being the least dense. (D) Parameters obtained from fitting miR-21 cleavage model or a general cleavage model. See also Figure S6.
Figure 7.
Figure 7.. Binding Affinity and Cleavage Rate Affect Knockdown in Cells
(A) Scheme used to measure change in abundance of miR-21 targets. (B) Comparison of normalized counts obtained from replicate miR-21 siRNA transfection experiments at the same concentration. Points are colored by density, with yellow being the densest and blue being the least dense. (C) Biochemical model for predicting siRNA knockdown from measured kon and kcleave, and predicted koff of each target. Sample shown is from the 100 nM miR-21 transfection. Individual targets are colored by RISC-CNS measured cleavage rate. Red dot, perfectly complementary target. Dotted line has slope of −1 and intercept of 0. (D) Knockdown of targets bearing single mismatches at each miR-21 siRNA concentration transfected. (E) Knockdown of targets with single insertions (blue dots) or deletions (orange dots) following 100 nM transfection. Indels that correspond to multiple target positions are plotted in all possible target positions. Dotted line, target fully complementary to the siRNA. Orange line, all single deletions; blue line, mean of the single insertions. (F) siRNA-directed (100 nM) reduction in abundance for all tandem, doubly mismatched targets. Dotted line, target fully complementary to the siRNA. See also Figure S7.

Comment in

References

    1. Adams D, Gonzalez-Duarte A, O’Riordan WD, Yang C-C, Ueda M, Kristen AV, Tournev I, Schmidt HH, Coelho T, Berk JL, et al. (2018). Patisiran, an RNAi Therapeutic, for Hereditary Transthyretin Amyloidosis. N. Engl. J. Med 379, 11–21. - PubMed
    1. Agarwal V, Bell GW, Nam J-W, and Bartel DP (2015). Predicting effective microRNA target sites in mammalian mRNAs. eLife 4, e05005. - PMC - PubMed
    1. Ameres SL, Martinez J, and Schroeder R (2007). Molecular basis for target RNA recognition and cleavage by human RISC. Cell 130, 101–112. - PubMed
    1. Ameres SL, Horwich MD, Hung J-H, Xu J, Ghildiyal M, Weng Z, and Zamore PD (2010). Target RNA-directed trimming and tailing of small silencing RNAs. Science 328, 1534–1539. - PMC - PubMed
    1. Baek D, Villén J, Shin C, Camargo FD, Gygi SP, and Bartel DP (2008). The impact of microRNAs on protein output. Nature 455, 64–71. - PMC - PubMed

Publication types