. 2019 Sep 17;85(19):e01297-19.
doi: 10.1128/AEM.01297-19. Print 2019 Oct 1.

Amino Acids and Ribose: Drivers of Protein and RNA Fermentation by Ingested Bacteria of a Primitive Gut Ecosystem

Affiliations

Amino Acids and Ribose: Drivers of Protein and RNA Fermentation by Ingested Bacteria of a Primitive Gut Ecosystem

Lydia Zeibich et al. Appl Environ Microbiol. .

Abstract

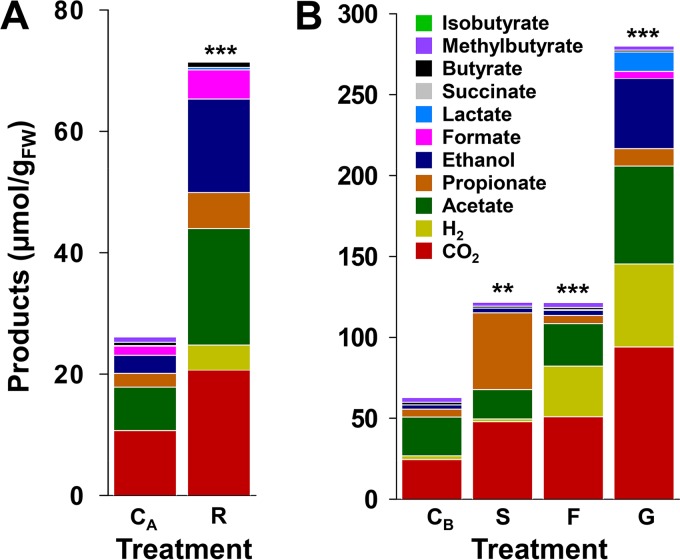
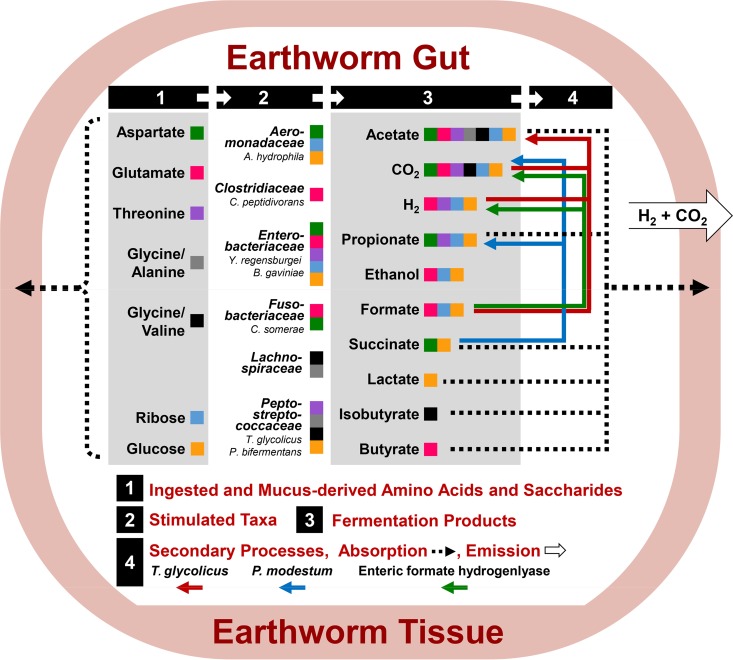
Earthworms are among the most primitive animals and are of fundamental importance to the turnover of organic matter in the terrestrial biosphere. These invertebrates ingest materials that are colonized by microbes, some of which are subject to disruption by the crop/gizzard or other lytic events during gut passage. Protein and RNA are dominant polymers of disrupted microbial cells, and these biopolymers facilitate robust fermentations by surviving ingested bacteria. To further resolve these fermentations, amino acids and ribose (as fermentable constituents of protein and RNA, respectively) were evaluated as potential drivers of fermentation in gut content of the model earthworm Lumbricus terrestris (taxa were examined with 16S rRNA-based analyses). Of eight amino acids tested, glutamate, aspartate, and threonine were most stimulatory and yielded dissimilar fermentations facilitated by contrasting taxa (e.g., glutamate stimulated the Fusobacteriaceae and yielded H2 and formate, whereas aspartate stimulated the Aeromonadaceae and yielded succinate and propionate). A marginal Stickland fermentation was associated with the Peptostreptococcaceae and Lachnospiraceae Ribose fermentation yielded a complex product profile facilitated primarily by the Aeromonadaceae The transient nature of succinate was linked to its decarboxylation to propionate and the Fusobacteriaceae, whereas the transient nature of formate was linked to formate-hydrogen lyase activity and the Peptostreptococcaceae These findings reinforce the likelihood that (i) the animal host and hosted fermentative bacteria compete for the constituents of protein and RNA in the alimentary canal and (ii) diverse gut fermenters engaged in the fermentation of these constituents produce products that can be utilized by earthworms.IMPORTANCE Animal health is linked to gut ecosystems whose primary function is normally the digestion of dietary matter. Earthworms are representative of one of the oldest known animal lineages and, despite their primitive nature, have unique environmental impact by virtue of their dietary consumption of their habitat, i.e., soil-associated matter. A resident gut community is a hallmark of many gut ecosystems of evolutionarily more advanced animals, but the alimentary canal of earthworms is dominated by ingested transient soil microbes. Protein and RNA are (i) the primary organic components of microbial cells that are subject to lysis during gut passage and (ii) fermentable dietary substrates in the alimentary canal. This study examined the gut-associated fermentation of constituents of these biopolymers to determine how their fermentation is integrated to the microbiological dynamics of the gut and might contribute to earthworm-linked transformations of organic matter in the terrestrial biosphere.

Keywords: amino acid fermentation; anaerobes; gut ecosystem; invertebrate microbiology.


Figures

FIG 1
FIG 1
Effects of amino acids on the fermentation product profiles of anoxic microcosms of L. terrestris gut contents. Initial concentrations approximated 10 mM for Casamino Acids, glutamate, aspartate, threonine, and glycine and 5 mM for alanine and valine; the control lacked supplement. Values are the arithmetic averages from three replicate analyses, and error bars indicate the standard deviations. Some standard deviations are smaller than the size of the symbol and therefore not apparent. FW, fresh weight.
FIG 2
FIG 2
Collective amounts of fermentation products in amino acid treatments. Values are the averages from triplicate analyses shown in Fig. 1 and represent the net amounts of products at the end of the 30 h of incubation. The asterisks indicate significant differences between the collective amounts of products formed in control and amino acid treatments. *, P ≤ 0.05; **, P ≤ 0.01; ***, P ≤ 0.001 by t test with unequal variances (see Table S2 in the supplemental material for P values, mean values, and variances); C, unsupplemented control; CAA, Casamino Acids; Glu, glutamate; Asp, aspartate; Thr, threonine; Ala, alanine; Gly, glycine; Val, valine; FW, fresh weight.
FIG 3
FIG 3
Net increases in 16S rRNA gene (DNA) and 16S rRNA (RNA) relative sequence abundances of bacterial families stimulated by supplemental amino acids (A), ribose, succinate, formate, and glucose (B) in L. terrestris gut content microcosms. The graphs are limited to families that displayed a net increase in relative sequence abundance of ≥4% in at least one treatment; the families are color coded to the respective phyla. Net increases of relative abundances were calculated as follows (8): (i) the calculation is based either on mean relative abundances when samples from the three replicates were analyzed separately (i.e., all RNA and DNA samples of control treatments and RNA samples at 30 h of supplemented treatments) or on single relative abundances when samples of the three replicates were pooled for sequence analyses (i.e., DNA samples at 0 h and 30 h and RNA samples at 0 h of supplemented treatments); (ii) mean or single relative abundances at the beginning of incubation were subtracted from those at the end of the 30 h of incubation for control and supplemented treatments; (iii) the resulting time-corrected relative abundances of control treatments were subtracted from those of supplemented treatments (negative time-corrected relative abundances of control treatments were ignored).
FIG 4
FIG 4
Collective amounts of fermentation products in ribose (A) and transient intermediate (B) treatments. Values are the averages from triplicate analyses shown in Table S6 in the supplemental material (ribose) and Fig. 5 (transient intermediates) and represent the net amounts of products at the end of the 30 h of incubation. The asterisks indicate significant differences between the collective amount of products formed in unsupplemented control and supplemented treatments. **, P ≤ 0.01; ***, P ≤ 0.001 by t test with unequal variances (see Table S7 for P values, mean values, and variances); CA and CB, unsupplemented controls; R, ribose; S, succinate; F, formate; G, glucose; FW, fresh weight.
FIG 5
FIG 5
Effects of succinate, formate, and glucose on the fermentation product profiles of anoxic microcosms of L. terrestris gut contents. Initial concentrations approximated 10 mM for succinate and formate and 5 mM for glucose; the control lacked supplement. Values are the arithmetic averages from three replicate analyses, and error bars indicate the standard deviations. Some standard deviations are smaller than the size of the symbol and therefore not apparent. FW, fresh weight.
FIG 6
FIG 6
16S rRNA-based overview of the net increase of relative abundances of the main stimulated group phylotypes and phylogenetic tree (dendrogram) of these stimulated group phylotypes. (A) Each group phylotype (GPT) consists of identical or nearly identical phylotypes based on a ≥97% sequence similarity. Phylotypes are based on a sequence similarity cutoff of 97% and were considered stimulated when a phylotype in at least one of the supplemented treatments displayed a ≥2% net increase in relative abundance. Net increases of relative abundances were calculated as follows (8): (i) the calculation is based either on mean relative abundances when samples from the three replicates were analyzed separately (i.e., all RNA and DNA samples of control treatments and RNA samples at 30 h of supplemented treatments) or on single relative abundances when samples of the three replicates were pooled for sequence analyses (i.e., DNA samples at 0 h and 30 h and RNA samples at 0 h of supplemented treatments); (ii) mean or single relative abundances at the beginning of incubation were subtracted from those at the end of incubation for control and supplemented treatments; (iii) the resulting time-corrected relative abundances of control treatments were subtracted from those of supplemented treatments (negative time-corrected relative abundances of control treatments were ignored). CAA, Casamino Acids; Glu, glutamate; Asp, aspartate; Thr, threonine; Ala, alanine; Gly, glycine; Val, valine; S, succinate; F, formate; G, glucose. (B) The phylogenetic tree was calculated using the neighbor-joining, maximum parsimony, and maximum likelihood methods. Solid circles, congruent nodes in three trees; empty circles, congruent nodes in maximum parsimony and maximum likelihood trees; gray circles, congruent nodes in maximum parsimony and neighbor-joining trees. Branch length and bootstrap values (1,000 resamplings) are from the maximum parsimony tree. The bar indicates 0.1 changes per nucleotide. Thermotoga maritima (AE000512) was used as an outgroup. Accession numbers are shown at the end of each branch. Phylotype descriptors: A, phylotypes derived from amino acid experiment (Fig. 1); R, phylotypes derived from ribose experiment (Fig. 4A); T, phylotypes derived from transient experiment (Fig. 4B).
FIG 7
FIG 7
Hypothetical model of fermentative transformations of amino acids and saccharides in the gut of L. terrestris. The model depicts events that are interfaced to (i) the in situ hydrolysis of dietary protein, dietary RNA, and glycoprotein-rich mucus, and (ii) the earthworm’s utilization of biopolymer constituents and fermentation-derived products.

References

    1. Seilacher A, Bose PK, Pfluger F. 1998. Triploblastic animals more than 1 billion years ago: trace fossil evidence from India. Science 282:80–83. doi:10.1126/science.282.5386.80. - DOI - PubMed
    1. Morris SC, Peel JS. 2008. The earliest annelids: lower Cambrian polychaetes from the Sirius Passet Lagerstätte, Peary Land, North Greenland. Acta Palaeontol Pol 53:137–148. doi:10.4202/app.2008.0110. - DOI
    1. Hackmann TJ, Spain JN. 2010. Invited review: ruminant ecology and evolution: perspectives useful to ruminant livestock research and production. J Dairy Sci 93:1320–1334. doi:10.3168/jds.2009-2071. - DOI - PubMed
    1. Bourguignon T, Lo N, Cameron SL, Šobotník J, Hayashi Y, Shigenobu S, Watanabe D, Roisin Y, Miura T, Evans TA. 2015. The evolutionary history of termites as inferred from 66 mitochondrial genomes. Mol Biol Evol 32:406–421. doi:10.1093/molbev/msu308. - DOI - PubMed
    1. Ross A. 2017. Insect evolution: the origin of wings. Curr Biol 27:R113–R115. doi:10.1016/j.cub.2016.12.014. - DOI - PubMed

Publication types

LinkOut - more resources