. 2019 Aug 5;151(8):1017-1034.
doi: 10.1085/jgp.201812261. Epub 2019 Jul 19.

Dendritic spine geometry and spine apparatus organization govern the spatiotemporal dynamics of calcium

Affiliations

Dendritic spine geometry and spine apparatus organization govern the spatiotemporal dynamics of calcium

Miriam Bell et al. J Gen Physiol. .

Erratum in

Abstract

Dendritic spines are small subcompartments that protrude from the dendrites of neurons and are important for signaling activity and synaptic communication. These subcompartments have been characterized to have different shapes. While it is known that these shapes are associated with spine function, the specific nature of these shape-function relationships is not well understood. In this work, we systematically investigated the relationship between the shape and size of both the spine head and spine apparatus, a specialized endoplasmic reticulum compartment within the spine head, in modulating rapid calcium dynamics using mathematical modeling. We developed a spatial multicompartment reaction-diffusion model of calcium dynamics in three dimensions with various flux sources, including N-methyl-D-aspartate receptors (NMDARs), voltage-sensitive calcium channels (VSCCs), and different ion pumps on the plasma membrane. Using this model, we make several important predictions. First, the volume to surface area ratio of the spine regulates calcium dynamics. Second, membrane fluxes impact calcium dynamics temporally and spatially in a nonlinear fashion. Finally, the spine apparatus can act as a physical buffer for calcium by acting as a sink and rescaling the calcium concentration. These predictions set the stage for future experimental investigations of calcium dynamics in dendritic spines.


Figures

Figure 1.
Figure 1.
Physical and chemical determinants of calcium influx in dendritic spines. (a) Spatiotemporal dynamics of calcium in dendritic spines depend on multiple sources and sinks on both the spine membrane and the SpApp membrane. Fluxes are denoted as Jx, where x is the source or sink. These include receptors (NMDARs), channels (VSCCs), and pumps (PMCA and NCX). Calcium buffers are present both in the cytoplasm and on the PM. α-amino-3-hydroxy-5-methyl-4-isoxazolepropionic acid receptor (AMPAR) is another important receptor that is often used as a readout for long term potentiation and depression. We do not include its dynamics in this model. (b) A partial list of factors that can influence these dynamics include biochemical components (shown in panel a), geometry, and protein transport components, which are effectively coupled through transport phenomena. In this study, we focus on the effects of spine and SpApp size, spine and SpApp shape, flux through NMDAR and VSCC distribution on calcium spatiotemporal dynamics, and buffers. (c) Four different combinations of spine head and SpApp geometries are used as model geometries (spherical head with spherical apparatus, spherical head with ellipsoidal apparatus, ellipsoidal head with ellipsoidal apparatus, and ellipsoidal head with spherical apparatus) to study how spine geometry affects calcium dynamics. The coordinate axes correspond to 100 nm in the different geometries. The blue shaded regions denote the PSD for each geometry. (d) In our model, depolarization of the membrane is triggered by an EPSP followed closely by a BPAP to create a maximal depolarization according to STDP. This membrane voltage acts as the input to our model. Inset: Timing of the EPSP and the BPAP. We model the maximum possible membrane depolarization based on STDP with the EPSP arriving 2 ms before the BPAP.
Figure 2.
Figure 2.
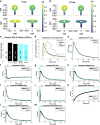
Spine head volume-to-surface area ratio modifies calcium dynamics through membrane flux contributions. (a and b) Spatial distribution of calcium in spines at two different time points (5 ms [a] and 10 ms [b]). The instantaneous gradient of calcium ions depends on the shape of the spine head and the shape of the SpApp. (c) Calcium accumulation at 300 ms was calculated using the AUC of the spatial and temporal dynamics of calcium throughout the volume; the differences between the shapes are small, with the most pronounced difference being a 12% increase in AUC between the sphere and ellipsoid spines. (d) We plot the temporal dynamics at the top of the spherical control spine versus reported experimental calcium transients from previous studies (Sabatini et al., 2002; Hoogland and Saggau, 2004; Segal and Korkotian, 2014). The experimental transients are reported in terms of fluorescence, which we assume are linearly proportional to concentration (Yasuda et al., 2004). We plot Fig. 1 F from Sabatini et al. (2002), Fig. 1 from Segal and Korkotian (2014), and Fig. 2 D from Hoogland and Saggau (2004). PlotDigitizer was used to trace the temporal profiles that were then plotted in MATLAB. We more closely compared the spherical and ellipsoidal spines by integrating total calcium ions over time (e) and considering the integrated fluxes for both shapes (f–m). We see that the ellipsoid has more calcium ions than the sphere (e), because despite having more calcium influx due to VSCC (j), the subsequent higher calcium concentration leads to higher efflux due to pumps (h and l) and buffers (m). Note the timescale in panels e–m is shortened to 50 ms for clarity.
Figure 3.
Figure 3.
The presence of a SpApp, acting as a sink, modulates calcium dynamics. Spines without SpApp have higher and more sustained calcium activity despite their increased volume in both spherical (a) and ellipsoidal (d) spines. Temporal dynamics (b and e) and AUC (c and f) plots show that the absence of a SpApp (no SERCA flux, denoted as JSERCA) leads to a prolonged calcium transient and higher total calcium levels for both spherical and ellipsoidal shapes. Insets in panels b and e show the location in the spine from where the time courses were plotted.
Figure 4.
Figure 4.
Accumulated calcium scales inversely proportional to the spine head volume. (a) Calcium dynamics in spines of different sizes show that as spine volume increases, calcium concentration in the spine decreases. The effect of spine size on the temporal dynamics of calcium is seen in the peak values (b) and AUCs of calcium (c). Increasing spine volume decreases the peak calcium concentration but increases overall AUC in the spine irrespective of the spine shape. cyto, cytoplasm.
Figure 5.
Figure 5.
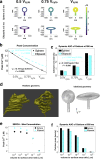
Increasing SpApp volume reduces accumulated calcium and SpApp volume-to-surface area modulates its ability to act as a sink. (a) Calcium dynamics depends on the size of SpApp; decreasing cytoplasmic volume by increasing SpApp size results in a smaller calcium concentration when compared with a larger spine volume with smaller SpApp. The effect of SpApp size on the temporal dynamics of calcium is seen in the (b) peak values and (c) AUCs of calcium. Increasing SpApp volume (decreasing spine volume) decreases calcium concentration in the spine (a and c) but leads to higher peak concentrations (b). For both geometries, the peak calcium concentration increases for decreasing volume, and can be fit to exponential curves. (d) While we are used idealized geometries for both the spine and SpApp, in reality, the SpApp has a complex, helicoidal structure. We investigate this realistic geometry by changing the nSpApp contribution in the SERCA flux equation. We see that increasing nSpApp makes SERCA more effective, leading to lower peak concentrations (e) and lower AUC (f). However, we see that as we decrease nSpApp, the change in peak concentration and AUC plateaus, representing highly inefficient SERCA pumps. cyto, cytoplasm.
Figure 6.
Figure 6.
Localization of membrane fluxes alters the spatiotemporal dynamics of calcium. (a) Spatial dynamics at 2 ms for spherical and ellipsoidal spines with only one of VSCC or NMDAR as the calcium source. When the main calcium source is the VSCC, we see a more uniform concentration with the main gradient between the spine head and spine neck. When the NMDAR is the main calcium source, we see a large spatial gradient with a higher concentration at the PSD, because the NMDAR is localized to the PSD. (b) Temporal dynamics for spherical and ellipsoidal spines with either the VSCC or NMDAR as the calcium source. Temporal dynamics clearly show that VSCCs act on a faster timescale and have a higher peak calcium when compared with the NMDARs. However, NMDAR influx leads to a more prolonged calcium transient.
Figure 7.
Figure 7.
Calcium buffers and CBPs modify all aspects of calcium dynamics. (a) Spatial dynamics at 2 ms for spherical spines with different buffer conditions: control (with both fixed and mobile buffers), only fixed buffers, only mobile buffers, and a lumped exponential decay. While all buffer cases show relatively similar peak concentrations (d), all other quantifications show that buffer type greatly impacts the calcium transient decay time (a–c). Temporal dynamics (b) show that the control and fixed buffer cases have much faster decay, which translates into lower AUC values (c).
Figure 8.
Figure 8.
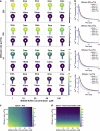
Calcium diffusion rates control spatial gradients of calcium while buffer concentrations control transient decay dynamics. (a) Spatial dynamics at 2 ms and 10 ms for a spherical spine. We varied the diffusion coefficient and the mobile buffer concentration. Based on this phase diagram, the diffusion coefficient dictates the range of the spatial gradient of calcium, while buffer binding rate influences the lifetime of the spatial gradient. (b) Temporal calcium dynamics at the top of the spherical spine. The temporal dynamics show that the concentration of mobile buffer affects the lifetime of the calcium transient, as expected. (c) AUC shows that lower mobile buffer concentration and lower diffusion rates leads to higher levels of total calcium. (d) Peak concentration is primarily determined by the diffusion rate of calcium and is almost independent of mobile buffer concentration.
Figure 9.
Figure 9.
Biophysical factors can impact synaptic weights through calcium dynamics. (a) Synaptic weight can be calculated from calcium dynamics (Shouval et al., 2002). We plot changes in synaptic weight due to calcium quantified through accumulated calcium. (b) Calcium dynamics also dictate the learning rate of the spine. (c) Qualitative representation of the effects of calcium AUC on synaptic weight and learning rate. Using our model, we can map how various factors governing calcium dynamics influence both synaptic weights and learning rates of dendritic spines. This surface plot visualizes how three different factors (volume to surface area ratio, ultrastructure, and calcium buffers) couple to influence calcium AUC (color bar) that feeds back into synaptic weight changes and learning rates.

Comment in

References

    1. Araya R., Vogels T.P., and Yuste R.. 2014. Activity-dependent dendritic spine neck changes are correlated with synaptic strength. Proc. Natl. Acad. Sci. USA. 111:E2895–E2904. 10.1073/pnas.1321869111 - DOI - PMC - PubMed
    1. Arellano J.I., Benavides-Piccione R., Defelipe J., and Yuste R.. 2007. Ultrastructure of dendritic spines: correlation between synaptic and spine morphologies. Front. Neurosci. 1:131–143. 10.3389/neuro.01.1.1.010.2007 - DOI - PMC - PubMed
    1. Atay O., and Skotheim J.M.. 2017. Spatial and temporal signal processing and decision making by MAPK pathways. J. Cell Biol. 216:317–330. 10.1083/jcb.201609124 - DOI - PMC - PubMed
    1. Augustine G.J., Santamaria F., and Tanaka K.. 2003. Local calcium signaling in neurons. Neuron. 40:331–346. 10.1016/S0896-6273(03)00639-1 - DOI - PubMed
    1. Bartol T.M. Jr., Bromer C., Kinney J., Chirillo M.A., Bourne J.N., Harris K.M., and Sejnowski T.J.. 2015a Nanoconnectomic upper bound on the variability of synaptic plasticity. eLife. 4:e10778 10.7554/eLife.10778 - DOI - PMC - PubMed

Publication types