. 2019 Oct 7;216(10):2242-2252.
doi: 10.1084/jem.20181705. Epub 2019 Jul 19.

Embryonic FAP+ lymphoid tissue organizer cells generate the reticular network of adult lymph nodes

Affiliations

Embryonic FAP+ lymphoid tissue organizer cells generate the reticular network of adult lymph nodes

Alice E Denton et al. J Exp Med. .

Abstract

The induction of adaptive immunity is dependent on the structural organization of LNs, which is in turn governed by the stromal cells that underpin LN architecture. Using a novel fate-mapping mouse model, we trace the developmental origin of mesenchymal LN stromal cells (mLNSCs) to a previously undescribed embryonic fibroblast activation protein-α (FAP)+ progenitor. FAP+ cells of the LN anlagen express lymphotoxin β receptor (LTβR) and vascular cell adhesion molecule (VCAM), but not intercellular adhesion molecule (ICAM), suggesting they are early mesenchymal lymphoid tissue organizer (mLTo) cells. Clonal labeling shows that FAP+ progenitors locally differentiate into mLNSCs. This process is also coopted in nonlymphoid tissues in response to infection to facilitate the development of tertiary lymphoid structures, thereby mimicking the process of LN ontogeny in response to infection.


Figures

None
Graphical abstract
Figure 1.
Figure 1.
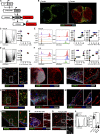
Adult mLNSCs have a history of FAP expression. (A) Schematic of FCTomato mice. (B) tdTomato expression in FCTomato and CTomato iLN sections. (C–F) tdTomato expression by cells from mesLNs (C and E) or pLNs (D and F) from FCTomato mice. (C and D) Phenotype of tdTomato+ cells. SSC, side scatter. (E and F) tdTomato expression and tdTomato mean fluorescence intensity (MFI) in LN cells. Data represent three independent experiments with four to six mice. Statistical significance was determined by one-way ANOVA, compared with the CD45+ group, *, P < 0.001; ns, not significant. (G–O) tdTomato+ mLNSCs were identified in iLN sections of FCTomato mice: FRCs (G), FDCs (H), MRCs (I), interfollicular and T:B border mLNSCs (J), medullary mLNSCs (K), CD34+ adventitial cells (L), CD34+ capsular mLNSCs (M), CRCs in mice immunized 14 d before (N), and perivascular DNCs (O). In O, arrow denotes ITGA7tdTomato+ FRC; arrowheads denote ITGA7+tdTomato+ perivascular cells. (P) tdTomato expression in mLNSCs from FCTomato mice, CTomato mice, and FCTomato (+dox e0) mice. Data are compiled from three experiments comprising three to four mice per group. Statistical significance was determined by one-way ANOVA comparing all groups to each other, **, P < 0.0001; ns, not significant. Scale bars, 500 µm (B); 100 µm (J–N); 50 µm (G–I and O). Images represent more than five mice.
Figure 2.
Figure 2.
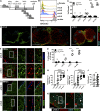
Adult mLNSCs derive from FAP+ cells in the e15.5 iLN anlage. (A) FCTomato and littermate CTomato mice were kept on dox from different stages of embryogenesis until analysis at 4 wk. (B and C) The proportion of tdTomato+ mLNSCs in iLNs fate-mapped from different stages of embryogenesis. Statistical significance was determined using a two-tailed t test, comparing FCTomato to CTomato littermates: *, P < 0.05; ***, P < 0.001; ns, not significant. (D and E) The LN tdTomato+ area was determined in iLNs fate-mapped from different stages of embryogenesis. Scale bars, 500 µm. Images represent two to five individual mice combined from two to three experiments. Statistical significance was determined using a two-tailed t test, comparing FCTomato mice to CTomato littermates: **, P < 0.01; ***, P < 0.001. (F and G) tdTomato+ FDCs (F) and MRCs (G) in iLNs fate-mapped from e14.5 and e15.5. Images represent three to five mice. Scale bars, 50 µm. (H–J) The proportion of FDCs (H) and MRCs (I) labeled in adult iLNs fate-mapped from embryogenesis. Data represent three or more follicles per mouse, combined from three to five mice in two experiments. Statistical significance was determined by one-way ANOVA, comparing to no dox: ****, P < 0.0001. (J) Proportion of FDCs and MRCs that are tdTomato+ in FCTomato (+dox e14.5) mice. Statistical significance was determined using a Mann–Whitney U test. (K) tdTomato labeling in MRCs and FDCs fate-mapped from e14.5. Arrows and arrowheads indicate tdTomato+ and tdTomato cells, respectively. Scale bar, 50 µm. White boxes indicate enlarged areas. Images represent three to five mice compiled from two experiments.
Figure 3.
Figure 3.
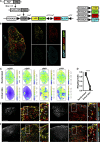
Adult mLNSC fate is locally determined. (A) FCConfetti fate-mapping approach. (B) Fluorescent proteins mapping FAP expression from e15.5. (C) Probability distributions of a randomized Poisson distribution of fluorescent reporters (top), or the actual data (bottom). (D) MI was calculated for each iLN and compared with the MI derived from the randomized distributions. Data shown are 15 iLNs combined from two experiments. Statistical significance was determined using a paired t test: ****, P < 0.0001. (E and F) The relationships of fate-mapped MRCs and FDCs in single follicles was determined in FCConfetti (+dox e15.5) mice. CD35+ FDCs (E) and RANKL+ MRCs (F), represented as a z-stack encompassing 20 µm. Arrows indicate linked cRFP+ cells; arrowheads indicate linked cYFP+ cells. See Videos 1 and 2 (E) and Videos 3 and 4 (F). White boxes indicate enlarged areas. Scale bars, 500 µm (B) or 100 µm (E and F). Data represent 15 iLNs from two experiments.
Figure 4.
Figure 4.
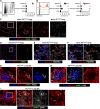
Adult mLNSCs derive from FAP+ pre-mLTo cells. (A) tdTomato expression in e15.5 and e16.6 FCTomato iLN anlagen. Scale bars, 100 µm. Dotted line shows the anlage. (B–F) FAP+ cells in e15.5 iLN anlage were analyzed for mLTo cell markers: ICAM and VCAM (B), LTβR (C), MAdCAM-1 (D), Prox-1 (E), and CXCL13 or CCL19 (F). Scale bars, 100 µm (B–E) or 50 µm (F). White boxes indicate enlarged areas. Arrows in F indicate CXCL13+FAP+ mLTo cells. Images represent three to six embryos from two to three litters.
Figure 5.
Figure 5.
Virus-induced pulmonary TLSs are supported by a FAP-derived stromal cell network. (A and B) The proportion of tdTomato+ cells expressing PDGFRα, CD31, and/or CD45 (A), the proportion of each population that is tdTomato+, and tdTomato mean fluorescence intensity (MFI; B) were determined in naive FCTomato lungs. Statistical significance was determined by one-way ANOVA, comparing all groups to CD45+: *, P < 0.01; **, P < 0.0001; ns, not significant; SSC, side scatter. (C–F) tdTomato+ cells in naive FCTomato lung sections showing CD31 (C), αSMA (D), PDGFRα (E), and PDGFRβ (F) expression. The fidelity of transgenic system is demonstrated in CTomato littermates (C). (G–I) TLS development in IAV-infected FCTomato mice was determined by staining for B cells and the presence of peripheral node addressin+ high endothelial venules (G), T cells (H), and CD35+ FDC-like cells (I). Arrows in I denote CD35+tdTomato+ reticular cells. Images in G–I are z-stack projections. Scale bars, 100 µm (C, D, and G–I) or 50 µm (E and F). Data represent at least two independent experiments with three to five mice.

References

    1. Adachi Y., Onodera T., Yamada Y., Daio R., Tsuiji M., Inoue T., Kobayashi K., Kurosaki T., Ato M., and Takahashi Y.. 2015. Distinct germinal center selection at local sites shapes memory B cell response to viral escape. J. Exp. Med. 212:1709–1723. 10.1084/jem.20142284 - DOI - PMC - PubMed
    1. Ansel K.M., Ngo V.N., Hyman P.L., Luther S.A., Förster R., Sedgwick J.D., Browning J.L., Lipp M., and Cyster J.G.. 2000. A chemokine-driven positive feedback loop organizes lymphoid follicles. Nature. 406:309–314. 10.1038/35018581 - DOI - PubMed
    1. Arnold J.N., Magiera L., Kraman M., and Fearon D.T.. 2014. Tumoral immune suppression by macrophages expressing fibroblast activation protein-α and heme oxygenase-1. Cancer Immunol. Res. 2:121–126. 10.1158/2326-6066.CIR-13-0150 - DOI - PMC - PubMed
    1. Baddeley A., and Turner R.. 2005. spatstat: An R package for analyzing spatial point patterns. J. Stat. Softw. 12:1–42. 10.18637/jss.v012.i06 - DOI
    1. Bajénoff M., Egen J.G., Koo L.Y., Laugier J.P., Brau F., Glaichenhaus N., and Germain R.N.. 2006. Stromal cell networks regulate lymphocyte entry, migration, and territoriality in lymph nodes. Immunity. 25:989–1001. 10.1016/j.immuni.2006.10.011 - DOI - PMC - PubMed

Publication types

MeSH terms