. 2019 Jul 19;10(1):3246.
doi: 10.1038/s41467-019-10923-5.

RNA structure drives interaction with proteins

Affiliations

RNA structure drives interaction with proteins

Natalia Sanchez de Groot et al. Nat Commun. .

Abstract

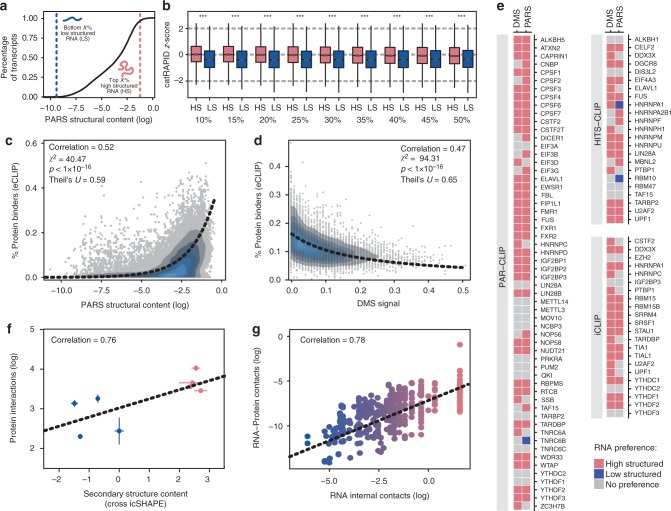
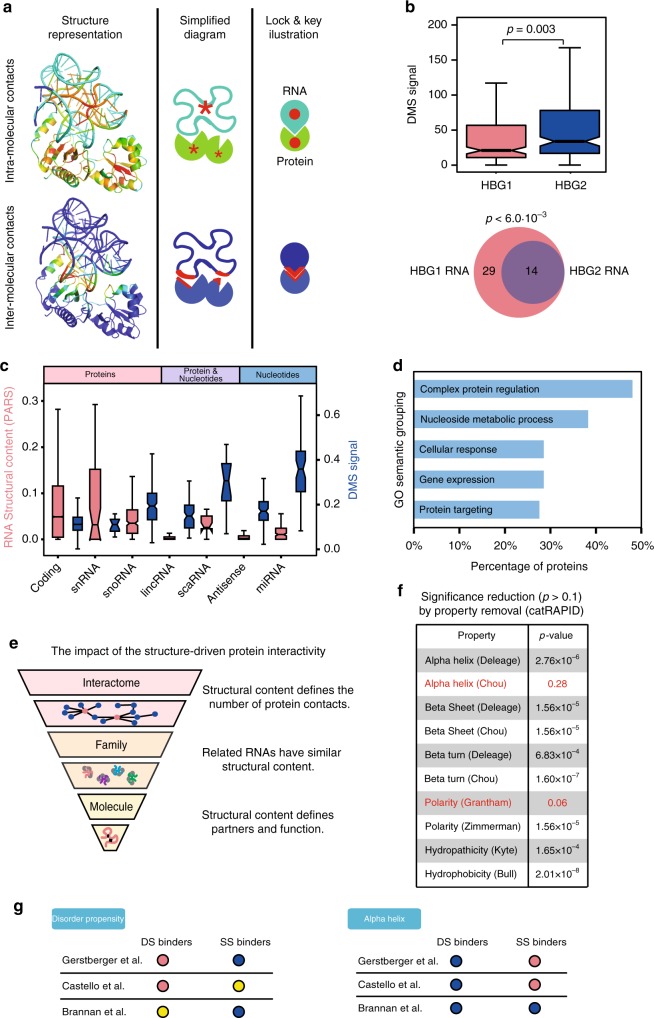
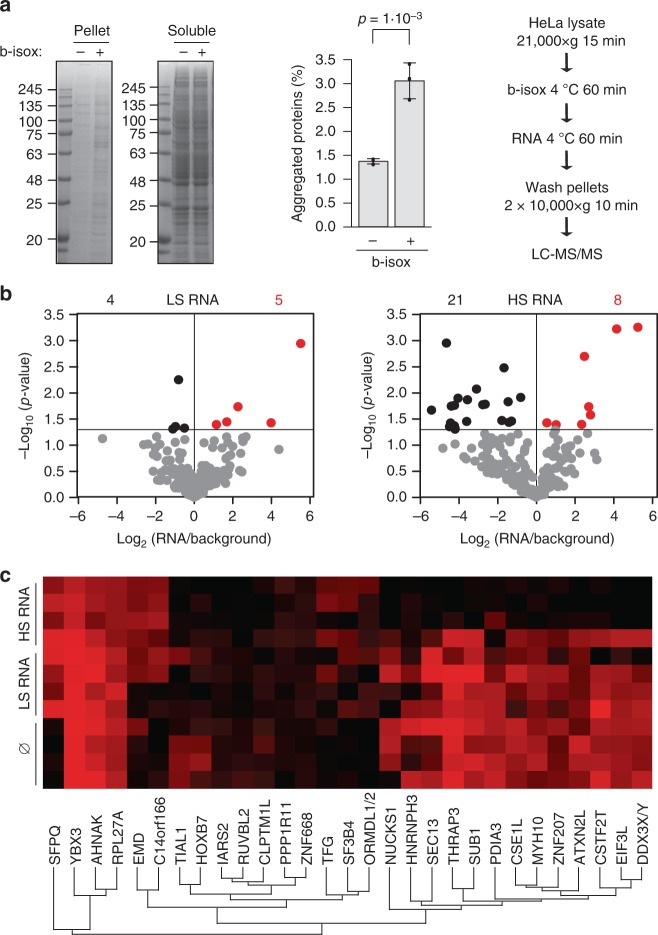
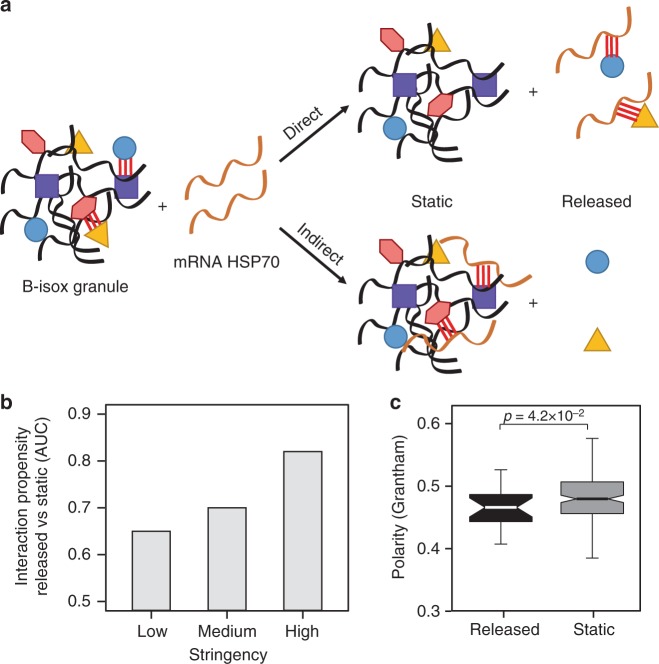
The combination of high-throughput sequencing and in vivo crosslinking approaches leads to the progressive uncovering of the complex interdependence between cellular transcriptome and proteome. Yet, the molecular determinants governing interactions in protein-RNA networks are not well understood. Here we investigated the relationship between the structure of an RNA and its ability to interact with proteins. Analysing in silico, in vitro and in vivo experiments, we find that the amount of double-stranded regions in an RNA correlates with the number of protein contacts. This relationship -which we call structure-driven protein interactivity- allows classification of RNA types, plays a role in gene regulation and could have implications for the formation of phase-separated ribonucleoprotein assemblies. We validate our hypothesis by showing that a highly structured RNA can rearrange the composition of a protein aggregate. We report that the tendency of proteins to phase-separate is reduced by interactions with specific RNAs.


Conflict of interest statement

The authors declare no competing interests.

Figures

Fig. 1
Fig. 1
The amount of protein structure correlates with the number of interactions. a Cumulative distribution function (CDF) for the secondary structure content of all human RNAs measured by parallel analysis of RNA structure (PARS),. Vertical lines indicate a certain fraction (X%) of RNAs with the lowest secondary content (LS; blue) and the same fraction with the highest secondary content (HS; pink). b catRAPID predictions of protein interactions with human RNAs ranked by structural content measured by PARS (118 RNA-binding proteins (RBPs) for which enhanced crosslinking and immunoprecipitation (eCLIP) information is also available). The fractions 10%, 15%, …, 50% refer to the comparison between equal-size HS and LS sets. The results indicate that catRAPID is able to distinguish HS and LS groups significantly and consistently through the different fractions (p value <10–16; Kolmogorov–Smirnov (KS) test). The boxes show the interquartile range (IQR), the central line represents the median, the whiskers add 1.5 times the IQR to the 75 percentile (box upper limit) and subtract 1.5 times the IQR from the 25 percentile (box lower limit). s.d. is shown. c Relationship between number of protein interactions (eCLIP) and structural content measured by PARS. The fitting line corresponds to the formula y = exp(α + βx), where α = −0.75; β = 0.67; p value estimated with KS test. d Relationship between number of protein interactions and structural content measured by dimethyl sulfate modification (DMS). The fitting line corresponds to the formula y = 1/(α + βx), where α = 2.60; β = 87.36; p value estimated with KS test. e Structural preferences of RBPs measured with three different CLIP techniques (photoactivatable ribonucleoside-enhanced CLIP (PAR-CLIP), high-throughput sequencing-CLIP (HITS-CLIP) and individual nucleotide resolution CLIP (iCLIP)). The colour indicates the RNA-binding preference of each protein: pink, high structured; blue, low structured; grey, no preference. f Correlation between structural content (CROSS predictions of icSHAPE experiments) and protein interactions of eight transcripts revealed by protein microarrays (Pearson’s correlation). s.d. is shown. g Analysis of Protein Data Bank (PDB) structures containing protein–RNA complexes reveals a trend between protein (inter) and RNA (intra) contacts (196 different pairs; Pearson’s correlation)
Fig. 2
Fig. 2
Functional footprints of the RNA structure-driven protein interactivity. a Scheme showing the role of intra- and intermolecular contacts in a RNA–protein complex. Top, intramolecular contacts. Bottom, inter-molecular contacts. The number of contacts range is indicated with shades from dark blue (lowest) to red (highest). b Up, Structural content (dimethyl sulfate modification (DMS); p value estimated with KS test). Bottom, Protein interactions (enhanced CrossLinking and ImmunoPrecipitation (eCLIP) of haemoglobin subunit γ1 (HBG1) (pink) and haemoglobin subunit γ2 (HBG2) (blue) RNAs (99.3% of sequential identity); the empirical p value was estimated by comparing the overlap with that of 1000 samples taken from eCLIP RNA-binding proteins (RBPs). c Parallel analysis of RNA structure (PARS) (pink) and DMS (blue) structural content of different RNA types (Ensembl). d Semantic grouping of gene ontology terms associated to the least and most structured RNAs (100 less structured (LS) vs. 100 high structured (HS) transcripts) using cleverGO. e Through the analysis of individual RNAs (Figs. 1 and 2b) we found that the structural content is linked to the number of partners and function of an RNA. Our analysis indicates that functionally related RNAs have similar structural content (Fig. 2c). The structure-driven protein interactivity is an intrinsic property associated with the RNA that can be traced at any regulatory level. f Each row shows the catRAPID interaction propensities caused by removing a physicochemical property,. The removal of α-helix (Chou) and polarity (Grantham) reduce the ability to distinguish between HS and LS (p values estimated with KS test). g multicleverMachine analysis of the physicochemical properties of three RBP sets and proteins annotated in UniProt as binders of double-stranded RNAs (DS) or single-stranded RNAs (SS) (see Methods). ‘Disorder propensity’ and ‘α-helix’ are the properties showing significant difference and opposite results between DS and SS binders for at least two RBP databases (blue or pink indicate that DS or SS are enriched or depleted; yellow indicates no significant differences between the sets). In b, c, the boxes show the interquartile range (IQR), the central line represents the median, the notches the 95% confidence interval of the median, the whiskers add 1.5 times the IQR to the 75 percentile (box upper limit) and subtract 1.5 times the IQR from the 25 percentile (box lower limit). S.d. is shown
Fig. 3
Fig. 3
Relationship between RNA structure and protein contacts for chaperones. a Contacts of RNAs coding for protein chaperones, measured by enhanced CrossLinking and ImmunoPrecipitation (eCLIP), and physical interactions of the corresponding coded proteins, collected from BioGRID; p value estimated with KS test. b Comparison between parallel analysis of RNA structure (PARS) structural content and physical interactions of the encoded proteins, collected at BioGRID, for the entire transcriptome. The transcriptome was divided in five consecutive sets containing each 20% of the transcriptome. The sets were selected regarding their PARS structural content, the range of each set from left to right are: −10.7 to −4.6; −4.6 to −3.1; −3.1 to −2.4; −2.4 to −1.9; −1.9 to −0.5. The last boxplot shows the distribution of the number of physical interactors retrieved from BioGRID for the chaperone protein family (heat-shock proteins). c PARS measurement of the secondary structure content of HS (HSP70, pink) and LS (BRaf, blue) transcripts. Vertical dashed lines indicate untranslated regions (UTRs). d PARS secondary structure content of HS and LS transcripts (p value estimated with KS test). e Venn diagram showing the overlap between protein interactions, measured by eCLIP, of HS and LS RNAs (empirical p value <6 × 10–3; estimated by comparing with the distribution of 1000 overlaps of sets sampled from eCLIP RBPs). f Prediction of protein binding propensity of HS and LS RNAs using catRAPID, (p value estimated with KS test). For b, d, f, the boxes show the interquartile range (IQR), the central line represents the median, the notches the 95% confidence interval of the median, the whiskers add 1.5 times the IQR to the 75 percentile (box upper limit) and subtract 1.5 times the IQR from the 25 percentile (box lower limit). S.d. is shown
Fig. 4
Fig. 4
Structured RNA reduces protein aggregation in vitro. a Biotinylated isoxazole (b-isox)-driven aggregation of HeLa protein lysate in vitro. Left, Coomassie-stained gels, one representative experiment shown (uncropped gels are presented in the Supplementary Fig. 10). Centre, aggregated protein intensity was quantified and the difference evaluated using two-tailed t test (p = 1 ×1 0–3; N = 3 biological replicates shown as dots in the image). S.d. is shown. Right, experimental scheme. The aggregation efficacy was tested by comparing the resultant precipitate in the presence or absence of b-isox, this is indicated by a+ or a–, respectably. b Volcano plots indicate the p values (Perseus measure) of the individual protein enrichments in b-isox assembly (N = 4 independent biological replicates). The statistical significance threshold is marked by a horizontal line (see also Supplementary Data 5). Black dots are proteins with significantly decreased concentration after the RNA incubation. Red dots are proteins with significantly increased concentration after the RNA incubation. c Colour-coded label-free quantitation (LFQ) intensities of proteins affected by the high structured (HS) RNA on a scale from black (low) to red (high). Hierarchical clustering by Perseus is indicated. For comparison, the LFQ intensities of the same proteins in control and in the presence of the LS RNA are plotted as well
Fig. 5
Fig. 5
Interactions within the ribonucleoprotein condensate. a The release of proteins from the biotinylated isoxazole (b-isox) assembly could be the outcome of: (1) an indirect process, resulting from an interaction competition between RNA and the protein aggregate or (2) a direct process, resulting from protein sequestration by RNA. b catRAPID performances improve with the stringency of the b-isox experiments (Methods), suggesting a direct recruitment of proteins rescued by high structured (HS) RNA. The false discovery rate (FDR) becomes highly significant for the most-stringent experimental set (FDR = 0.1). c ‘Released’ proteins (black box) are less polar than ‘static’ ones (grey box), in agreement with our computational analysis (p value = 4.7 × 10–2, p value estimated with KS test; see also Fig. 2f, g). Released and static proteins correspond to the black and grey dots of Fig. 4b right panel. The boxes show the interquartile range (IQR), the central line represents the median, the notches the 95% confidence interval of the median, the whiskers add 1.5 times the IQR to the 75 percentile (box upper limit) and subtract 1.5 times the IQR from the 25 percentile (box lower limit). S.d. is shown

References

    1. Vandivier LE, Anderson SJ, Foley SW, Gregory BD. The conservation and function of RNA secondary structure in plants. Annu. Rev. Plant Biol. 2016;67:463–488. doi: 10.1146/annurev-arplant-043015-111754. - DOI - PMC - PubMed
    1. Kashi K, Henderson L, Bonetti A, Carninci P. Discovery and functional analysis of lncRNAs: methodologies to investigate an uncharacterized transcriptome. Biochim. Biophys. Acta. 2016;1859:3–15. doi: 10.1016/j.bbagrm.2015.10.010. - DOI - PubMed
    1. Okazaki Y, et al. Analysis of the mouse transcriptome based on functional annotation of 60,770 full-length cDNAs. Nature. 2002;420:563–573. doi: 10.1038/nature01266. - DOI - PubMed
    1. Quinn EM, et al. Development of strategies for SNP detection in RNA-seq data: application to lymphoblastoid cell lines and evaluation using 1000 Genomes data. PLoS ONE. 2013;8:e58815. doi: 10.1371/journal.pone.0058815. - DOI - PMC - PubMed
    1. Djebali S, et al. Landscape of transcription in human cells. Nature. 2012;489:101–108. doi: 10.1038/nature11233. - DOI - PMC - PubMed

Publication types