. 2019 Jul 19;10(1):3215.
doi: 10.1038/s41467-019-11053-8.

Deletion of a Csf1r enhancer selectively impacts CSF1R expression and development of tissue macrophage populations

Affiliations

Deletion of a Csf1r enhancer selectively impacts CSF1R expression and development of tissue macrophage populations

Rocío Rojo et al. Nat Commun. .

Abstract

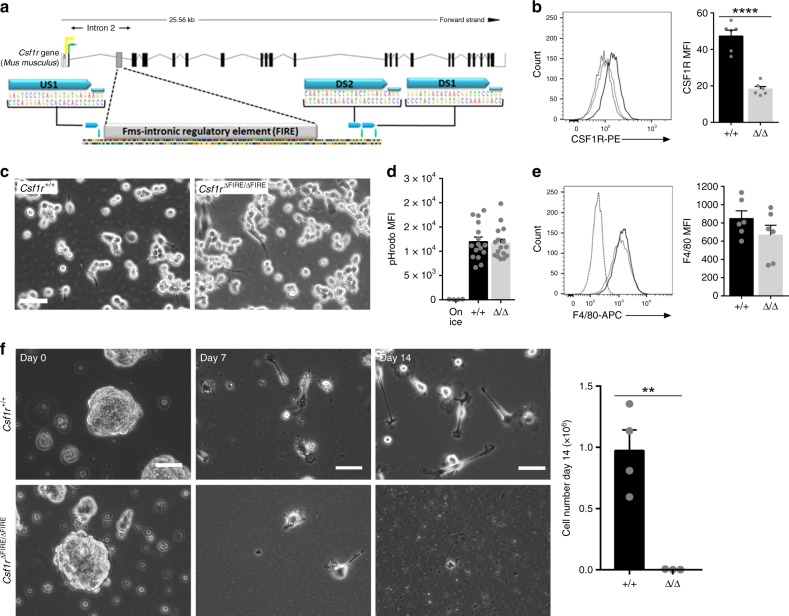
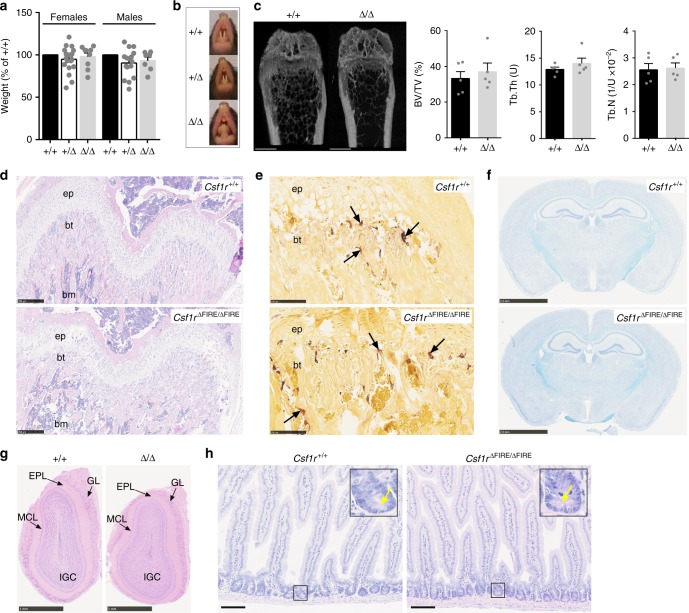
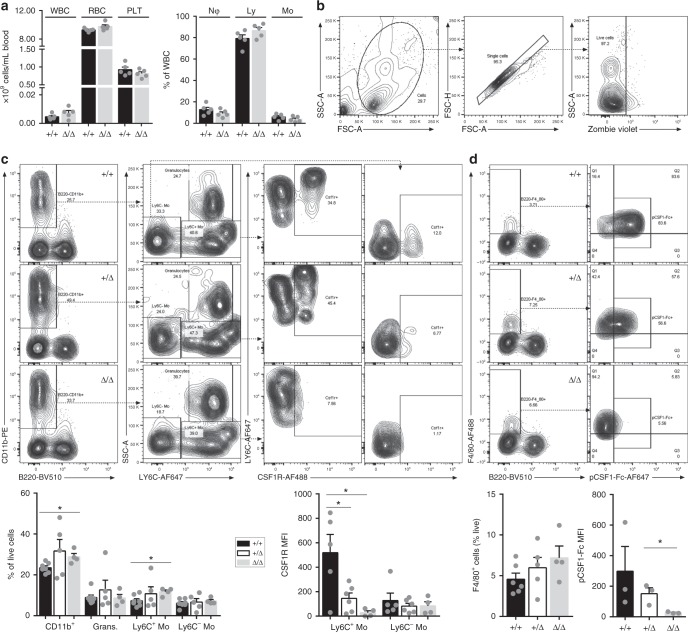
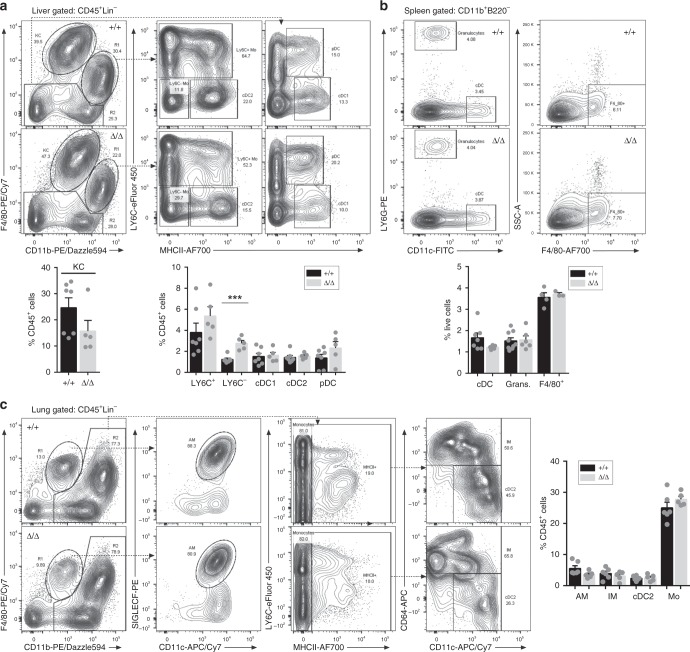
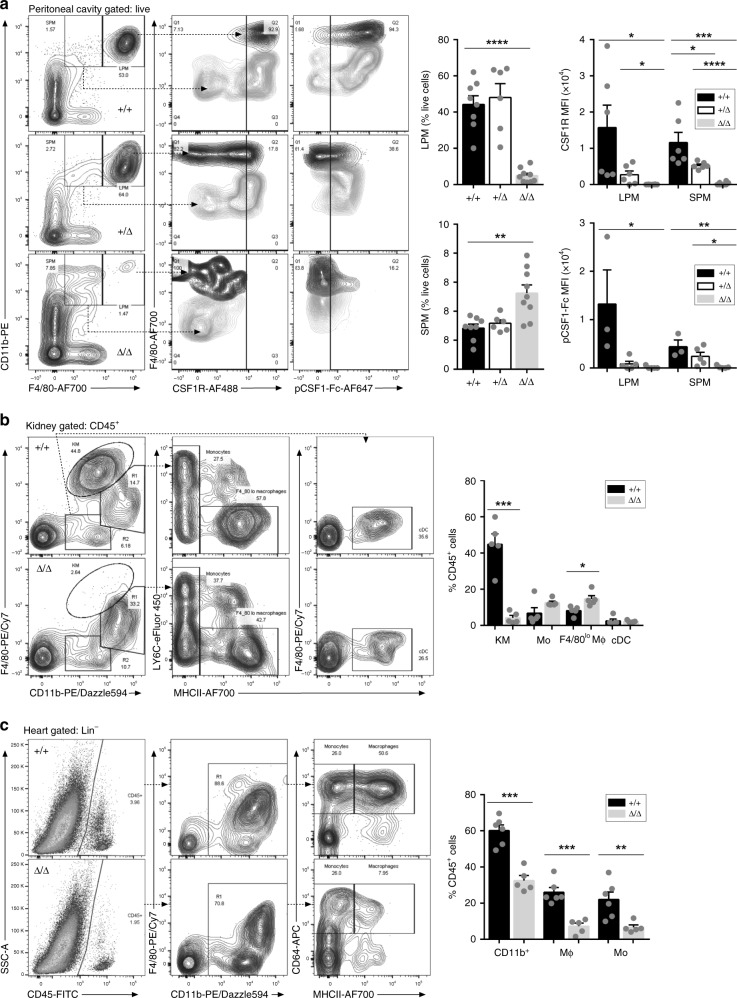
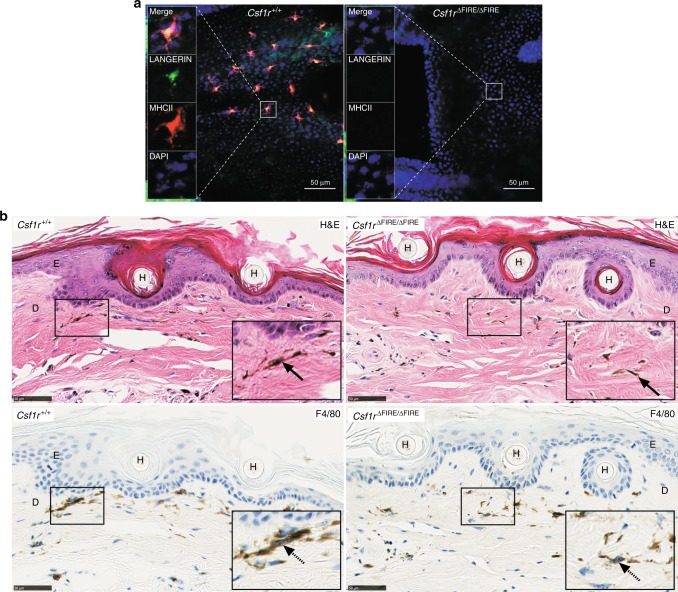
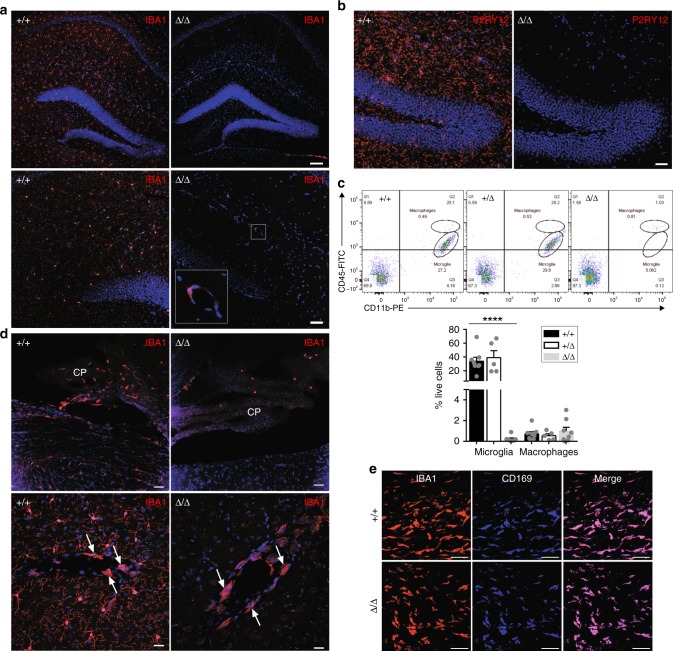
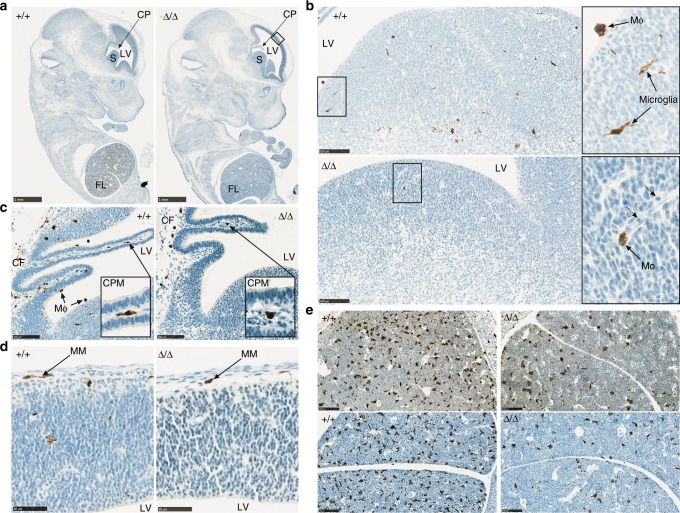
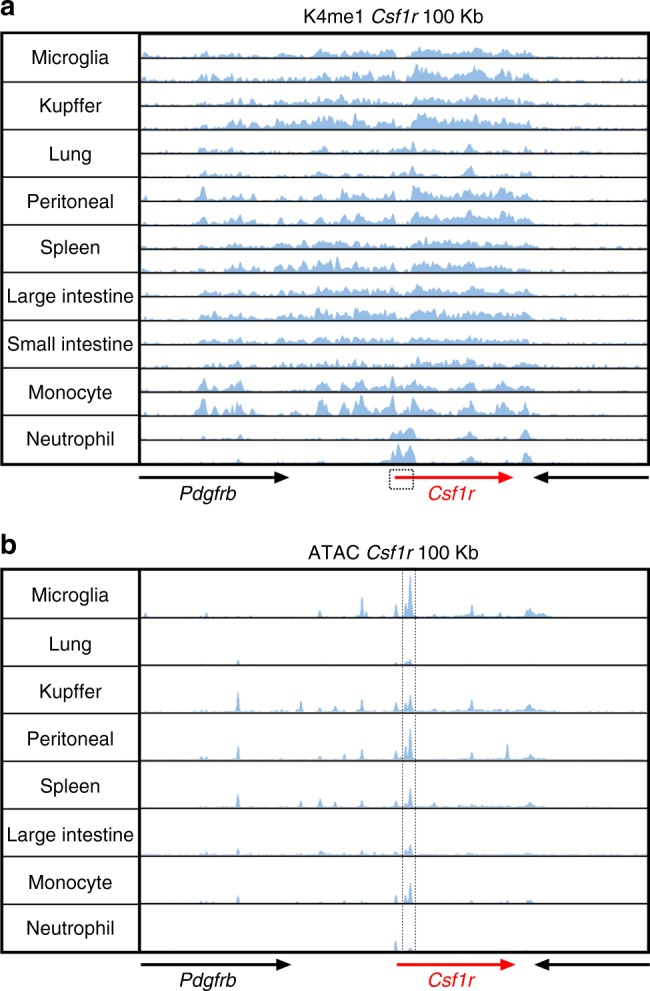
The proliferation, differentiation and survival of mononuclear phagocytes depend on signals from the receptor for macrophage colony-stimulating factor, CSF1R. The mammalian Csf1r locus contains a highly conserved super-enhancer, the fms-intronic regulatory element (FIRE). Here we show that genomic deletion of FIRE in mice selectively impacts CSF1R expression and tissue macrophage development in specific tissues. Deletion of FIRE ablates macrophage development from murine embryonic stem cells. Csf1rΔFIRE/ΔFIRE mice lack macrophages in the embryo, brain microglia and resident macrophages in the skin, kidney, heart and peritoneum. The homeostasis of other macrophage populations and monocytes is unaffected, but monocytes and their progenitors in bone marrow lack surface CSF1R. Finally, Csf1rΔFIRE/ΔFIRE mice are healthy and fertile without the growth, neurological or developmental abnormalities reported in Csf1r-/- rodents. Csf1rΔFIRE/ΔFIRE mice thus provide a model to explore the homeostatic, physiological and immunological functions of tissue-specific macrophage populations in adult animals.


Conflict of interest statement

The authors declare no competing interests.

Figures

Fig. 1
Fig. 1
FIRE deletion reduced CSF1R expression and prevented macrophage differentiation. a Schematic of Csf1r gene and location of gRNAs (US1, DS1, DS2), targeting FIRE. Protospacer adjacent motifs (PAM) are located to the right of each gRNA. Black boxes = coding exons, white boxes = untranslated regions, lines connecting exons = intronic sequences, yellow and green arrows = trophoblast/osteoclast promoter and macrophage transcription start sites, respectively. b Flow cytometry analysis of total CSF1R in fixed and permeabilized RAW 264.7 cell clones. Histograms are representative of three clones per genotype, from two repeat experiments in duplicate. MFI median fluorescence intensity, black line = +/+, gray line = Δ/Δ, dotted line = isotype control. P ≤ 0.0001 (****). c CRISPR-treated Csf1r+/+ and Csf1rΔFIRE/ΔFIRE RAW 264.7 cells cultured in vitro. Scale bar = 50 µm. d A phagocytosis assay was performed with RAW 264.7 cells and pHrodo® Red E. coli BioParticles® followed by flow cytometry analysis. n = 4 clones per genotype from two repeat experiments. MFI median fluorescence intensity. e Flow cytometry analysis of surface F4/80 in RAW 264.7 cell clones. Histograms are representative of three clones per genotype from two repeat experiments in duplicate. f Csf1r+/+ and Csf1rΔFIRE/ΔFIRE E14 ESC clones were differentiated into macrophages with mIL3 and rhCSF1. Scale bars = 200 µm (Day 0, embryoid bodies) and 50 µm (Days 7 and 14). n = 3 clones per genotype, P = 0.005 (**). All source data are provided within a Source Data excel file. Graphs show mean + SEM and P values were determined by two-tailed t-tests
Fig. 2
Fig. 2
FIRE-deficient mice displayed none of the gross phenotypes found in Csf1r−/−-mice. a Mice were weighed between 2 and 11 weeks of age. n = 7, 20, 9 (females) and 5, 16, 7 (males) for +/+, +/Δ, and Δ/Δ, respectively. b Representative images of tooth eruption in adult mice. c Femurs from 4-week-old male and female mice were scanned by Micro-CT. Scale bars = 1 mm. n = 5 mice per genotype. BV/TV bone volume over total volume (bone density), Tb.Th trabecular thickness, Tb.N trabecular number. d Hematoxylin and eosin (H&E) staining of sections of bone. Images are representative of six mice per genotype; ep epiphyseal plate, bt bony trabeculae, bm bone marrow. Scale bar = 250 µm. e Femurs from the same cohort of mice above were stained for tartrate-resistant acid phosphatase (TRAP). Arrows point to TRAP+ osteoclasts. Scale bar = 100 µm. f Luxol Fast Blue staining of paraffin-embedded formalin-fixed adult brains. Images are representative of three mice per genotype. Scale bar = 2.5 mm. g H&E staining of olfactory bulbs from adult mice. Images are representative of six mice per genotype. EPL external plexiform layer, GL glomerular layer, IGC internal granular cell layer of the olfactory bulbs, MCL mitral cell layer. Scale bar = 1 mm. h H&E staining of sections of duodenum from adult mice. Yellow arrows point to Paneth cells. Images are representative of six mice per genotype. Scale bar = 100 µm. All source data are provided within a Source Data excel file. Graphs show mean + SEM
Fig. 3
Fig. 3
FIRE deletion reduced functional CSF1R expression in blood. a Cell populations in whole blood of 11–13-week-old Csf1rΔFIRE/ΔFIRE mice (Δ/Δ) and controls (+/+) were quantified using an automated hematology analyzer. n = 5 mice per genotype. WBC white blood cells, RBC red blood cells, PLT platelets, Nφ neutrophils, Ly lymphocytes, Mo monocytes. b Whole EDTA-blood from 11 to 13-week-old mice was analyzed by flow cytometry. Plots show the representative gating strategy to identify live single cells for subsequent analysis. c Myeloid cells were identified as CD11b+B220 (Panel 1) then separated by LY6C and SSC to identify granulocytes (LY6C+SSChi, panel 2). The LY6C+ and LY6Clo monocyte populations were then analyzed for CSF1R expression (Panels 3 and 4, respectively). n = 7+/+, 5+/Δ, and 4 Δ/Δ from four experiments. For % of live cells P = 0.012 (*CD11b+) and 0.019 (*LY6C+ Mo). For median fluorescence intensity (MFI) of CSF1R P = 0.027 (*+/+ vs. +/Δ), and 0.022 (*+/+ vs. Δ/Δ). Grans. granulocytes, Mo monocyte. d F4/80+B220 myeloid cells were analyzed for binding of CSF1 (pCSF1-FcAF647). n = 3 mice per genotype from four experiments. P = 0.033 (*). All source data are provided within a Source Data excel file. Graphs show mean + SEM and P values were determined by two-tailed t-tests
Fig. 4
Fig. 4
Macrophage populations in liver, spleen, and lungs are unaffected in FIRE-deficient mice. a Leukocyte populations were analyzed from enzymatically digested livers from mice aged between 8 and 10 weeks. Flow cytometry profiles show representative Csf1r+/+ (+/+) and Csf1rΔFIRE/ΔFIRE (Δ/Δ) mice using the gating strategy described by Hawley et al.. Kupffer cells (KC) were identified as CD45+, lineage (Lin-; CD3CD19LY6G) and F4/80hiCD11blo (Panel 1). F4/80lo/CD11bhi and F4/80/CD11b populations were further separated on the basis of LY6C and MHCII expression (Panels 2 and 3). Mo monocyte, cDC conventional dendritic cell, pDC plasmacytoid dendritic cell. n = 7+/+ and 5 Δ/Δ from 3 repeat experiments. P = 0.0002 (***). b Leukocyte populations were analyzed from enzymatically digested spleens from mice aged between 8 and 10 weeks. The flow cytometry profiles show representative Csf1r+/+ (+/+) and Csf1rΔFIRE/ΔFIRE (Δ/Δ) mice. Conventional dendritic cells (cDC) were identified as CD11b+B220CD11c+LY6G and granulocytes as CD11b+B220CD11cLY6G+ (Panel 1). Red pulp macrophages were identified as CD11b+B220F4/80+SSClo (Panel 2). n = 3–9 mice per genotype from 4 repeat experiments. c Single cell suspensions of digested lungs were analyzed by flow cytometry as described above for the liver using the same cohort of mice. Alveolar macrophages (AM) were defined as F480+CD11blo (Panel 1) and CD11c+SIGLECF+ (Panel 2). The CD11b+F4/80−/+ cells were further analyzed to define the monocytes (Mo, MHCIILY6C−/+, Panel 3), interstitial macrophages (IM, MHCII+CD11c−/+CD64+) and conventional dendritic cells subset 2 (cDC2, MHCII+CD11c+CD64) in Panel 4. All source data are provided within a Source Data excel file. Graphs show mean + SEM and P values were determined by two-tailed t-tests
Fig. 5
Fig. 5
FIRE deletion results in loss of macrophages in the peritoneal cavity, kidney, and heart. a Flow cytometry profiles show peritoneal cells from representative Csf1r+/+ and Csf1rΔFIRE/ΔFIRE mice using the gating strategy described by Bain et al.. Small peritoneal macrophages (SPM) were identified as F4/80loCD11b+ and large peritoneal macrophages (LPM) as F4/80hiCD11b+ (Panel 1). These populations were analyzed for CSF1R expression (Panel 2) and binding of pCSF1-Fc (Panel 3). n = 8 +/+, 6+/Δ and 9 Δ/Δ mice aged between 10 and 15 weeks, from five experiments. P = 0.012–0.048 (*), 0.002–0.006 (**), 0.001 (***) and <0.0001 (****). b Leukocyte populations were isolated from enzymatically digested kidneys and gated for CD45 expression. The flow cytometry profiles show analysis of representative Csf1r+/+ and Csf1rΔFIRE/ΔFIRE mice. Kidney macrophages (KM) were identified as F4/80hiCD11blo (Panel 1), pooled LY6C−/+ monocytes (Mo) as F4/80loMHCII (Panel 2), putative monocyte-derived macrophages as F4/80loMHCII+ (Panel 2), and conventional dendritic cells (cDC) as F4/80CD11bloMHCII+ (Panel 3). n = 5 mice per genotype aged 8–10 weeks, from three experiments. P = 0.015 (*) and 0.0001 (***). c Single cell suspensions of enzymatically digested hearts from the same cohort were analyzed by flow cytometry. Cells were gated lineage (Lin = CD3/CD19/LY6G). n = 6+/+ and 5 Δ/Δ from three experiments. MΦ macrophage, Mo monocyte. P = 0.009 (**), 0.0003 (*** MΦ), and 0.0001 (*** CD11b+). All source data are provided within a Source Data excel file. Graphs show mean + SEM and P values were determined by two-tailed t-tests
Fig. 6
Fig. 6
The deletion of FIRE results in loss of Langerhans cells. a Whole-mount epidermal tail sheets were stained with antibodies against LANGERIN (green) and MHCII (red). Nuclei were stained with DAPI (blue). Images are representative of four mice per genotype, aged between 8 and 10 weeks. Scale bars = 50 µm. b Decalcified tails from the same cohort of mice above were stained with hematoxylin and eosin (H&E, upper panel) and an antibody against F4/80 (lower panel). E epidermis, D dermis, H hair follicle. Scale bars = 50 µm
Fig. 7
Fig. 7
FIRE deletion results in selective loss of microglia. a Cryosections of adult brains were stained with an antibody against IBA1. Boxed area shows an IBA1+ perivascular macrophage in the Csf1rΔFIRE/ΔFIRE mouse brain. Scale bars = 100 µm, 50 µm in the upper and lower panels, respectively. Images are representative of four mice per genotype. b Cryosections of adult brains were stained with an antibody against P2RY12. Scale bar = 40 µm. c Single cell suspensions of myelin-depleted brains from males and females aged 10 weeks to 9 months were analyzed by flow cytometry for CD45 and CD11b expression as per. Microglia = CD45lowCD11b+. Macrophages = CD45+CD11b+. n = 8+/+, 5+/Δ, 8 Δ/Δ from five experiments. P < 0.0001 (****) Δ/Δ compared to +/+. d Cryosections of adult brains stained with an antibody against IBA1 using the same cohort of mice in a and b. Upper panel shows the choroid plexus (CP) and white arrows point to perivascular macrophages in the lower panel. Images are representative of three mice. Scale bars = 40 and 20 µm in the upper and lower panels, respectively. e Dissected meningeal dura mater was stained with antibodies against IBA1 and CD169. Images are representative of two mice per genotype. Scale bars = 50 µm. All source data are provided within a Source Data excel file. Graphs show mean + SEM and P values were determined by two-tailed t-tests
Fig. 8
Fig. 8
FIRE deletion results in a reduction of embryonic macrophages. a Formalin-fixed paraffin-embedded embryos (E13) were stained with antibodies against IBA1. Images are representative of seven embryos per genotype at E12, E12.5, and E13 and four repeat experiments. CP choroid plexus, LV lateral ventricle, S striatum, FL fetal liver. Black rectangle indicates the area magnified for panel d. Scale bar = 1 mm. b View of the striatum from E12.5 embryos highlighting IBA1+ microglia and ventricular macrophages (MΦ) in the control embryo and a monocyte (Mo) in the FIRE deficient embryo. Dotted arrows point to immature red blood cells in a blood vessel. Scale bar = 100 µm. c Images of the choroid plexus in the lateral ventricle (LV) of E12.5 embryos. CPM choroid plexus macrophage, MΦ ventricular macrophages, CF choroidal fissure. Scale bar = 100 µm. d IBA1+ meningeal macrophages (MM) in the forebrain (boxed area in panel a) of control and Csf1rΔFIRE/ΔFIRE embryos at E12.5. Scale bar = 50 µm. e IBA1+ fetal liver monocytes at E12 and E13 in upper and lower panels, respectively. Scale bar = 100 µm
Fig. 9
Fig. 9
Chromatin landscape of the mouse Csf1r locus. ChIP-seq and ATAC-seq data for the 100 kb window surrounding mouse Csf1r for each of the isolated myeloid cell populations shown was extracted from the primary data generated in Lavin et al.. a ChIP-seq data showing the location of poised enhancers (H3K4me1). The boxed area indicates the 3.5 kb promoter region used in the production of Csf1r reporter genes. b ATAC-seq data showing the locations of open chromatin. The dotted lines surround the double peak in the second intron; the more prominent peak is FIRE

References

    1. Sherr CJ, et al. The c-fms proto-oncogene product is related to the receptor for the mononuclear phagocyte growth factor, CSF-1. Cell. 1985;41:665–676. doi: 10.1016/S0092-8674(85)80047-7. - DOI - PubMed
    1. Garceau V, et al. Pivotal advance: avian colony-stimulating factor 1 (CSF-1), interleukin-34 (IL-34), and CSF-1 receptor genes and gene products. J. Leukoc. Biol. 2010;87:753–764. doi: 10.1189/jlb.0909624. - DOI - PubMed
    1. Wang T, et al. Identification of IL-34 in teleost fish: differential expression of rainbow trout IL-34, MCSF1 and MCSF2, ligands of the MCSF receptor. Mol. Immunol. 2013;53:398–409. doi: 10.1016/j.molimm.2012.09.008. - DOI - PubMed
    1. Dai XM, et al. Targeted disruption of the mouse colony-stimulating factor 1 receptor gene results in osteopetrosis, mononuclear phagocyte deficiency, increased primitive progenitor cell frequencies, and reproductive defects. Blood. 2002;99:111–120. doi: 10.1182/blood.V99.1.111. - DOI - PubMed
    1. Pridans C, et al. Pleiotropic impacts of macrophage and microglial deficiency on development in rats with targeted mutation of the Csf1r locus. J. Immunol. 2018;201:2683–2699. doi: 10.4049/jimmunol.1701783. - DOI - PMC - PubMed

Publication types

MeSH terms

Substances