. 2019 Jul 19;10(1):3222.
doi: 10.1038/s41467-019-11181-1.

Genetic mapping of cell type specificity for complex traits

Affiliations

Genetic mapping of cell type specificity for complex traits

Kyoko Watanabe et al. Nat Commun. .

Erratum in

Abstract

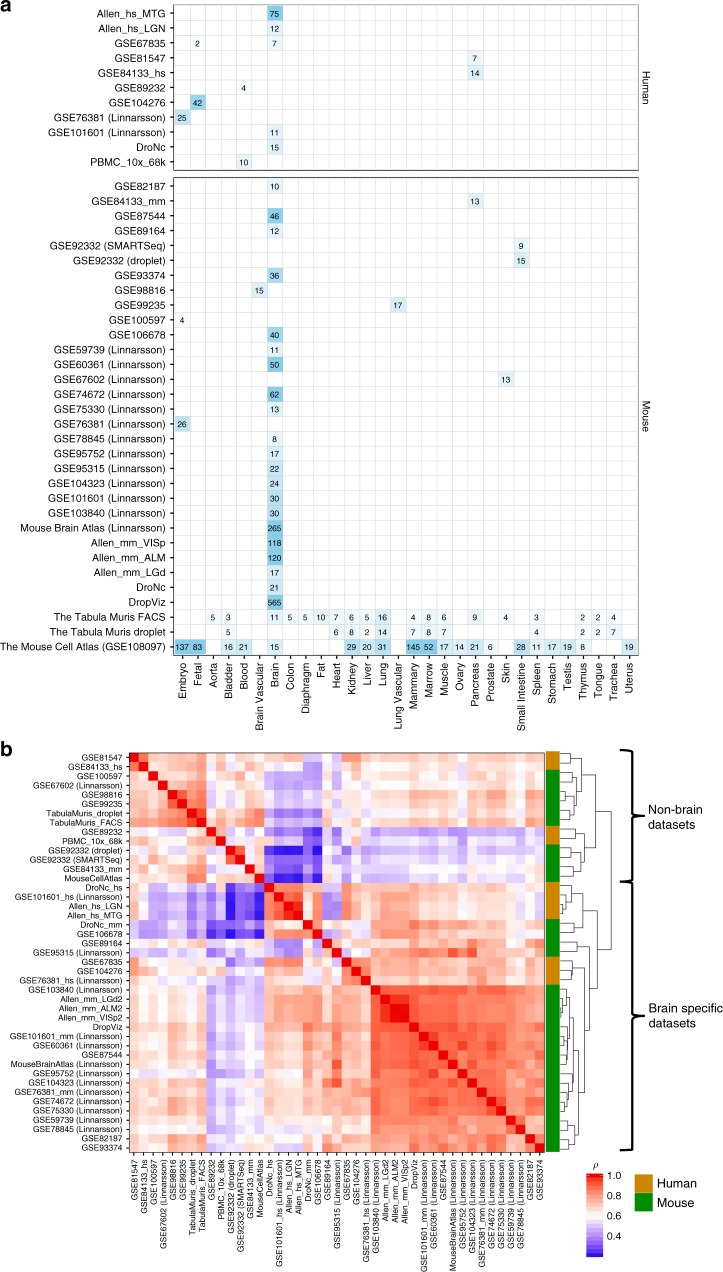
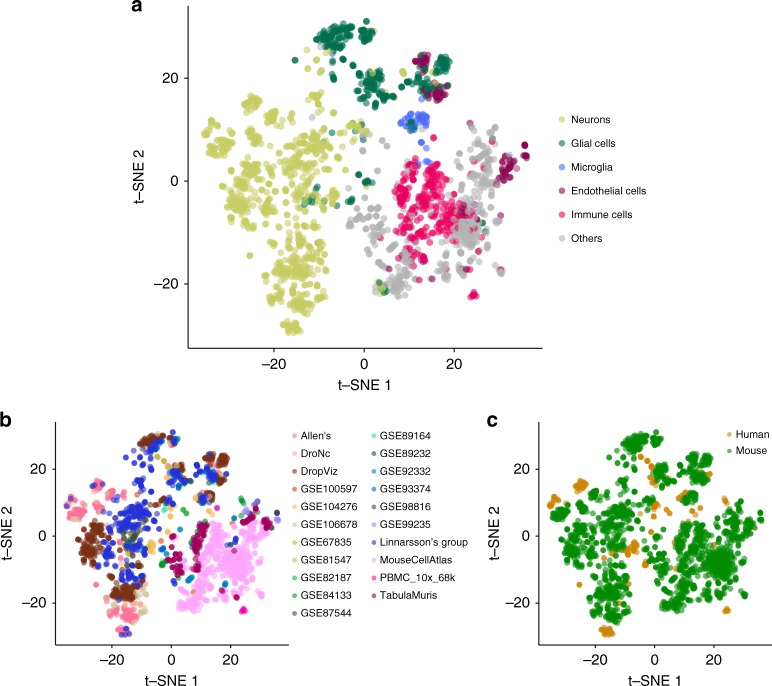
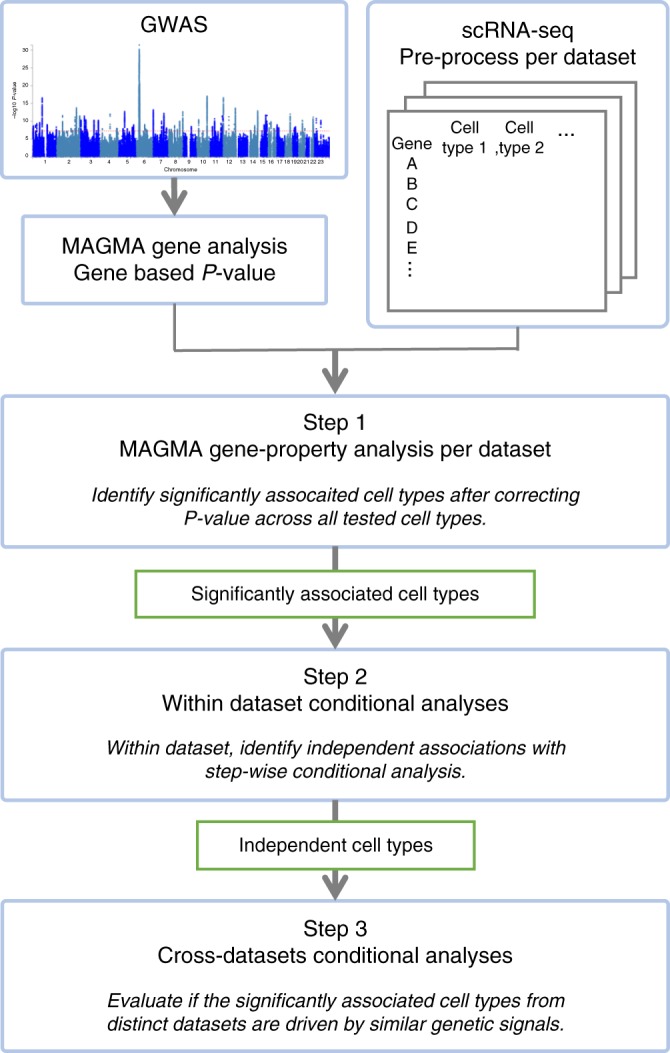
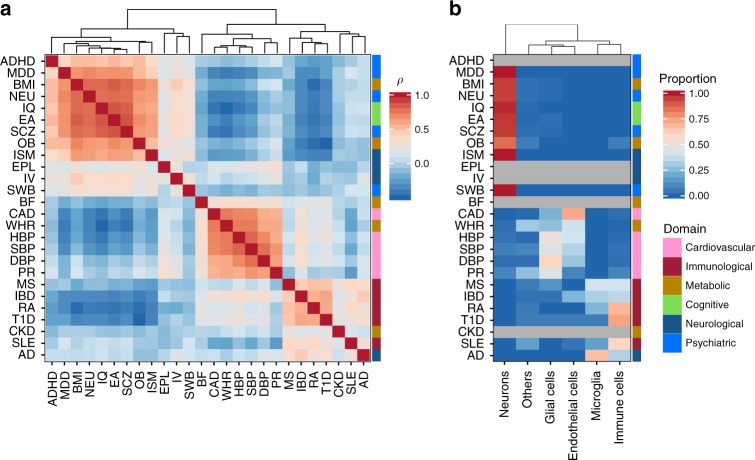
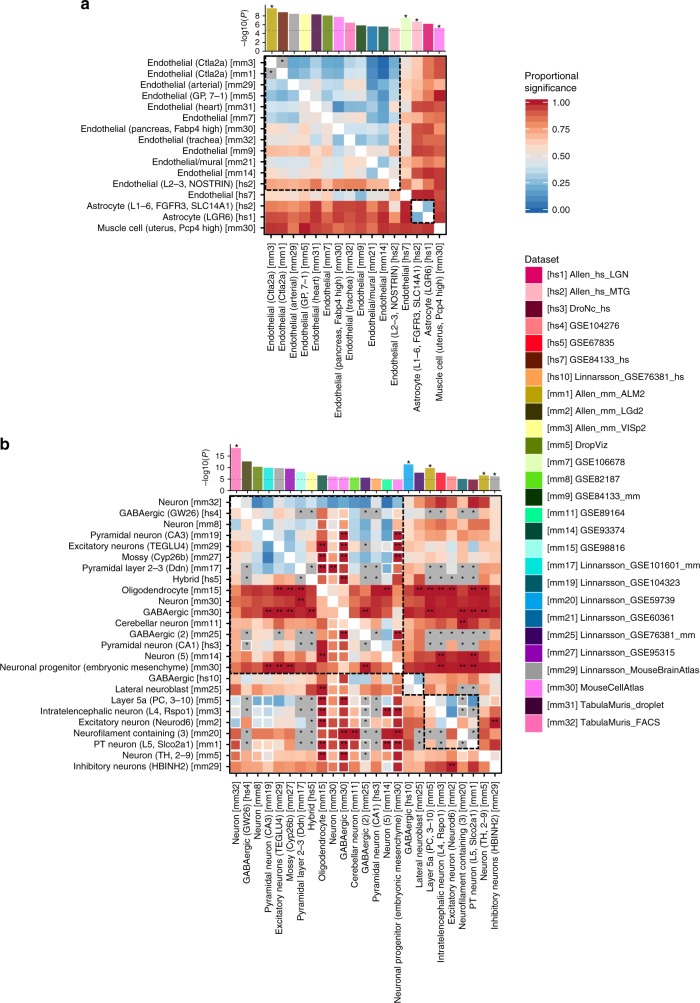
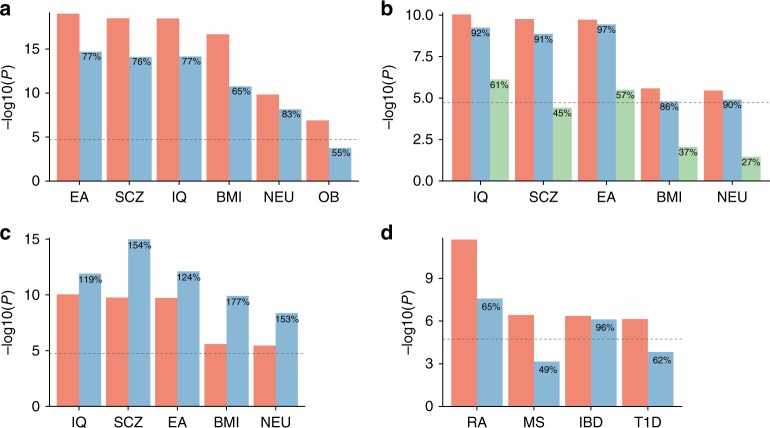
Single-cell RNA sequencing (scRNA-seq) data allows to create cell type specific transcriptome profiles. Such profiles can be aligned with genome-wide association studies (GWASs) to implicate cell type specificity of the traits. Current methods typically rely only on a small subset of available scRNA-seq datasets, and integrating multiple datasets is hampered by complex batch effects. Here we collated 43 publicly available scRNA-seq datasets. We propose a 3-step workflow with conditional analyses within and between datasets, circumventing batch effects, to uncover associations of traits with cell types. Applying this method to 26 traits, we identify independent associations of multiple cell types. These results lead to starting points for follow-up functional studies aimed at gaining a mechanistic understanding of these traits. The proposed framework as well as the curated scRNA-seq datasets are made available via an online platform, FUMA, to facilitate rapid evaluation of cell type specificity by other researchers.


Conflict of interest statement

The authors declare no competing interests.

Figures

Fig. 1
Fig. 1
Overview of curated scRNA-seq dataset and comparison across datasets. a Available tissue types of samples and the number of the cell types defined in each scRNA-seq dataset. The displayed number of cell types is the largest possible number of cell types in the dataset after removing uninformative cell type labels. b Pair-wise Spearman’s rank correlation of the average expression across cell types between datasets
Fig. 2
Fig. 2
2D projection of cell type similarity based on cell-specific gene expression. Each data point represents a cell type from a dataset. There are 2,679 data points and these are colored by six main categories of cell types (a), dataset (b), and specie of the samples (c). The full results are available in Supplementary Data 3
Fig. 3
Fig. 3
Flowchart of cell type specificity analysis using multiple scRNA-seq resources with MAGMA
Fig. 4
Fig. 4
Similarity of cell type association patterns across 26 traits. a Pair-wise Spearman’s rank correlation of cell type association P-values from step 1. Traits are clustered based on the pair-wise correlation matrix using the hierarchical clustering. b Significantly associated main category of cell types per trait. The heatmap is colored by the proportion of significantly associated cell types (P < 0.05/2679) in each category of cell types per trait. Traits with no significant association are colored gray and the traits are in the same order as a. The color bar at the right of the heatmap represents the domain of the traits. P-values for specific cell types per trait are available in Supplementary Data 5
Fig. 5
Fig. 5
Pair-wise cross-datasets conditional analysis for coronary artery disease (a) and schizophrenia (b). Heatmap of pair-wise cross-datasets conditional analyses (step 3) for cell types retained from the step 2. Cell types are labeled using their common name with additional information in parentheses (which is needed when referring back to the label from the original study). The index of the dataset is in square brackets. The heatmap is asymmetric; a cell on row i and column j is cross-datasets (CD) proportional significance (PS) of cell type j conditioning on cell type i. The CD PS is computed as −log10(CD conditional P-value)/−log10(CD marginal P-value). The size of the square is smaller (80%) when 50% of the marginal association of a cell type in column j is explained by adding the average expression of the dataset in row i (before conditioning on the expression of cell type i). Stars on the heatmap represent pair of cell types that are colinear. Double starts on the heatmap represent CD PS > 1. The bar plot at the top illustrates marginal P-value of the cell types on x-axis and stars represent independently associated cell types. Cell types are clustered by their independence, and within each cluster cell types are ordered by their marginal P-value. For example, there are four independent associations in (a) and cell types without a star are not independent from the association of the first independent cell type (with star) on its left. The complete results are available in Supplementary Data 5. The heatmap for other traits are available in Supplementary Fig. 12
Fig. 6
Fig. 6
Effects of the general expression conditioned in the regression model. a Association of P-values of neuron from Tabula Muris FACS conditioning on average expression across all available cell types from multiple tissues (pink) or only brain cell types (blue). b Association of P-values of TEGLU4 (excitatory neuron from cortex) from Mouse Brain Atlas conditioning on average expression across all available cell types (pink), only neuronal cell types (blue), or only excitatory neurons (green). c Association of P-values of TEGLU4 (subtype of excitatory neurons from cortex) from Mouse Brain Atlas conditioning on average expression across all available cell types (pink) or randomly selected 35 cell types (including TEGLU4) with uniform distribution across seven cell type classes (blue). d Association of P-values of Marrow B-cell from Tabula Muris FACS conditioning on average expression across all available cell types (pink) or only immune cell types in Marrow samples (blue). The percentages displayed on the blue and green bars represent the proportional significance (in −log10 scale) compared to the pink bars. EA educational attainment, SCZ schizophrenia, IQ intelligence, BMI body mass index, NEU neuroticism, OB obesity, ISM insomnia, RA rheumatoid arthritis, MS multiple sclerosis, T1D type 1 diabetes, IBD inflammatory bowel disease

References

    1. Visscher PM, et al. 10 Years of GWAS discovery: biology, function, and translation. Am. J. Hum. Genet. 2017;101:5–22. doi: 10.1016/j.ajhg.2017.06.005. - DOI - PMC - PubMed
    1. Hu X, et al. Integrating autoimmune risk loci with gene-expression data identifies specific pathogenic immune cell subsets. Am. J. Hum. Genet. 2011;89:496–506. doi: 10.1016/j.ajhg.2011.09.002. - DOI - PMC - PubMed
    1. Slowikowski K, Hu X, Raychaudhuri S. SNPsea: an algorithm to identify cell types, tissues and pathways affected by risk loci. Bioinformatics. 2014;30:2496–2497. doi: 10.1093/bioinformatics/btu326. - DOI - PMC - PubMed
    1. Pers TH, et al. Biological interpretation of genome-wide association studies using predicted gene functions. Nat. Commun. 2015;6:5890. doi: 10.1038/ncomms6890. - DOI - PMC - PubMed
    1. Finucane HK, et al. Heritability enrichment of specifically expressed genes identifies disease-relevant tissues and cell types. Nat. Genet. 2018;50:621–629. doi: 10.1038/s41588-018-0081-4. - DOI - PMC - PubMed

Publication types

Substances