. 2019 Jul 19;10(1):3235.
doi: 10.1038/s41467-019-11127-7.

Northward drift of the Azores plume in the Earth's mantle

Affiliations

Northward drift of the Azores plume in the Earth's mantle

Maëlis Arnould et al. Nat Commun. .

Abstract

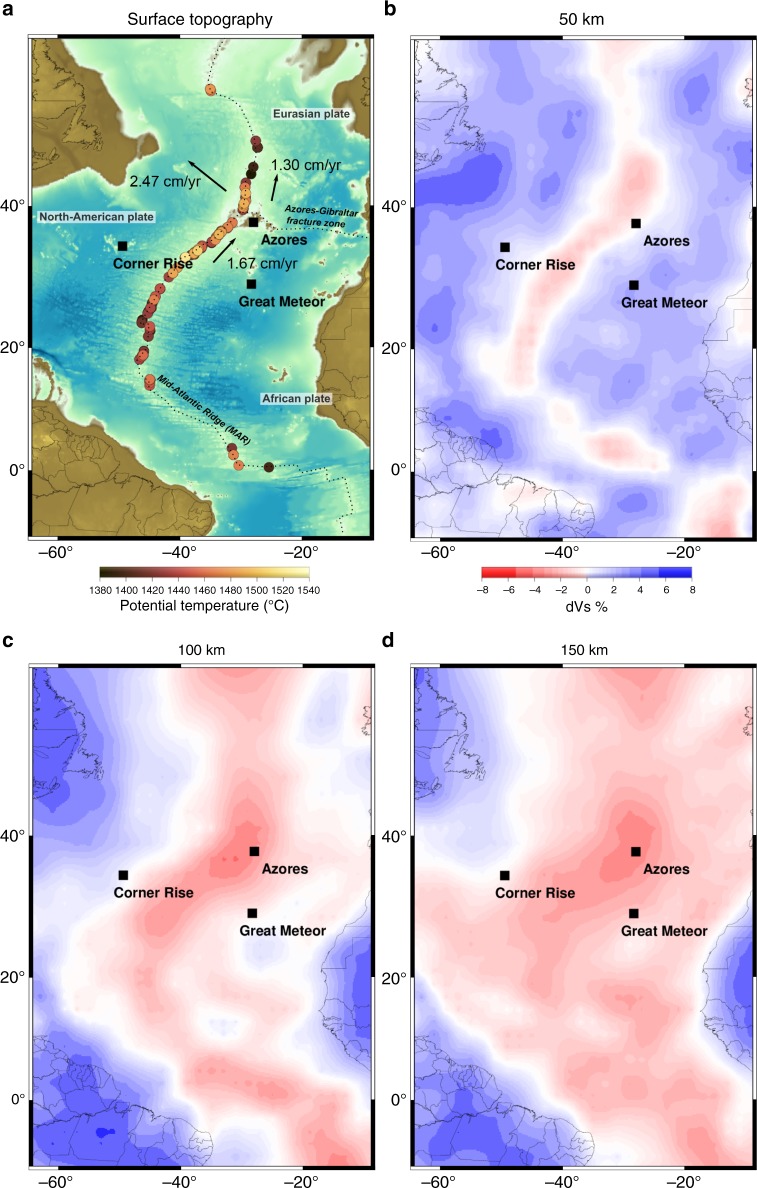
Mantle plume fixity has long been a cornerstone assumption to reconstruct past tectonic plate motions. However, precise geochronological and paleomagnetic data along Pacific continuous hotspot tracks have revealed substantial drift of the Hawaiian plume. The question remains for evidence of drift for other mantle plumes. Here, we use plume-derived basalts from the Mid-Atlantic ridge to confirm that the upper-mantle thermal anomaly associated with the Azores plume is asymmetric, spreading over ~2,000 km southwards and ~600 km northwards. Using for the first time a 3D-spherical mantle convection where plumes, ridges and plates interact in a fully dynamic way, we suggest that the extent, shape and asymmetry of this anomaly is a consequence of the Azores plume moving northwards by 1-2 cm/yr during the past 85 Ma, independently from other Atlantic plumes. Our findings suggest redefining the Azores hotspot track and open the way for identifying how plumes drift within the mantle.


Conflict of interest statement

The authors declare no competing interests.

Figures

Fig. 1
Fig. 1
Geographical setting and seismic tomography of the upper mantle. a Surface topography of the Central Atlantic Ocean and potential temperatures obtained from the PRIMELT method along the MAR (see Fig. 2). The direction and magnitude (in cm/yr) of plate velocities according to their absolute motions during the last 10 Ma in a moving hotspot reference frame in the vicinity of the Azores are denoted by the black arrows and numbers. bd Upper mantle shear wave tomography slices from the global upper mantle and transition zone model 3D2017_09SV
Fig. 2
Fig. 2
Chemical, thermal, bathymetric, geochemical and gravity asymmetry along the Mid-Atlantic Ridge. a Depth of pyroxene crystallization then subtraction (e.g. fractionation) in a primary magma that, later, will give birth to MORBs, calculated using Equation (6) in Herzberg and assuming a ratio of 1:3 between pressure (kb) and depth (km). b Mantle depth at which adiabatically upwelling mantle below the MAR segments crossed their solidus, depending on their potential temperature (TP) calculated with PRIMELT3 MEGA software using reduced conditions (Fe2+/∑Fe = 0.9) in the source. Solutions of calculation have been filtered for MgO < 8 wt% (blue dots in Supplementary Fig. 2). Mean values and the associated standard deviations (grey points and bars) in a, b are obtained by bootstrap analysis, are reported at 5° step of latitude. c Ridge-axis depth (below sea-level) in the region of the Azores. d Geochemical trace element ratios along the MAR, normalized according to Bougault and Treuil. e Ridge-axis Bouguer anomaly. Data have been plotted against latitude along the x-axis
Fig. 3
Fig. 3
Modeled kinematic scenarii of the interaction between a plume and a ridge system. ad Snapshots of four modeled cases of the relative motion between a ridge system (magenta lines) and a mantle plume (outlined by the light green (1390 °C), dark green (1480 °C), and brown (1700 °C) isotherms) in a global mantle convection model self-generating plate-like tectonics. Transparent green circles show the location of the plume thermal maximum. Colored arrows centered on the plume with magnitudes in cm/yr correspond to the plume absolute velocity (dark green), the average plates velocity within 500 km of the plume center (magenta) and the relative velocity between the plume and the average plates velocity (orange). Black arrows scale with surface plate velocities and blue transparent areas show the location of continents. Insets are schematic diagrams of the corresponding kinematic cases. e Temperature profiles across the plume waist at 100 km depth and along the modeled ridge (black dashed lines in ad). f Magnitude of the relative velocity between plumes and plate as a function of the symmetry of the temperature profiles of corresponding plumes (Supplementary Fig. 14). Symmetry coefficients correspond to the ratio of the extent of the thermal anomaly on each side of the corresponding plume thermal maximum. Numbers correspond to plume IDs. The vertical grey bar corresponds to the asymmetry observed at the Azores. Source data are available in the Open Science Framework repository

References

    1. Morgan JP. Deep mantle convection plumes and plate motions. Am. Assoc. Pet. Geol. Bull. 1972;56:203–213.
    1. Müller R. Dietmar, Royer Jean-Yves, Lawver Lawrence A. Revised plate motions relative to the hotspots from combined Atlantic and Indian Ocean hotspot tracks. Geology. 1993;21(3):275. doi: 10.1130/0091-7613(1993)021<0275:RPMRTT>2.3.CO;2. - DOI
    1. Konrad, K. et al. On the relative motions of long-lived Pacific mantle plumes. Nat. Commun. 10.1038/s41467-018-03277-x (2018). - PMC - PubMed
    1. Tarduno JA, et al. The Emperor Seamounts : southward motion of the Hawaiian hotspot plume in Earth’s mantle. Science. 2003;301:1064–1070. doi: 10.1126/science.1086442. - DOI - PubMed
    1. Vogt, P. R. & Jung, W.-Y. in Volcanoes of the Azores, Active volcanoes of the World (eds Kuepper, U. & Beier, C.) 27–56 (Springer-Verlag, Berlin, Germany, 2018).