. 2019 Jul 19;9(1):10520.
doi: 10.1038/s41598-019-46478-0.

Acute and short-term administrations of delta-9-tetrahydrocannabinol modulate major gut metabolomic regulatory pathways in C57BL/6 mice

Affiliations

Acute and short-term administrations of delta-9-tetrahydrocannabinol modulate major gut metabolomic regulatory pathways in C57BL/6 mice

Megha Oza et al. Sci Rep. .

Abstract

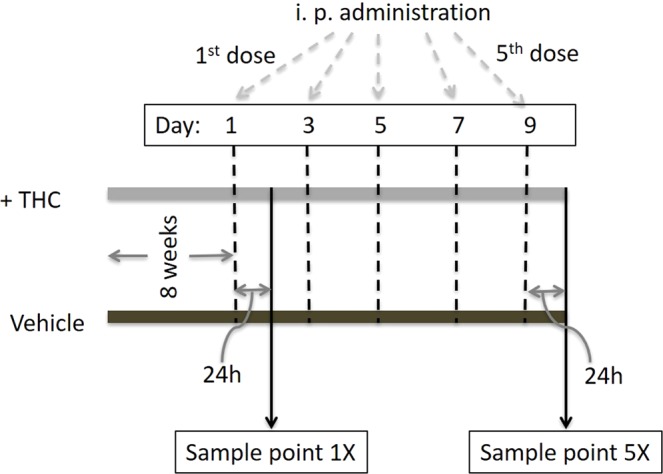
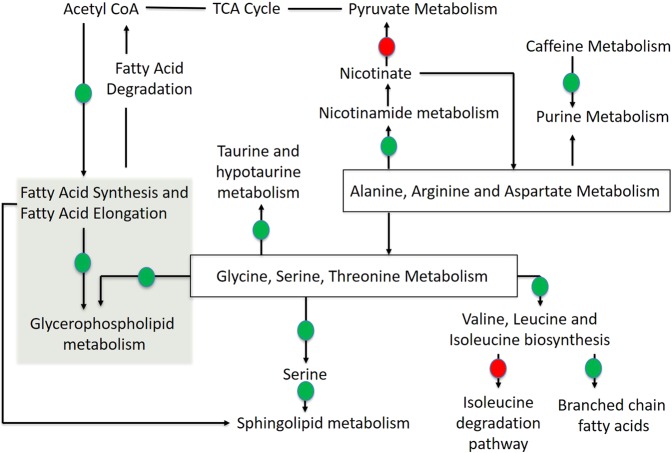
Delta-9-tetrahydrocannabinol (THC) is the primary psychoactive compound in Cannabis, which is studied extensively for its medicinal value. A central gap in the science is the underlying mechanisms surrounding THC's therapeutic effects and the role of gut metabolite profiles. Using a mass-spectrometry based metabolomics, we show here that intraperitoneal injection of THC in C57BL/6 mice modulates metabolic profiles that have previously been identified as integral to health. Specifically, we investigated the effects of acute (single THC injection denoted here as '1X') and short -term (five THC injections on alternate days denoted as '5X') THC administration on fecal and intestinal tissue metabolite profiles. Results are consistent with the hypothesis that THC administration alters host metabolism by targeting two prominent lipid metabolism pathways: glycerophospholipid metabolism and fatty acid biosynthesis.


Conflict of interest statement

The authors declare no competing interests.

Figures

Figure 1
Figure 1
Study design. Fecal samples (n = 5) for analyses were collected at 2 time-points, 1X and 5X. The injections of THC and vehicle were administered intraperitoneally ~48 h apart (denoted dashed lines) Five administrations were conducted. Fecal and intestinal tissue samples were collected at time points 1X and 5X, which were 24 h after the first and the fifth administrations respectively.
Figure 2
Figure 2
Fecal metabolome changes in 1X samples. (a) Volcano plots enabling the visualization of metabolites showing differential abundance. These were selected based on fold change (X-axis) and p-value in (Y-axis). The m/z values (highlighted in pink) represent a fold change of ≥0.5 or ≤2.0 and p-value ≤ 0.05 in THC administered mice compared to the vehicle controls and were selected for further characterization. (b) PCA score scatter plots based on fecal metabolic profiling of THC (n = 5) and control (n = 5) mice c) PLS- DA score plots based on detected fecal metabolites from THC administered (n = 5) and control (n = 5) mice. T, THC administered mice, C, control mice.
Figure 3
Figure 3
Fecal metabolome changes in 5X samples. (a) Volcano plots showing the metabolites with differential abundance between THC treated mice and the controls. These were selected based on fold change (X-axis) and p-value in (Y-axis). The m/z values (highlighted in pink) represent a fold change of ≥0.5 or ≤2.0 and p-value ≤ 0.05 in THC administered mice compared to the vehicle controls and were selected for further characterization. (b) PCA score scatter plots based on fecal metabolic profiling of THC (n = 5) and control (n = 5) mice c) PLS- DA score plots based on detected fecal metabolites from THC administered (n = 5) and control (n = 5) mice. T, THC administered mice, C, control mice.
Figure 4
Figure 4
Functional pathway analysis showing the major pathways that are upregulated or downregulated upon administration of THC. Biological relationships of the pathways were adapted from KEGG, Lipid Maps and HMDB database based on the identification of the metabolite markers corresponding to the pathways. Based on number of identified metabolites with >2 fold increase/decrease, we indicate the processes that are upregulated with green circles and the processes that are downregulated with red circles. The green highlighted zone show the metabolic pathways for which metabolite enrichment was observed both in fecal and intestinal tissue metabolite profiling.

References

    1. Hill KP. Medical marijuana for treatment of chronic pain and other medical and psychiatric problems: a clinical review. Jama. 2015;313:2474–2483. - PubMed
    1. Koppel BS, et al. Systematic review: Efficacy and safety of medical marijuana in selected neurologic disorders Report of the Guideline Development Subcommittee of the American Academy of Neurology. Neurology. 2014;82:1556–1563. - PMC - PubMed
    1. Whiting PF, et al. Cannabinoids for medical use: a systematic review and meta-analysis. Jama. 2015;313:2456–2473. - PubMed
    1. ProCon. Should Marijuana Be a Medical Option?, https://medicalmarijuana.procon.org/ (2017).
    1. Elikkottil J, Gupta P, Gupta K. The analgesic potential of cannabinoids. J Opioid Manag. 2009;5:341–357. - PMC - PubMed

Publication types