. 2019 Jul 19;9(1):10482.
doi: 10.1038/s41598-019-46869-3.

Gains and losses of metabolic function inferred from a phylotranscriptomic analysis of algae

Affiliations

Gains and losses of metabolic function inferred from a phylotranscriptomic analysis of algae

Falicia Qi Yun Goh et al. Sci Rep. .

Abstract

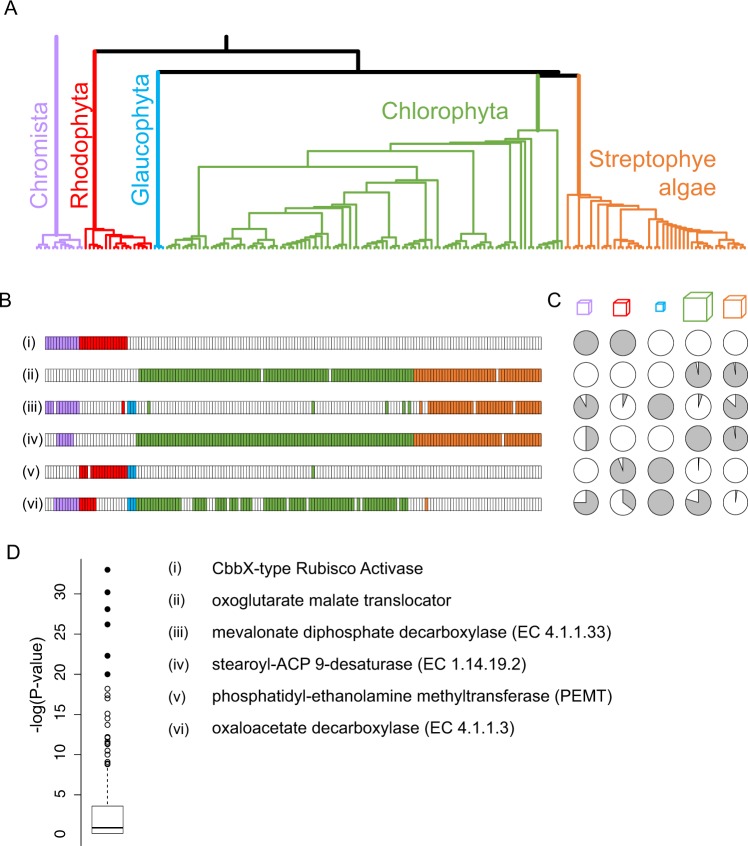
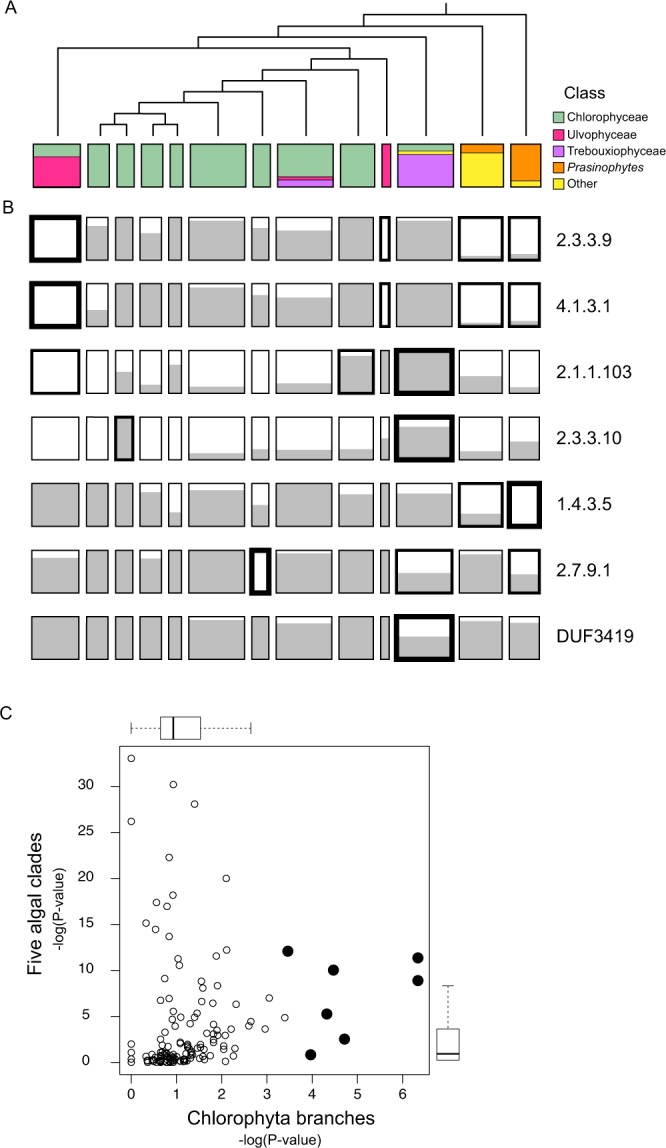
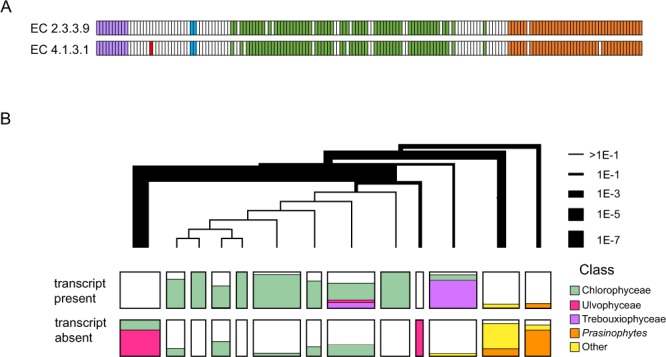
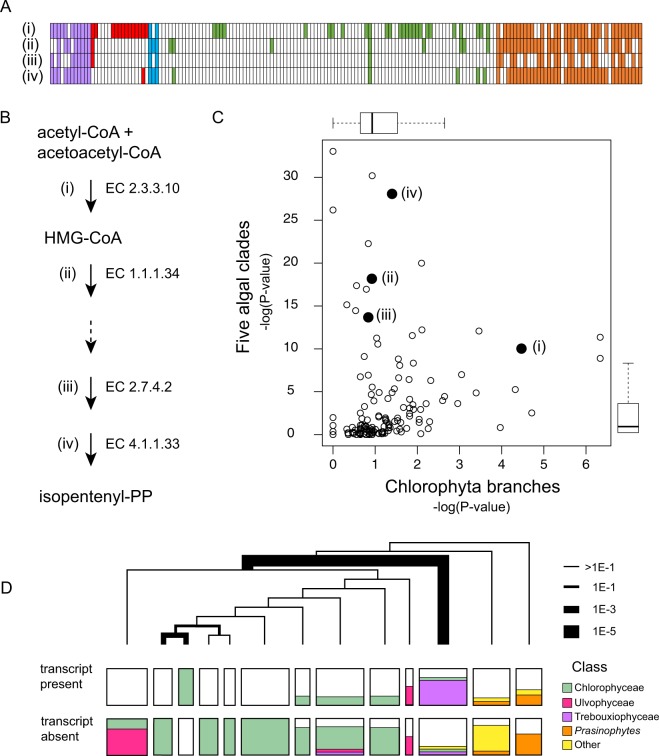
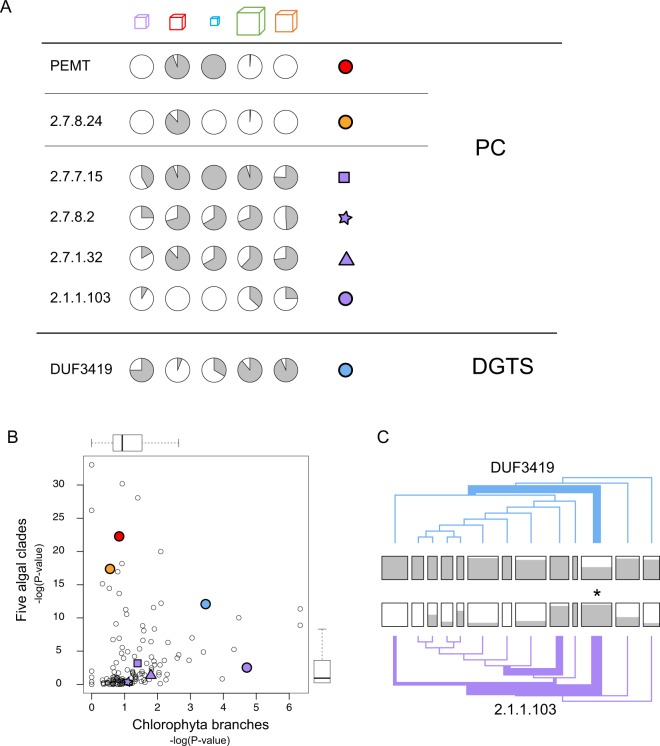
Hidden Markov models representing 167 protein sequence families were used to infer the presence or absence of homologs within the transcriptomes of 183 algal species/strains. Statistical analyses of the distribution of HMM hits across major clades of algae, or at branch points on the phylogenetic tree of 98 chlorophytes, confirmed and extended known cases of metabolic loss and gain, most notably the loss of the mevalonate pathway for terpenoid synthesis in green algae but not, as we show here, in the streptophyte algae. Evidence for novel events was found as well, most remarkably in the recurrent and coordinated gain or loss of enzymes for the glyoxylate shunt. We find, as well, a curious pattern of retention (or re-gain) of HMG-CoA synthase in chlorophytes that have otherwise lost the mevalonate pathway, suggesting a novel, co-opted function for this enzyme in select lineages. Finally, we find striking, phylogenetically linked distributions of coding sequences for three pathways that synthesize the major membrane lipid phosphatidylcholine, and a complementary phylogenetic distribution pattern for the non-phospholipid DGTS (diacyl-glyceryl-trimethylhomoserine). Mass spectrometric analysis of lipids from 25 species was used to validate the inference of DGTS synthesis from sequence data.


Conflict of interest statement

The authors declare no competing interests.

Figures

Figure 1
Figure 1
Skewed distributions of transcripts among major algal clades. (A) Phylogenetic tree for 169 algal species or strains. This is a sub-tree of one produced by the OneKP project, restricted to those transcriptomes for which we conducted HMM searches (Methods). Cutting the tree at a high level results in five clades; the identification of these as Chromista, Rhodophyta, Glaucophyta, Chlorophyta, and Charophyta is based on the taxonomic information that the OneKP project has associated with each sample. (B) Presence (filled boxes) or absence (empty) of HMM hits for six HMMs (numbered i to vi). Each box corresponds to a transcriptome, ordered from left to right as in the tree. Colors of the boxes correspond to the color-coding of the clades in panel A. (C) Fraction of transcriptomes with a hit to the HMM in of each of the five clades. Cubes above the pie-charts have volumes that are to scale with respect to the number of samples in each clade. (D) P-values (Fisher's exact test) for non-random distribution of HMM hits among the five major clades. The top six are shown as filled circles, and correspond to the six HMMs whose distributions are shown in panels B and C. The names of the enzymes are shown.
Figure 2
Figure 2
Skewed distributions of transcripts within the Chlorophyta. (A) Simplified phylogenetic tree for 98 Chlorophyta samples (Methods). The width of the boxes corresponds to the number of clustered transcriptomes, which range from 2 to 13. Samples were assigned to a taxonomic class based on the classification system used by AlgaeBase and the lower level taxonomic names provided by OneKP. A majority of the samples belong to the class Chlorophyceae. Two other classes singled out for explicit representation are Ulvophyceae and Trebouxiophycea. The term prasinophytes here represents the classes Nephroselmidophyceae, Mamiellophyceae, and Pyramimonadophyceae. (B) Distribution of homologous transcripts for the seven HMMs whose distributions within the chlorophytes is most significantly different than random. The gray fill in each box indicates the fraction of transcriptomes in that cluster that have hits to the indicated HMM. At each branch point, descending from the top of the tree, the skew in the distribution of samples with HMM hits was assessed with Fisher's exact test. Boxes with thick lines indicate clusters with a p-value less than 0.001. The lowest p-value for each HMM is indicated by the single thickest line in that row. 2.3.3.9: malate synthase; 4.1.3.1: isocitrate lyase; 2.1.1.103: phosphoethanolamine methyltransferase; 2.3.3.10: HMG-CoA synthase; 1.4.3.5: pyridoxamine phosphate oxidase; 2.7.9.1: pyruvate-phosphate dikinase; DUF3419: Unknown Function according to Pfam function, but associated here with DGTS synthase. (C) Distribution of p-values for HMM-hit distributions. Each point is an HMM. The y-axis shows the p-value for the distribution across the five major clades; this is the same as shown in Fig. 1. The x-axis shows, for each HMM, the lowest of the p-values for splits along the Chlorophyta tree. Filled circles represent the HMMs shown in panel B. From right to left, these correspond to the schematics in panel B, from top to bottom.
Figure 3
Figure 3
Distribution of glyoxylate shunt enzymes shows a preferential absence of both sequences in certain clades. (A) Hits to glyoxylate shunt HMMs across the full set of transcriptomes. EC:2.3.3.9: malate synthase. EC:4.1.3.1: isocitrate lyase. (B) Chlorophyta tree with branchpoint thicknesses related to the p-value associated with the segregation of HMM-positive and HMM-negative transcriptomes. Within each cluster, the fraction of transcriptomes with and without hits to the HMM are indicated, as well as the taxonomic Class (or group of Classes) to which the samples belong.
Figure 4
Figure 4
Distribution of sequences in the mevalonate (MVA) pathway for isoprenoid synthesis, and the possible co-option of HMG-CoA synthase. (A) Hits to four enzymes in the mevalonate pathway. Numbers correspond to the EC codes in panel B. (B) Schematic of the pathway indicating the production of HMG-CoA by hydroxymethylglutaryl-CoA synthase (EC:2.3.3.10) and the ultimate production of an isoprenoid monomer. EC 1.1.134: HmG-CoA reductase; EC 2.7.4.2: phosphomevalonate kinase; EC 4.1.1.33: diphosphomevalonate decarboxylase. The dashed arrow denotes an enzyme for which we were unable to characterize the presence of transcripts because we lacked a sufficiently specific HMM. (C) Distribution of p-values as in Fig. 2C. Transcripts in the MVA pathway are labeled and indicated by large filled circles. (D) Distribution of hits to the HMM for HMG-CoA synthase (EC:2.3.3.10). The tree and the boxes denoting HMM hits in each cluster are as described in Fig. 3.
Figure 5
Figure 5
Distribution of enzyme sequences for the synthesis of PC and DGTS. (A) Distribution of HMM hits for seven enzymes discussed in the text. The first two are involved in two separate pathways for PC. The third and fourth complete a third pathway, while the fifth and sixth are two different ways of creating the starting point for that third pathway. The last HMM is for an enzyme involved in DGTS synthesis. The colored symbols are a key to panel B. (B) P-values for the distribution of membrane lipid HMM hits. Discussion focuses on those indicated by the colored circles. (C) Chlorophyta trees for DUF3419 (blue) and 2.1.1.103 (purple). Differences in line thickness at different branchpoints are related to the p-value for skewed distributions of HMM hits. Note that both HMMs are most biased at the same branchpoint: DUF3419 has unusually few hits in one of the clusters and 2.1.1.103 has unusually many, both indicated by the asterisk between the two.

References

    1. Reyes-Prieto A, Weber APM, Bhattacharya D. The origin and establishment of the plastid in algae and plants. Annu Rev Genet. 2007;41:147–168. doi: 10.1146/annurev.genet.41.110306.130134. - DOI - PubMed
    1. Niklas K. J. The evolutionary-developmental origins of multicellularity. American Journal of Botany. 2013;101(1):6–25. doi: 10.3732/ajb.1300314. - DOI - PubMed
    1. Brodie Juliet, Chan Cheong Xin, De Clerck Olivier, Cock J. Mark, Coelho Susana M., Gachon Claire, Grossman Arthur R., Mock Thomas, Raven John A., Smith Alison G., Yoon Hwan Su, Bhattacharya Debashish. The Algal Revolution. Trends in Plant Science. 2017;22(8):726–738. doi: 10.1016/j.tplants.2017.05.005. - DOI - PubMed
    1. Finn RD, et al. The Pfam protein families database. Nucleic Acids Res. 2010;38:D211–22. doi: 10.1093/nar/gkp985. - DOI - PMC - PubMed
    1. Kanehisa M, et al. Data, information, knowledge and principle: back to metabolism in KEGG. Nucleic Acids Res. 2014;42:D199–205. doi: 10.1093/nar/gkt1076. - DOI - PMC - PubMed

Publication types