. 2019 Jul 19;9(1):10521.
doi: 10.1038/s41598-019-47021-x.

PI3K/mTOR inhibition of IDH1 mutant glioma leads to reduced 2HG production that is associated with increased survival

Affiliations

PI3K/mTOR inhibition of IDH1 mutant glioma leads to reduced 2HG production that is associated with increased survival

Georgios Batsios et al. Sci Rep. .

Abstract

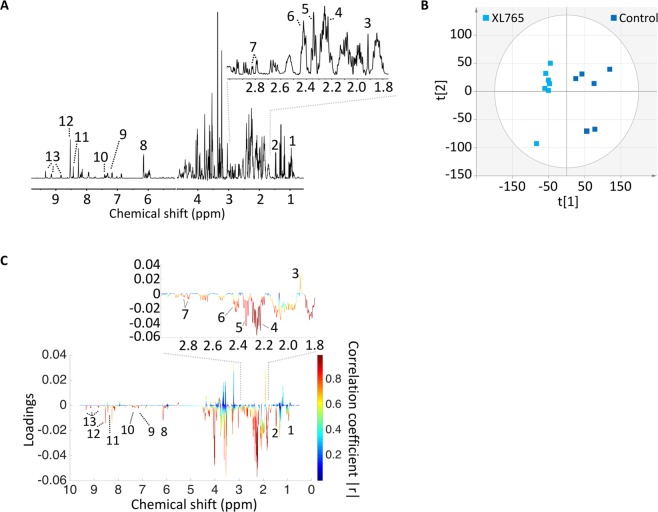
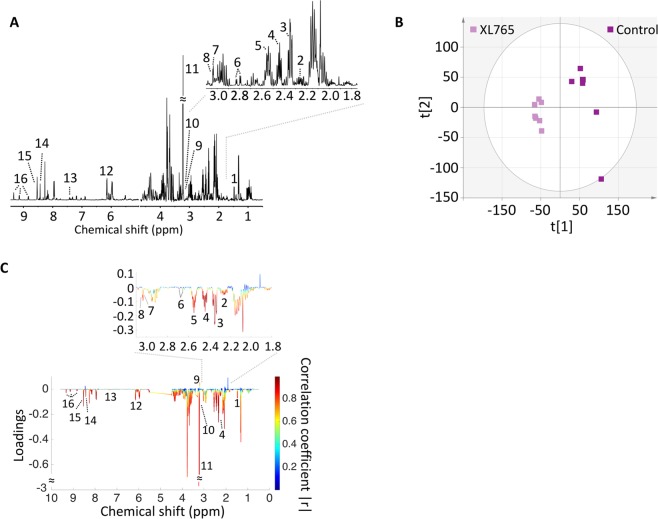
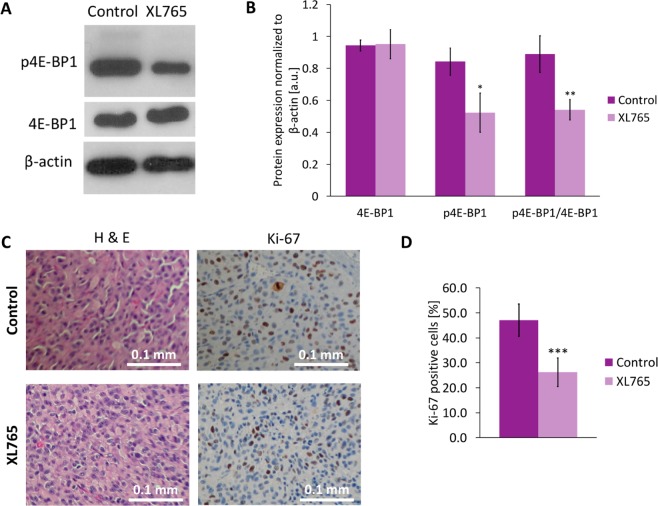
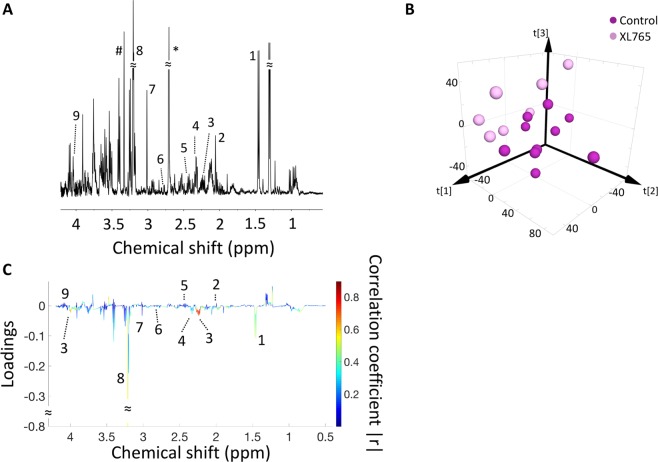
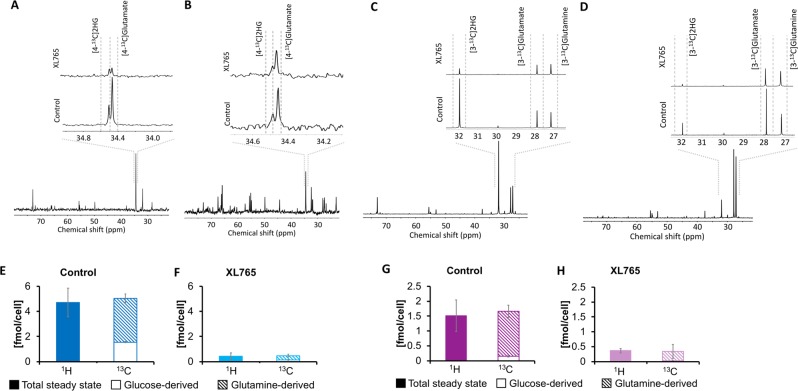
70-90% of low-grade gliomas and secondary glioblastomas are characterized by mutations in isocitrate dehydrogenase 1 (IDHmut). IDHmut produces the oncometabolite 2-hydroxyglutarate (2HG), which drives tumorigenesis in these tumors. The phosphoinositide-3-kinase (PI3K)/mammalian target of rapamycin (mTOR) pathway represents an attractive therapeutic target for IDHmut gliomas, but noninvasive indicators of drug target modulation are lacking. The goal of this study was therefore to identify magnetic resonance spectroscopy (MRS)-detectable metabolic biomarkers associated with IDHmut glioma response to the dual PI3K/(mTOR) inhibitor XL765. 1H-MRS of two cell lines genetically modified to express IDHmut showed that XL765 induced a significant reduction in several intracellular metabolites including 2HG. Importantly, examination of an orthotopic IDHmut tumor model showed that enhanced animal survival following XL765 treatment was associated with a significant in vivo 1H-MRS detectable reduction in 2HG but not with significant inhibition in tumor growth. Further validation is required, but our results indicate that 2HG could serve as a potential noninvasive MRS-detectable metabolic biomarker of IDHmut glioma response to PI3K/mTOR inhibition.


Conflict of interest statement

The authors declare no competing interests.

Figures

Figure 1
Figure 1
Validation of downregulation by XL765 of PI3K/mTOR pathway signaling by western blot. (A) Phosphoinositide-3-kinase (PI3K)/mammalian target of rapamycin (mTOR) signaling pathway. 4E-Binding protein 1 (4E-BP1) and S6 kinase (S6K) is a downstream target of mTOR. Solid lines: direct interaction; dotted lines: multistep interaction. (B) Quantification of cell number normalized to control for NHAIDHmut (Dark/light blue) and U87IDHmut (Dark/light purple). (C) Cropped western blots of phosphorylated 4E-BP1, 4E-BP1 and β-actin for NHAIDHmut (left) and U87IDHmut (right) model for control and XL765 treatment. Complete blots can be seen in Supplementary Fig. 1. (D) Quantification of p4E-BP1, 4E-BP1 and their ratio (p4E-BP1/4E-BP1) for NHAIDHmut and U87IDHmut model. (E) Cropped western blots of phosphorylated S6K, S6K and β-actin for NHAIDHmut (left) and U87IDHmut (right) model for control and XL765 treatment. Complete blots can be seen in Supplementary Fig. 2. (F) Quantification of pS6K, S6K and their ratio (pS6K/S6K) for NHAIDHmut and U87IDHmut model. Data are normalized to β-actin level. NHAIDHmut cell were treated with 32 μM XL765 for 72 h and U87IDHmut with 12 μM XL765 for 24 h. DMSO was used as vehicle control (NHAIDHmut: 0.16% for 72 h and U87IDHmut: 0.06% for 24 h). Dark blue/purple bar: Control; Light blue/purple bar: XL765-treated. *p < 0.05, **p < 0.01, ***p < 0.001.
Figure 2
Figure 2
Multivariate analysis shows a discrimination between XL765-treated and control group in NHAIDHmut cells. (A) A typical 500 MHz 1H NMR spectrum of the water fraction of control cell extract. Numbers indicate the following metabolites: 1. Leucine, 2. Alanine, 3. Acetate, 4. 2HG, 5. Glutamate, 6. Glutamine, 7. Aspartate, 8. AXP, 9. Tyrosine, 10. Phenylalanine, 11. Formate, 12. NAD+/NADP+ or NADH/NADPH, 13. NAD+/NADP+. (B) Two-dimensional scatter plot of PCA shows discrimination of control (dark blue) and XL765-treated (light blue) groups. (C) Loading plot for 1H NMR. The correlation coefficient corresponding to OPLS-DA model is represented as color map. Numbers indicate the same metabolites as in (A) and had |r| > 0.8. OPLS-DA: Orthogonal partial least squares discriminant analysis.
Figure 3
Figure 3
Multivariate analysis shows a discrimination between XL765-treated and control group in U87IDHmut cells. (A) A typical 500 MHz 1H NMR spectrum of the water fraction of control cell extract. Numbers indicate the following metabolites: 1. Alanine, 2. 2HG, 3. Glutamate, 4. Glutamine, 5. Glutathione, 6. Aspartate, 7. Creatine, 8. Phosphocreatine, 9. Choline, 10. Phosphocholine, 11. Glycerylphosphorylcholine, 12. AXP, 13. Phenylalanine, 14. Formate, 15. NAD+/NADP+ or NADH/NADPH, 16. NAD+/NADP+. (B) Two-dimensional scatter plot of PCA shows discrimination of control (dark purple) and XL765-treated (light purple) groups. (C) Loading plot for 1H NMR. The correlation coefficient corresponding to OPLS-DA model is represented as color map. Numbers indicate the same metabolites as in (A) and had |r| > 0.8. OPLS-DA: Orthogonal partial least squares discriminant analysis.
Figure 4
Figure 4
Validation in tissue samples of downregulation of PI3K/mTOR pathway signaling and reduction in cell proliferation under XL765 treatment. (A) Cropped western blots of phosphorylated 4E-BP1, 4E-BP1 and β-actin for tissues from control and XL765-treated mice. Complete blots can be seen in Supplementary Fig. 4. (B) Quantification of 4E-BP1, p4E-BP1 and their ratio (p4E-BP1/4E-BP1). Data are normalized to β-actin level. (C) Immunohistochemical analysis of control and XL765‐treated U87IDHmut tumors. Expression of Ki-67 for each treatment group at the end of the study. All histological images are the same magnification (×20). (D) Quantification Ki-67 positive cells normalized to total number of cells. Dark purple bar: Control; Light purple bar: XL765-treated. *p < 0.05, **p < 0.01, ***p < 0.001.
Figure 5
Figure 5
XL765 treatment increases animal survival without apparent tumor volume difference. (A) Axial T2-weighted images at D0 (first column) and D15 of treatment (second column) for control (top) and XL765-treated (bottom) U87IDHmut-tumor bearing mice brains. Tumor regions are contoured with a white line and the square box at D15 depicts the 1H-MRS voxel. Day 15 was the final day for both presented mice. Mice were treated with 30 mg/kg XL765 twice daily p.o. or with 10 mM HCl (control group). (B) Temporal evolution of average tumor volume normalized to D0. (*p < 0.05, ***p < 0.001, n.s.: not significant) (C) Kaplan–Meier survival curves comparing survival between XL765-treated animals (light gray line) and control (dark purple line) ones. (D) Representative spectra of a control animal, its LCModel fit and residual of the fit. Apodization of 5 Hz has been applied. Numbers indicate the following metabolites: 1. Lipids, 2. Lactate and Lipids, 3. Alanine, 4. N-acetylaspartate, 5. 2HG, 6. Glutamate and Glutamine, 7. Aspartate, 8. Total creatine, 9. Total choline and 10. Myo-Inositol.
Figure 6
Figure 6
2HG discriminates control from XL765-treated U87IDHmut tumor extracts. (A) A typical 500 MHz 1H NMR spectrum of the water fraction of tumor extract from a control animal. Numbers indicate the following metabolites: 1. Alanine, 2. N-acetylaspartate, 3. 2HG, 4. Glutamate, 5. Glutamine, 6. Aspartate, 7. Total creatine, 8. Total choline, 9. Myo-Inositol. *: speak (2.7 ppm) related to protease inhibitor solution, #: methanol residual. (B) Three-dimensional scatter plot of PCA shows discrimination of control (dark purple) and XL765-treated (light purple) groups. (C) Loading plot for 1H NMR. The correlation coefficient corresponding to OPLS-DA model is represented as color map. Numbers indicate the same metabolites as in (A). OPLS-DA: Orthogonal partial least squares discriminant analysis.
Figure 7
Figure 7
Glucose and glutamine flux to 2HG is reduced in NHAIDHmut and U87IDHmut cells under XL765 treatment. (A,B) Representative 13C-spectra ([1-13C]glucose labeling) of NHAIDHmut and U87IDHmut control cells respectively. Inserts: Expansion of [4-13C]2HG and [4-13C]glutamate region for XL765-treated (top) and control (bottom). (C,D) Representative 13C-spectra ([3-13C]glutamine labeling) of NHAIDHmut and U87IDHmut control cells respectively. Inserts: Expansion of [3-13C]2HG and [3-13C]glutamate region for XL765 treatment (top) and control (bottom). (E–H) Average 2HG produced from [1-13C]glucose and [3-13C]glutamine (13C) and total 2HG levels (1H) for control and XL765-treated NHAIDHmut cells (E,F) and U87IDHmut cells (G,H). Dark blue/purple bar: Control; Light blue/purple bar: XL765-treated; Full bar: Steady state; Empty bar: Glucose derived metabolite; Hashed bar: Glutamine derived metabolite.

References

    1. Ostrom QT, et al. CBTRUS Statistical Report: Primary brain and other central nervous system tumors diagnosed in the United States in 2010–2014. Neuro-oncology. 2017;19:v1–v88. doi: 10.1093/neuonc/nox158. - DOI - PMC - PubMed
    1. Huse JT, Phillips HS, Brennan CW. Molecular subclassification of diffuse gliomas: seeing order in the chaos. Glia. 2011;59:1190–1199. doi: 10.1002/glia.21165. - DOI - PubMed
    1. Louis DN, et al. The 2016 World Health Organization Classification of Tumors of the Central Nervous System: a summary. Acta Neuropathologica. 2016;131:803–820. doi: 10.1007/s00401-016-1545-1. - DOI - PubMed
    1. Brat DJ, et al. Comprehensive, Integrative Genomic Analysis of Diffuse Lower-Grade Gliomas. The New England journal of medicine. 2015;372:2481–2498. doi: 10.1056/NEJMoa1402121. - DOI - PMC - PubMed
    1. Thakkar JP, et al. Epidemiologic and molecular prognostic review of glioblastoma. Cancer epidemiology, biomarkers & prevention: a publication of the American Association for Cancer Research, cosponsored by the American Society of Preventive Oncology. 2014;23:1985–1996. doi: 10.1158/1055-9965.epi-14-0275. - DOI - PMC - PubMed

Publication types

MeSH terms