

Satb2 regulates proliferation and nuclear integrity of pre-osteoblasts
- PMID: 31325654
- PMCID: PMC6708767
- DOI: 10.1016/j.bone.2019.07.017
Satb2 regulates proliferation and nuclear integrity of pre-osteoblasts
Abstract
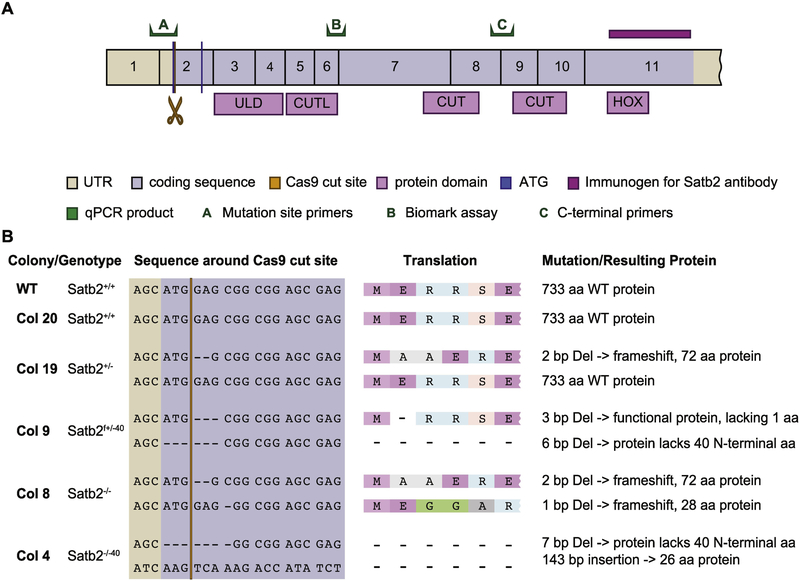
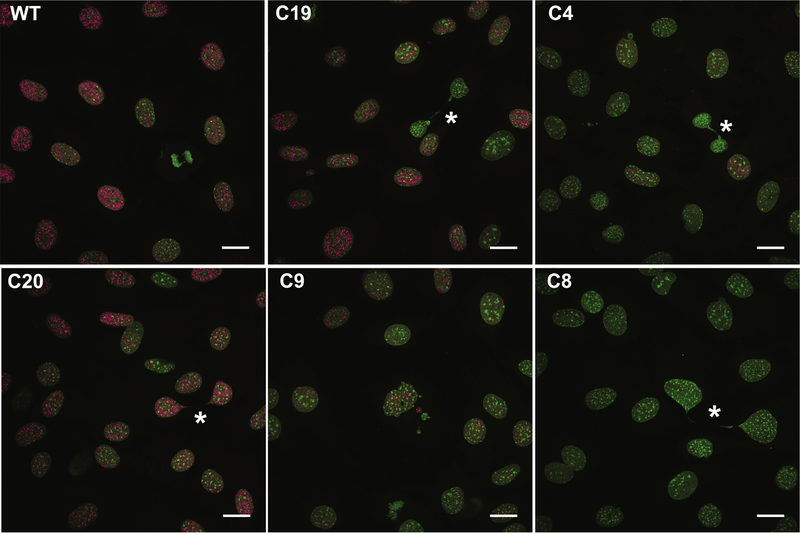
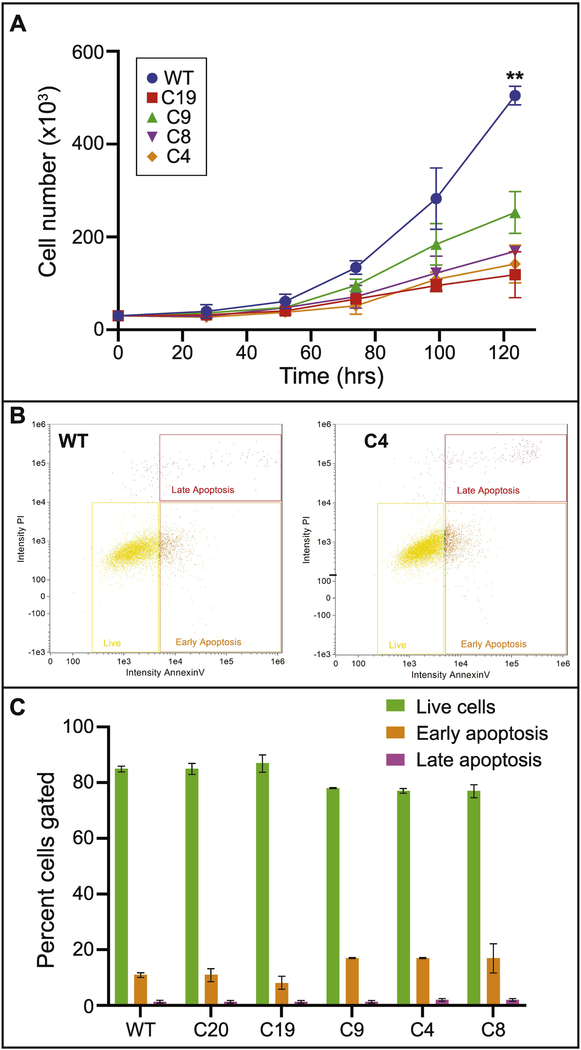
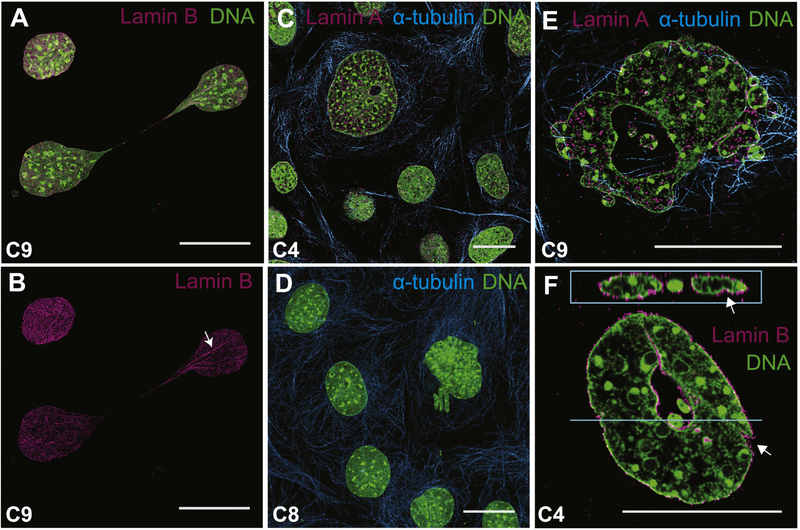
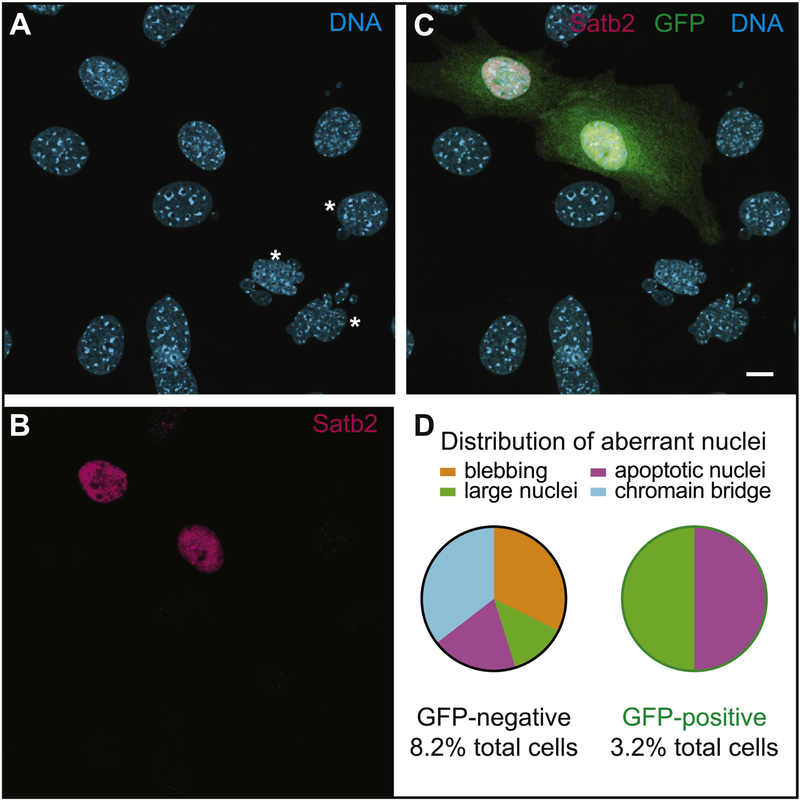
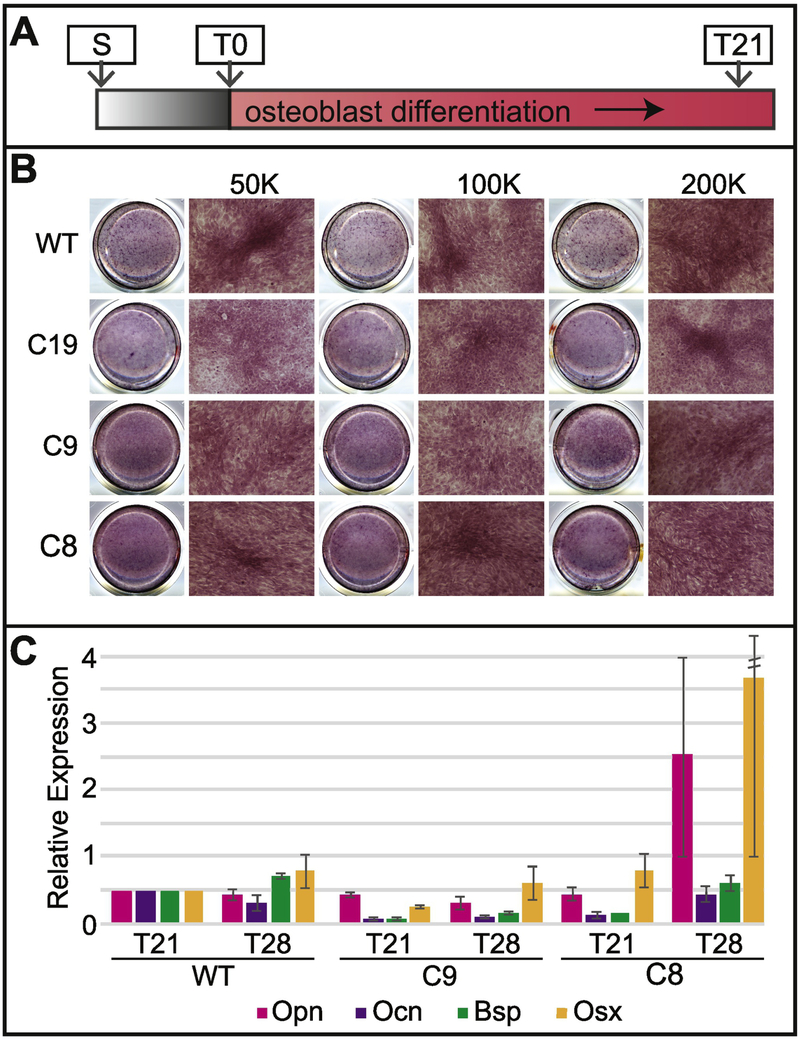
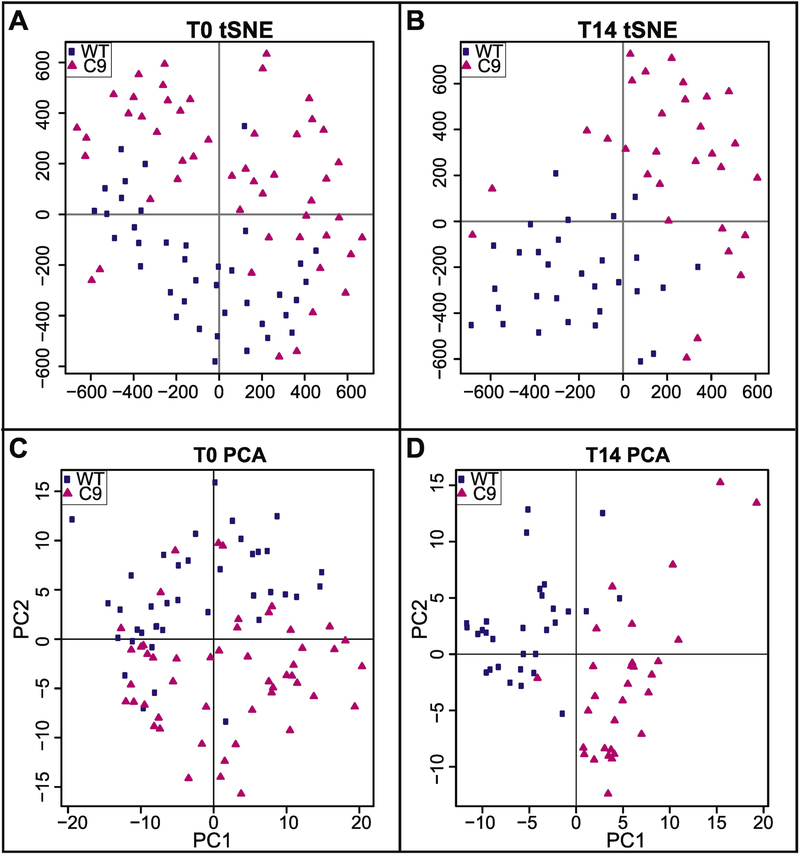
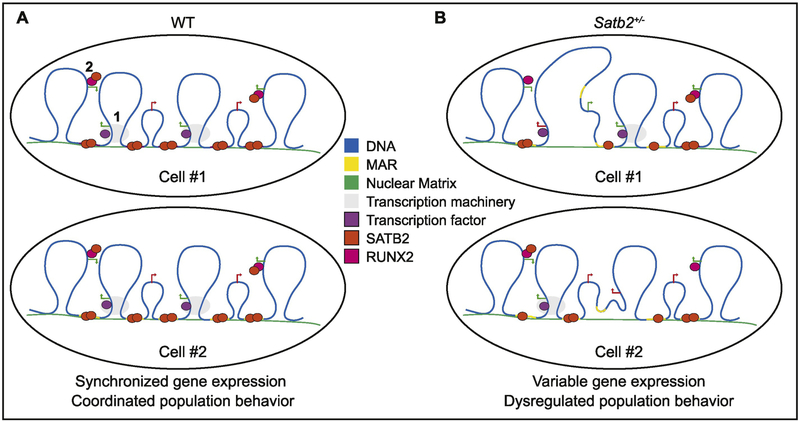
Special AT-rich sequence binding protein 2 (Satb2) is a matrix attachment region (MAR) binding protein. Satb2 impacts skeletal development by regulating gene transcription required for osteogenic differentiation. Although its role as a high-order transcription factor is well supported, other roles for Satb2 in skeletal development remain unclear. In particular, the impact of dosage sensitivity (heterozygous mutations) and variance on phenotypic severity is still not well understood. To further investigate molecular and cellular mechanisms of Satb2-mediated skeletal defects, we used the CRISPR/Cas9 system to generate Satb2 mutations in MC3T3-E1 cells. Our data suggest that, in addition to its role in differentiation, Satb2 regulates progenitor proliferation. We also find that mutations in Satb2 cause chromatin defects including nuclear blebbing and donut-shaped nuclei. These defects may contribute to a slight increase in apoptosis in mutant cells, but apoptosis is insufficient to explain the proliferation defects. Satb2 expression exhibits population-level variation and is most highly expressed from late G1 to late G2. Based on these data, we hypothesize that Satb2 may regulate proliferation through two separate mechanisms. First, Satb2 may regulate the expression of genes necessary for cell cycle progression in pre-osteoblasts. Second, similar to other MAR-binding proteins, Satb2 may participate in DNA replication. We also hypothesize that variation in the severity or penetrance of Satb2-mediated proliferation defects is due to stochastic variation in Satb2 binding to DNA, which may be buffered in some genetic backgrounds. Further elucidation of the role of Satb2 in proliferation has potential impacts on our understanding of both skeletal defects and cancer.
Keywords: Chromatin defects; MAR-binding protein; Osteoblast differentiation; Satb2.
Copyright © 2019 Elsevier Inc. All rights reserved.
Conflict of interest statement
Conflict of Interest
The authors declare that they have no conflicts of interest.
Figures
Similar articles
-
Satb2 expression in Foxc1-promoted osteogenic differentiation of MC3T3-E1 cells is negatively regulated by microRNA-103-3p.Acta Biochim Biophys Sin (Shanghai). 2019 Jun 20;51(6):588-597. doi: 10.1093/abbs/gmz037. Acta Biochim Biophys Sin (Shanghai). 2019. PMID: 31089719
-
SATB2 is a multifunctional determinant of craniofacial patterning and osteoblast differentiation.Cell. 2006 Jun 2;125(5):971-86. doi: 10.1016/j.cell.2006.05.012. Cell. 2006. PMID: 16751105
-
Special AT-rich sequence-binding protein 2 and its related genes play key roles in the differentiation of MC3T3-E1 osteoblast like cells.Biochem Biophys Res Commun. 2012 Jan 13;417(2):697-703. doi: 10.1016/j.bbrc.2011.11.157. Epub 2011 Dec 7. Biochem Biophys Res Commun. 2012. PMID: 22166200
-
[Study progress of special AT-rich sequence binding protein 2].Yi Chuan. 2011 Sep;33(9):947-52. doi: 10.3724/sp.j.1005.2011.00947. Yi Chuan. 2011. PMID: 21951795 Review. Chinese.
-
Bone formation: The nuclear matrix reloaded.Cell. 2006 Jun 2;125(5):840-2. doi: 10.1016/j.cell.2006.05.022. Cell. 2006. PMID: 16751095 Review.
Cited by
-
Mechanism of miRNA-31 Regulating Wnt/β-catenin Signaling Pathway by Targeting Satb2 in the Osteogenic Differentiation of Human Bone Marrow-Derived Mesenchymal Stem Cells.J Musculoskelet Neuronal Interact. 2023 Sep 1;23(3):346-354. J Musculoskelet Neuronal Interact. 2023. PMID: 37654220 Free PMC article.
-
Regulation of Osteoblast Differentiation by Cytokine Networks.Int J Mol Sci. 2021 Mar 11;22(6):2851. doi: 10.3390/ijms22062851. Int J Mol Sci. 2021. PMID: 33799644 Free PMC article. Review.
-
"Genetic scissors" CRISPR/Cas9 genome editing cutting-edge biocarrier technology for bone and cartilage repair.Bioact Mater. 2022 Oct 7;22:254-273. doi: 10.1016/j.bioactmat.2022.09.026. eCollection 2023 Apr. Bioact Mater. 2022. PMID: 36263098 Free PMC article. Review.
-
Oncogenic Role of SATB2 In Vitro: Regulator of Pluripotency, Self-Renewal, and Epithelial-Mesenchymal Transition in Prostate Cancer.Cells. 2024 Jun 3;13(11):962. doi: 10.3390/cells13110962. Cells. 2024. PMID: 38891096 Free PMC article.
-
A novel mutation of SATB2 inhibits odontogenesis of human dental pulp stem cells through Wnt/β-catenin signaling pathway.Stem Cell Res Ther. 2021 Dec 4;12(1):595. doi: 10.1186/s13287-021-02660-8. Stem Cell Res Ther. 2021. PMID: 34863303 Free PMC article.
References
-
- Britanova O, Akopov S, Lukyanov S, Gruss P, Tarabykin V. 2005. Novel transcription factor Satb2 interacts with matrix attachment region DNA elements in a tissue-specific manner and demonstrates cell-type-dependent expression in the developing mouse CNS. Eur J Neurosci 21: 658–668. - PubMed
-
- Cai S, Han HJ, Kohwi-Shigematsu T. 2003. Tissue-specific nuclear architecture and gene expression regulated by SATB1. Nat Genet 34: 42–51. - PubMed
Publication types
MeSH terms
Substances
Grants and funding
LinkOut - more resources
Full Text Sources
Molecular Biology Databases
Research Materials
