

Gaps between fruit and vegetable production, demand, and recommended consumption at global and national levels: an integrated modelling study
- PMID: 31326072
- PMCID: PMC6637854
- DOI: 10.1016/S2542-5196(19)30095-6
Gaps between fruit and vegetable production, demand, and recommended consumption at global and national levels: an integrated modelling study
Abstract
Background: Current diets are detrimental to both human and planetary health and shifting towards more balanced, predominantly plant-based diets is seen as crucial to improving both. Low fruit and vegetable consumption is itself a major nutritional problem. We aim to better quantify the gap between future fruit and vegetable supply and recommended consumption levels by exploring the interactions between supply and demand in more than 150 countries from 1961 to 2050.
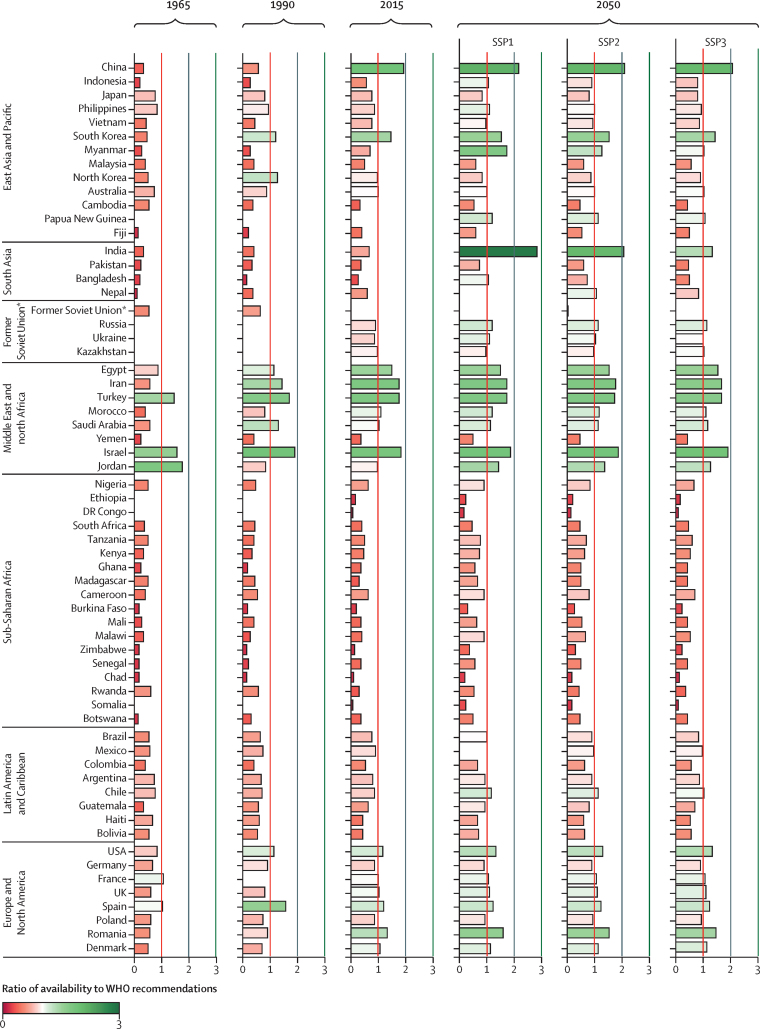
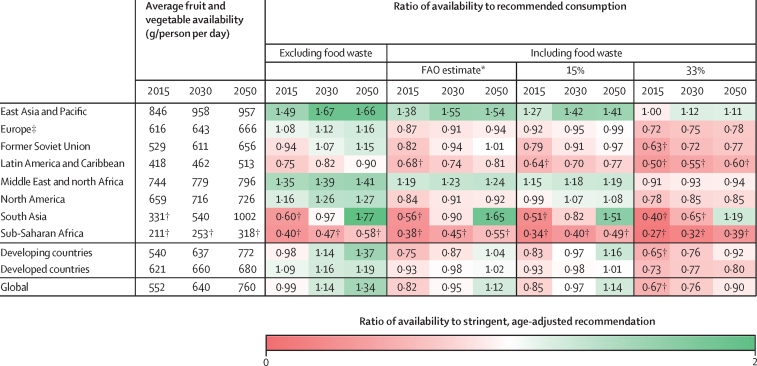
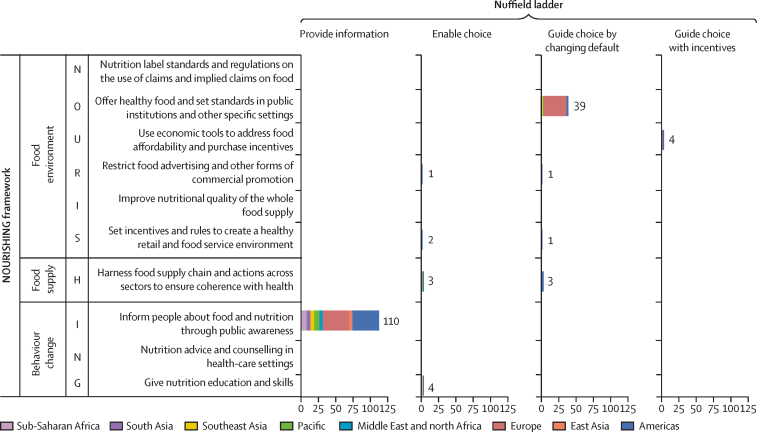
Methods: In this global analysis, we use the International Model for Policy Analysis of Agricultural Commodities and Trade, which simulates the global agricultural sector, to explore the role of insufficient production of fruits and vegetables and the effects of food waste and public policy in achieving recommended fruit and vegetable consumption. First, we estimate the average historical (1961-2010) and future (2010-50) national consumption levels needed to meet WHO targets (a minimum target of 400 g/person per day or age-specific recommendations of 330-600 g/person per day) using population pyramids; for future consumption, we use projections from the Shared Socioeconomic Pathways (SSPs), a set of global socioeconomic scenarios characterised by varied assumptions on economic and population growth. We then simulate future fruit and vegetable production and demand to 2050 under three such scenarios (SSP1-3) to assess the potential impacts of economic, demographic, and technological change on consumer and producer behaviour. We then explore the potential effects of food waste applying various waste assumptions (0-33% waste). Finally, we apply two policy analysis frameworks (the NOURISHING framework and the Nuffield ladder) to assess the current state of public policy designed to achieve healthy diets.
Findings: Historically, fruit and vegetable availability has consistently been insufficient to supply recommended consumption levels. By 2015, 81 countries representing 55% of the global population had average fruit and vegetable availability above WHO's minimum target. Under more stringent age-specific recommendations, only 40 countries representing 36% of the global population had adequate availability. Although economic growth will help to increase fruit and vegetable availability in the future, particularly in lower-income countries, this alone will be insufficient. Even under the most optimistic socioeconomic scenarios (excluding food waste), many countries fail to achieve sufficient fruit and vegetable availability to meet even the minimum recommended target. Sub-Saharan Africa is a particular region of concern, with projections suggesting, by 2050, between 0·8 and 1·9 billion people could live in countries with average fruit and vegetable availability below 400 g/person per day. Food waste is a serious obstacle that could erode projected gains. Assuming 33% waste and socioeconomic trends similar to historical patterns, the global average availability in 2050 falls below age-specific recommendations, increasing the number of people living in countries with insufficient supply of fruits and vegetables by 1·5 billion compared with a zero waste scenario.
Interpretation: Increasing fruit and vegetable consumption is an important component of a shift towards healthier and more sustainable diets. Economic modelling suggests that even under optimistic socioeconomic scenarios future supply will be insufficient to achieve recommended levels in many countries. Consequently, systematic public policy targeting the constraints to producing and consuming fruits and vegetables will be needed. This will require a portfolio of interventions and investments that focus on increasing fruit and vegetable production, developing technologies and practices to reduce waste without increasing the consumer cost, and increasing existing efforts to educate consumers on healthy diets.
Funding: The Commonwealth Scientific and Industrial Research Organisation; Climate Change, Agriculture and Food Security (CGIAR) Research Program on Climate Change, Agriculture and Food Security; CGIAR Research Program on Policy, Institutions, and Markets; Bill & Melinda Gates Foundation; and Johns Hopkins University.
Copyright © 2019 The Author(s). Published by Elsevier Ltd. This is an Open Access article under the CC BY 4.0 license. Published by Elsevier Ltd.. All rights reserved.
Figures
References
-
- FAO. IFAD. UNICEF. WHO. WFP . UN Food and Agriculture Organization; Rome: 2017. The state of food security and nutrition in the world 2017: building resilience for peace and food security.
-
- Tilman D, Clark M. Global diets link environmental sustainability and human health. Nature. 2014;515:518–522. - PubMed
-
- Reardon T, Echeverria R, Berdegué J. Rapid transformation of food systems in developing regions: highlighting the role of agricultural research and innovations. Agric Syst. 2018;172:47–59.
-
- Willett W, Rockström J, Loken B. Food in the Anthropocene: the EAT–Lancet Commission on healthy diets from sustainable food systems. Lancet. 2019;6736:3–49. - PubMed
Publication types
MeSH terms
LinkOut - more resources
Full Text Sources
Miscellaneous
