

Fully Automated, Quality-Controlled Cardiac Analysis From CMR: Validation and Large-Scale Application to Characterize Cardiac Function
- PMID: 31326477
- PMCID: PMC7060799
- DOI: 10.1016/j.jcmg.2019.05.030
Fully Automated, Quality-Controlled Cardiac Analysis From CMR: Validation and Large-Scale Application to Characterize Cardiac Function
Abstract
Objectives: This study sought to develop a fully automated framework for cardiac function analysis from cardiac magnetic resonance (CMR), including comprehensive quality control (QC) algorithms to detect erroneous output.
Background: Analysis of cine CMR imaging using deep learning (DL) algorithms could automate ventricular function assessment. However, variable image quality, variability in phenotypes of disease, and unavoidable weaknesses in training of DL algorithms currently prevent their use in clinical practice.
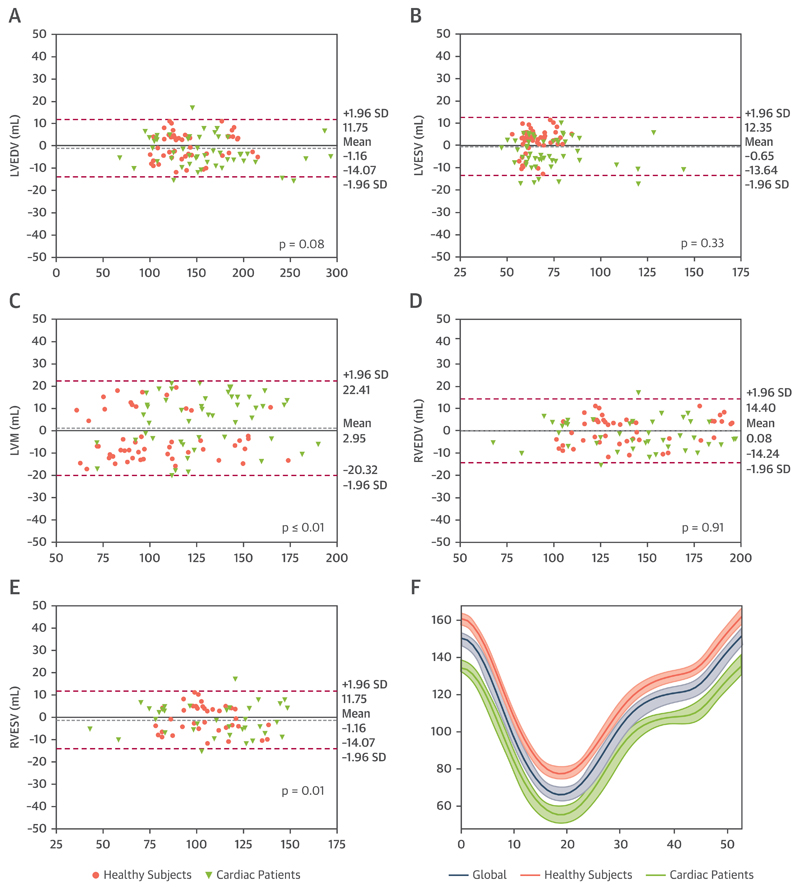
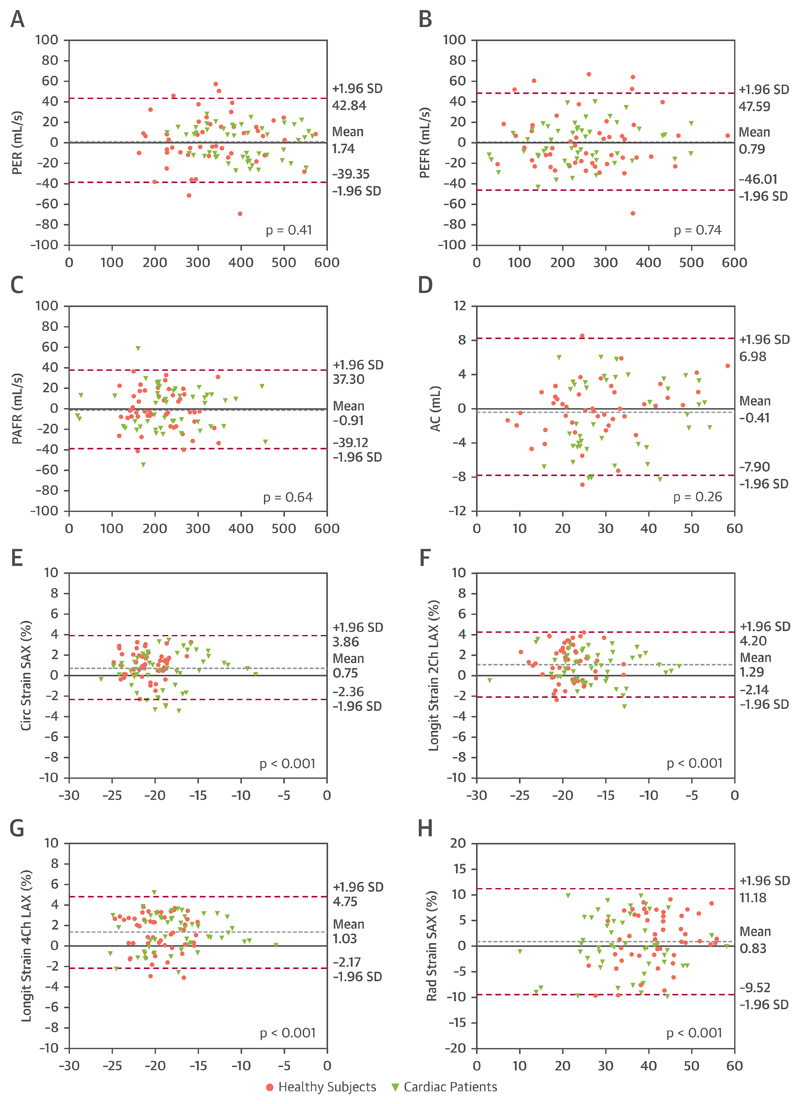
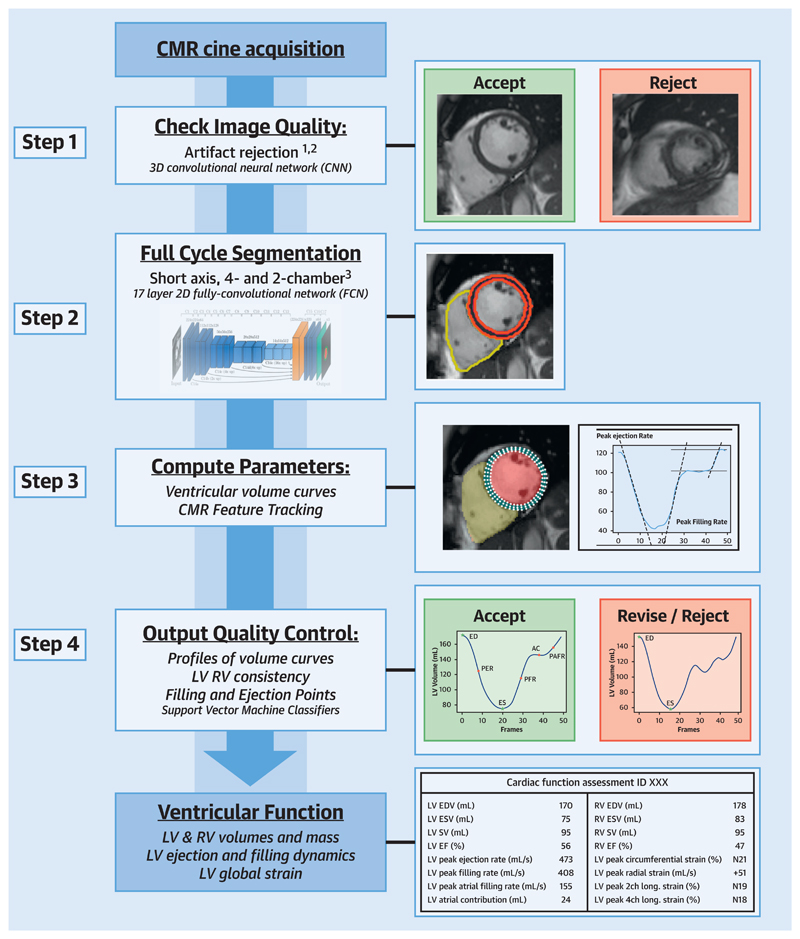
Methods: The framework consists of a pre-analysis DL image QC, followed by a DL algorithm for biventricular segmentation in long-axis and short-axis views, myocardial feature-tracking (FT), and a post-analysis QC to detect erroneous results. The study validated the framework in healthy subjects and cardiac patients by comparison against manual analysis (n = 100) and evaluation of the QC steps' ability to detect erroneous results (n = 700). Next, this method was used to obtain reference values for cardiac function metrics from the UK Biobank.
Results: Automated analysis correlated highly with manual analysis for left and right ventricular volumes (all r > 0.95), strain (circumferential r = 0.89, longitudinal r > 0.89), and filling and ejection rates (all r ≥ 0.93). There was no significant bias for cardiac volumes and filling and ejection rates, except for right ventricular end-systolic volume (bias +1.80 ml; p = 0.01). The bias for FT strain was <1.3%. The sensitivity of detection of erroneous output was 95% for volume-derived parameters and 93% for FT strain. Finally, reference values were automatically derived from 2,029 CMR exams in healthy subjects.
Conclusions: The study demonstrates a DL-based framework for automated, quality-controlled characterization of cardiac function from cine CMR, without the need for direct clinician oversight.
Keywords: CMR feature tracking; cardiac aging; cardiac function; cardiac magnetic resonance; machine learning; quality control.
Crown Copyright © 2020. Published by Elsevier Inc. All rights reserved.
Figures
Comment in
-
Machine Learning in Medical Imaging: All Journeys Begin With a Single Step.JACC Cardiovasc Imaging. 2020 Mar;13(3):696-698. doi: 10.1016/j.jcmg.2019.08.028. Epub 2019 Nov 13. JACC Cardiovasc Imaging. 2020. PMID: 31734203 No abstract available.
References
-
- Maceira A, Prasad S, Khan M, Pennell D. Normalized left ventricular systolic and diastolic function by steady state free precession cardiovascular magnetic resonance. J Cardiovasc Magn Reson. 2006;8:417–26. - PubMed
-
- Claus P, Omar AMS, Pedrizzetti G, Sengupta PP, Nagel E. Tissue tracking technology for assessing cardiac mechanics: principles, normal values, and clinical applications. J Am Coll Cardiol Img. 2015;8:1444–60. - PubMed
-
- Nucifora G, Muser D, Tioni C, Shah R, Selvanayagam JB. Prognostic value of myocardial deformation imaging by cardiac magnetic resonance feature-tracking in patients with a first ST-segment elevation myocardial infarction. Int J Cardiol. 2018;271:387–91. - PubMed
Publication types
MeSH terms
Grants and funding
LinkOut - more resources
Full Text Sources
Other Literature Sources
Medical
