

Socioeconomic inequality in recent adverse all-cause mortality trends in Scotland
- PMID: 31326891
- PMCID: PMC6817697
- DOI: 10.1136/jech-2019-212300
Socioeconomic inequality in recent adverse all-cause mortality trends in Scotland
Abstract
Background: Gains in life expectancies have stalled in Scotland, as in several other countries, since around 2012. The relationship between stalling mortality improvements and socioeconomic inequalities in health is unclear.
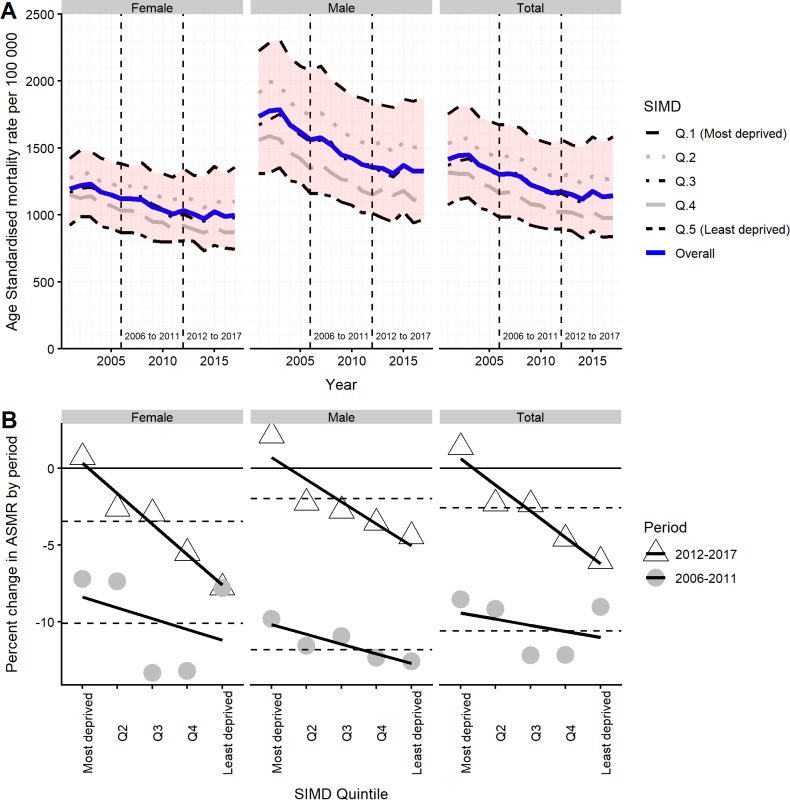
Methods: We calculate the difference, as percentage change, in all-cause, all-age, age-standardised mortality rates (ASMR) between 2006 and 2011 (period 1) and between 2012 and 2017 (period 2), for Scotland overall, by sex, and by Scottish Index of Multiple Deprivation (SIMD) quintile. Linear regression is used to summarise the relationship between SIMD quintile and mortality rate change in each period.
Results: Between 2006 and 2011, the overall ASMR fell by 10.6% (138/100 000), by 10.1% in women, and 11.8% in men, but between 2012 and 2017 the overall ASMR fell by only 2.6% (30/100 000), by 3.5% in women, and by 2.0% in men. Within the most deprived quintile, the overall ASMR fell by 8.6% (143/100 000) from 2006 to 2011 (7.2% in women; 9.8% in men), but rose by 1.5% (21/100 000) from 2012 to 2017 (0.7% in women; 2.1% in men).The socioeconomic gradient in ASMR improvement more than quadrupled, from 0.4% per quintile in period 1, to 1.7% per quintile in period 2.
Conclusion: From 2012 to 2017, socioeconomic gradients in mortality improvement in Scotland were markedly steeper than over the preceding 6 years. As a result, there has not only been a slowdown in overall reductions in mortality, but a widening of socioeconomic mortality inequalities.
Keywords: deprivation; health inequalities; inequalities; mortality; socioeconomic.
© Author(s) (or their employer(s)) 2019. Re-use permitted under CC BY-NC. No commercial re-use. See rights and permissions. Published by BMJ.
Conflict of interest statement
Competing interests: None declared.
Figures
References
-
- Office for National Statistics Changing trends in mortality: a cross-UK comparison, 1981-2016; 2018.
-
- Office for National Statistics Changing trends in mortality: an international comparison: 2000-2016; 2018.
-
- National Records of Scotland "Life Expectancy at Scotland Level - Scottish National Life Tables,” Life Tables for Scotland 2015-2017, 2018. Available: https://www.nrscotland.gov.uk/statistics-and-data/statistics/statistics-... [Accessed 10 Dec 2018].
MeSH terms
LinkOut - more resources
Full Text Sources
Research Materials