. 2019 Sep 5;25(3):329-341.e6.
doi: 10.1016/j.stem.2019.06.011. Epub 2019 Jul 18.

Outcompeting p53-Mutant Cells in the Normal Esophagus by Redox Manipulation

Affiliations

Outcompeting p53-Mutant Cells in the Normal Esophagus by Redox Manipulation

David Fernandez-Antoran et al. Cell Stem Cell. .

Abstract

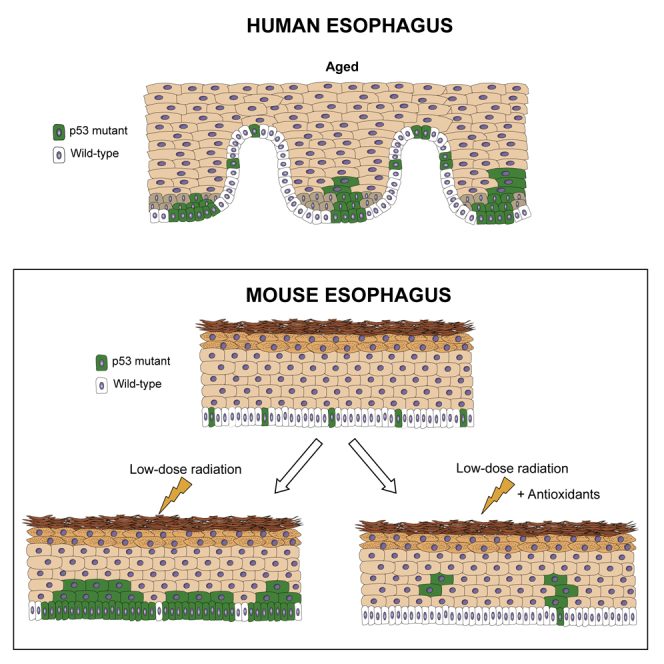
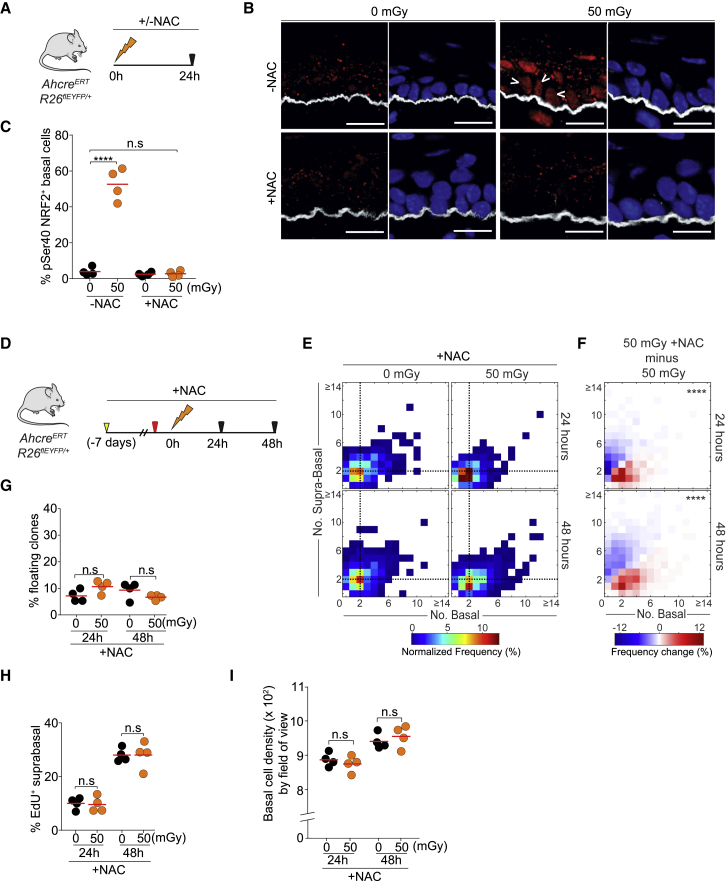
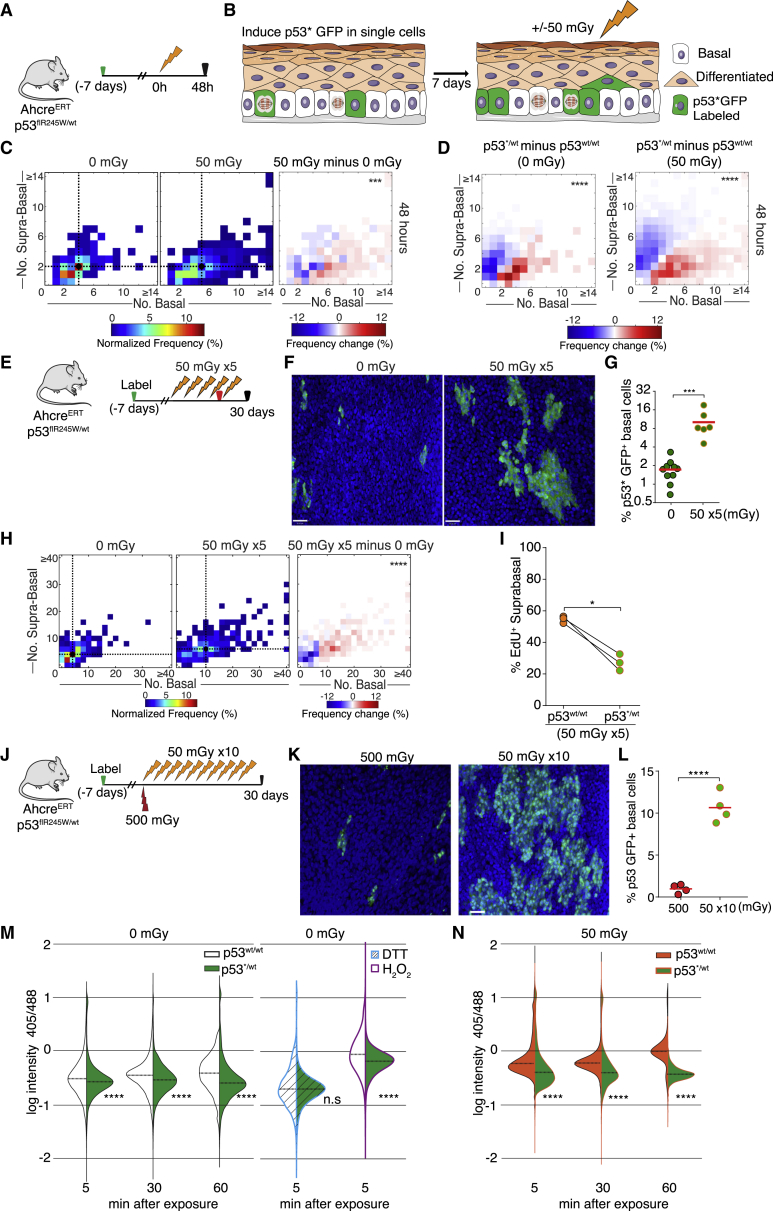
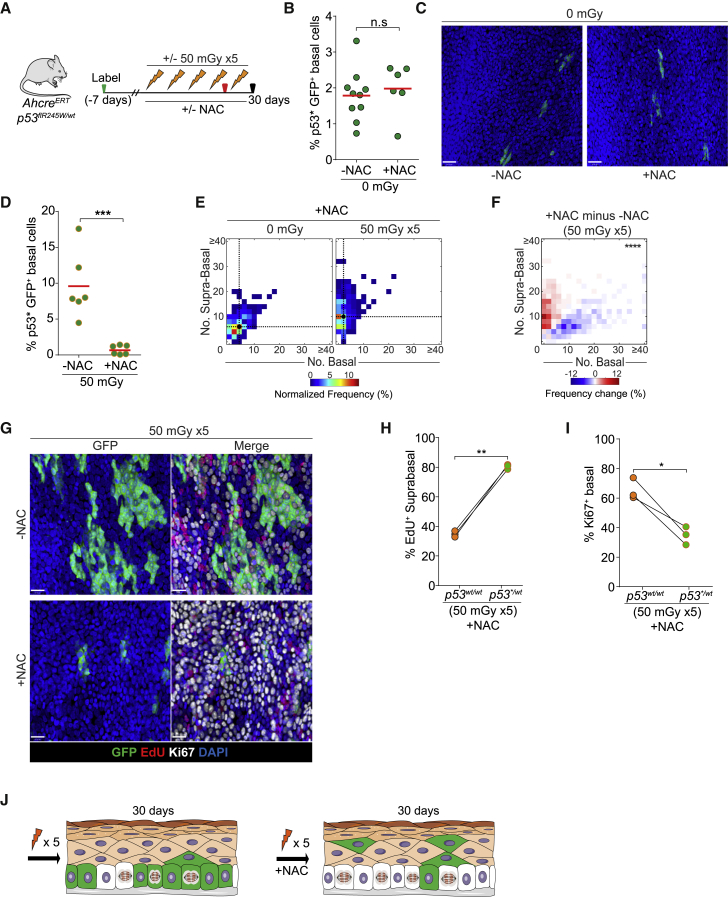
As humans age, normal tissues, such as the esophageal epithelium, become a patchwork of mutant clones. Some mutations are under positive selection, conferring a competitive advantage over wild-type cells. We speculated that altering the selective pressure on mutant cell populations may cause them to expand or contract. We tested this hypothesis by examining the effect of oxidative stress from low-dose ionizing radiation (LDIR) on wild-type and p53 mutant cells in the transgenic mouse esophagus. We found that LDIR drives wild-type cells to stop proliferating and differentiate. p53 mutant cells are insensitive to LDIR and outcompete wild-type cells following exposure. Remarkably, combining antioxidant treatment and LDIR reverses this effect, promoting wild-type cell proliferation and p53 mutant differentiation, reducing the p53 mutant population. Thus, p53-mutant cells can be depleted from the normal esophagus by redox manipulation, showing that external interventions may be used to alter the mutational landscape of an aging tissue.

Keywords: NFE2L2; TP53; cell competition; cell tracing; differentiation; ionizing radiation; mitochondria; oxidative stress; somatic mutation; stem cell.


Conflict of interest statement

The authors declare no competing interests.

Figures

None
Graphical abstract
Figure 1
Figure 1
Cell Behavior in Mouse Esophageal Epithelium (A) Cartoon showing the mouse esophageal epithelium structure. Progenitor cells in the basal layer divide to generate progenitor and differentiating daughter cells. The latter subsequently exit the cell cycle and migrate out of the basal layer through the suprabasal cell layers to the epithelial surface from which they are shed. Progenitor division may generate two progenitors, two differentiated cells, or one of each cell type. The probabilities of each symmetric division outcome (indicated by percentages) are balanced so that, on average, across the basal layer, each division generates 50% progenitors and 50% differentiating cells. (B) Clonal dynamics. The behavior of progenitors results in most cells that acquire a neutral mutation being lost by differentiation and shedding within a few rounds of division (left clone). Only a few clones will expand to a size that means they are likely to persist long term (right clone). (C) Positively selected mutants tilt the normally balanced average division outcome toward proliferation, increasing the proportion of persisting mutant clones, whereas a negatively selected mutation that tilts fate toward differentiation will be depleted from the tissue because an increased proportion of clones will be lost by shedding.
Figure 2
Figure 2
LDIR Promotes Keratinocyte Progenitor Differentiation In Vivo (A) Experimental protocol: cre was induced 7 days before irradiation in yellow fluorescent protein (YFP) reporter mice (RYFP, yellow arrow). Samples were collected 24 and 48 h after irradiation. (B) Lineage cell tracing in EE. YFP is induced in single progenitor cells in the basal cell layer, which generate YFP-expressing clones. (C) Rendered confocal z stacks showing side views of a typical basal clone containing one or more basal cells (top panel) and a floating clone with no basal cells (bottom). Arrowheads indicate basal cells (red) and suprabasal cells (white). Dashed lines indicate the basement membrane. Scale bars, 10 μm. (D) Heatmaps representing the frequency of clone sizes with the number of basal and supra-basal cells indicated (left panels) and differences between 0 and 50 mGy irradiated animals (right panels) at 24 and 48 h. Black dots and dashed lines indicate the geometric median clone size. Average total clone size is indicated within each plot. ∗∗∗∗p = 6 × 10−8 and 5 × 10−48 at 24 and 48 h, respectively (Peacock’s test). n = 1000 clones per condition at 24 h and 1,530 (0 mGy) and 1,800 (50 mGy) clones at 48 h. (E and F) Percentage of floating to total clones (E) and basal cell density (F) 24 and 48 h after irradiation. Each dot is the mean value from one mouse. ∗∗∗∗p < 0.0001, ∗∗∗p < 0.001, and ∗∗p < 0.01 (unpaired t test). In (F), at least 12,000 basal cells were analyzed per condition. (G) Summary. After LDIR, basal cell density decreases, and numerous floating clones appear as cells migrate out of the basal layer. Proliferation then increases, and by 10 days, the epithelium is restored to normal. (H) Primary EE culture protocol. EE generated from explants was treated with a 1-h pulse of EdU (red arrow) exposed to LDIR and analyzed 24 h later. (I) Rendered confocal z stacks of typical cultures 24 h after 0 or 50 mGy LDIR. Differentiated suprabasal keratinocytes stain for KRT4 (red), wheat germ agglutinin (white), and DAPI (blue). Scale bars, 25 μm. (J) and (K) In vitro EdU lineage tracing. Shown are the percentage of EdU+ suprabasal cells (J) and percentage of EdU+ total cells (K) after 0 or 50 mGy LDIR. Each point represents the mean from a biological replicate culture from a different mouse. ∗∗p < 0.01, p < 0.05 (unpaired t test); n = 6; total EdU+ cells, 1,291 (0 mGy), 4,256 (50 mGy). See also Figures S1–S4 and Tables S2 and S4.
Figure 3
Figure 3
The Mitochondrial Redox Balance Is Significantly Altered after 50 mGy of LDIR in Primary Mouse Keratinocytes (A) Experimental protocol. Primary 3D cultures of EE were infected with an adenovirus encoding a genetic sensor of the mitochondrial redox state, irradiated, and imaged. (B) The Mito-Grx1-roGFP2 reporter is localized to mitochondria. The reduced and oxidized states of the probe are differentially excited by 405 nm and 488 nm light, so the ratio of fluorescence after excitation at the two wavelengths indicates the redox state (Gutscher et al., 2008). (C) Representative rendered confocal z stacks showing 405 nm/488 nm emission ratios from mitochondria in Mito-Grx1-roGFP2-expressing keratinocytes 60 min after 0 or 50 mGy LDIR, indicated by the pseudo-color scale. Scale bars, 20 μm. Negative (DTT-treated) and positive (H2O2-treated) controls for oxidation are shown as well. Scale bars, 15 μm. (D) Violin plots of the distribution of 405/488 ratios for individual mitochondria in Mito-Grx1-roGFP2 reporter-expressing keratinocytes 5, 30, and 60 min after LDIR, obtained by quantitative confocal 3D imaging. Controls are oxidized (hydrogen peroxide [H2O2]-treated) and reduced (DTT-treated) cells ∗∗∗∗p < 0.0001, ∗∗∗p < 0.001 (Mann-Whitney U test). n is the number of mitochondria imaged under each condition, shown in Table S2. Three biological replicate experiments were performed; results from a representative experiment are shown. (E) Violin plots showing the effect of DTT treatment on irradiated cells. ∗∗∗∗p < 0.0001, ∗∗∗p < 0.001 (Mann-Whitney U test). (F–I) Experimental protocol. (F) Primary 3D cultures of EE were labeled with EdU for 1 h and treated with H2O2 24 h before immunostaining. (G) Rendered confocal z stacks of typical cultures 24 h after treatment with the control (Ctrl) or 100 μM H2O2. Differentiated suprabasal keratinocytes were stained for KRT4 (red) and DAPI (blue). Dashed lines indicate the insert’s membrane. Scale bars, 20 μm. (H and I) In vitro EdU lineage tracing. Shown are the percentage of EdU+ suprabasal cells (H) and percentage of EdU+ total cells (I) after treatment with the Ctrl or 100 μM H2O2. Each point represents the mean from a biological replicate culture from a different mouse. ∗∗p < 0.01 (unpaired t test), n = 3; total EdU+ cells, 2,435 (Ctrl) and 3,256 (H2O2). (J–L) Transcriptional profile of irradiated EE cultures from wild-type C57BL/6J and Nrf2−/− mice. (J) Experimental protocol. RNA-seq was performed on biological triplicate cultures 1 and 24 h after 0 or 50 mGy of LDIR. (K and L) MA plots of RNA-seq data of cultures from C57BL/6J (K) and Nrf2−/− mice (L) comparing irradiated and unirradiated cultures at the times shown; red indicates differentially expressed transcripts with adjusted p < 0.05. (M and N) Rendered confocal z stacks of C57BL/6J (M) and Nrf2−/− (N) cultures 24 h after 0 or 50 mGy LDIR. Differentiated suprabasal keratinocytes were stained for KRT4 (red) and DAPI (blue). Scale bars, 25 μm. See also Figure S4 and Tables S1 and S4.
Figure 4
Figure 4
Antioxidant Treatment Abolishes NRF2 Nuclear Translocation and Radiation-Induced Differentiation In Vivo (A) Experimental protocol. YFP reporter mice were exposed to 0 or 50 mGy of LDIR with or without NAC treatment, and EE samples were taken 24 h later. (B) NRF2 (phospho-serine40) staining (red) in optimal cutting temperature compound (OCT)-embedded, 10-μm-thick cryosections of EE of Cyp1A1creERTRosa26flEYFP/WT from (A). Arrowheads show basal cell nuclei positive for NRF2. Also shown are the basement membrane marker ITGA6 (white) and DAPI (blue). Scale bars, 14 μm. (C) Quantification of pSer40 NRF2+ basal cells shown in (B). Points are mean values from individual mice. ∗∗∗∗p < 0.0001; n.s., not significant (unpaired t test); n = 4 mice. (D) Experimental protocol. YFP reporter mice were given the oral antioxidant N-acetyl cysteine (NAC) 7 days after cell labeling with YFP (yellow arrow) and throughout the experiment, and EdU was injected 1 h prior to LDIR (red arrow). Clone sizes were analyzed 24 and 48 h after irradiation. (E) Heatmaps showing the frequency of clones containing a number of basal and suprabasal cells observed in 50 mGy versus 0 mGy irradiated animals under NAC treatment. Black dots and dashed lines show geometric median clone size. (F) Frequency of changes observed in 50 mGy NAC-treated versus 50 mGy non-treated animals. ∗∗∗∗p < 0.0001 (Peacock’s test), n = 600 clones per condition. (GI) Percentage of floating clones (G), percentage of EdU+ suprabasal cells (H), and basal cell density (I) 24 h and 48 h after 0 or 50 mGy LDIR. Points are mean values from individual mice. n.s., p > 0.05 by unpaired t test; n = 4 mice per condition. See also Tables S2 and S4.
Figure 5
Figure 5
The p53∗/WT Mutant Population Expands after Single Exposure or Multiple Exposures to LDIR (A) Experimental protocol. Mice with a conditional p53R245W-GFP/WT (p53∗/WT) allele were induced (green arrow), giving p53 and GFP expression in single progenitor cells. 7 days later, animals were irradiated with a single exposure of 50 mGy of LDIR and culled 48 h after the last irradiation. (B) Cartoon of lineage tracing in this protocol. (C) Heatmaps showing the frequency of p53∗/WT clones containing the number of basal and suprabasal cells indicated (left panels) and the frequency change observed when comparing 0 and 50 mGy irradiated animals (right panel). Black dots, geometric clone-size median. ∗∗∗p = 0.0007 (Peacock’s test); n = 150 and 450, respectively. (D) Heatmaps showing the frequency change observed when comparing p53∗/WT and p53WT/WT (wild-type) clones 48 h after exposure to 0 or 50 mGy LDIR. ∗∗∗∗p < 0.0001 (Peacock’s test). (E) Experimental protocol. Mice with a conditional p53R245W-GFP/WT (p53∗/WT) allele were induced (green arrow), giving p53 and GFP expression in single progenitor cells. 7 days later, animals were irradiated with five doses of 50 mGy of LDIR over 30 days, commenced with a minimal separation of 3 days between each dose. EdU was given 1 h prior to the last irradiation (red arrow), and animals were culled 48 h later. (F) Top-down views of confocal z stacks of typical EE whole mounts showing p53∗/WT clones (green) after 0 or 50 mGy × 5 LDIR. Basal layer cells are shown (DAPI, blue). Scale bars, 28 μm. (G) Percentage of p53∗/WT basal cells after 0 or 50 mGy × 5. Points show mean values from individual mice. ∗∗∗p < 0.001 (t test); n = 7 (0 mGy) and n = 6 (50 mGy) mice. (H) Heatmaps showing the frequency of p53∗/WT clones containing the number of basal and suprabasal cells of the indicated sizes (left panels) and the frequency change observed in 0 and 50 mGy × 5 doses irradiated animals (right panel). Black dots and dashed lines indicate geometric median clone size. ∗∗∗∗p < 0.0001 (Peacock’s test), n = 300 clones per condition. (I) Comparison of p53∗/WT clones with adjacent p53WT/WT EE in the same irradiated animal. Shown is the percentage of EdU+ suprabasal cells. Points show mean values from 3 mice, and lines link the same animal. p < 0.05 (paired t test). (J) Experimental protocol to study repeated radiation exposure. p53R245W-GFP/WT mice were induced as in (A) and (E), and 7 days later, animals were irradiated with a single dose of 500 mGy or with a course of ten doses of 50 mGy. At 30 days, both groups were analyzed for p53∗/WT clone size. (K) Top-down views of confocal z stacks of typical EE whole mounts showing p53∗/WT clones (green) 1 month after 500 mGy or 50 mGy × 10 LDIR. Basal layer cells are shown (DAPI, blue). Scale bars, 30 μm. (L) Percentage of p53∗/WT basal cells shown in (K). ∗∗∗∗p < 0.0001 (t test). At least 25,000 basal cells were quantified per condition. n = 4 mice per condition. (M) and (N) Primary keratinocyte 3D cultures from p53WT/WT and p53∗/WT EE were infected with an adenovirus encoding a genetic sensor of the mitochondrial redox state and irradiated, and single mitochondria were imaged by confocal microscopy. Violin plots show the distribution of 405/488 ratios for individual mitochondria in Mito-Grx1-roGFP2 reporter-expressing keratinocytes from p53WT/WT (white in M; orange in N) and p53∗/WT (green) 5, 30, and 60 min after 0 mGy (M) or 50 mGy LDIR (N), obtained by quantitative confocal 3D imaging. Controls are oxidized (H2O2-treated) and reduced (DTT-treated) cells for each strain. ∗∗∗∗p < 0.0001 (Mann-Whitney U test). The numbers of mitochondria imaged under each condition are shown in Table S1. Three biological replicate experiments were performed; results from a representative experiment are shown. See also Figures S1 and S5 and Tables S2 and S4.
Figure 6
Figure 6
The p53∗/WT Mutant Population Decreases after Combined Antioxidant Treatment and Several LDIR Exposures (A) Experimental protocol. Mice were given the oral antioxidant NAC 7 days after the p53∗/WT allele was induced (green arrow) and kept throughout the experiment. Animals were irradiated with five doses of 50 mGy LDIR over 30 days, commenced with a minimal separation of 3 days between each dose. EdU was injected 1 h prior the last irradiation (red arrow). (B) Percentage of p53∗/WT basal cells in mice treated with or without NAC and non-irradiated. Points show mean values from individual mice. n.s., p > 0.05 by unpaired t test; n = 10 mice (−NAC) and n = 6 mice (+NAC). (C) Top-down views of confocal z stacks of typical EE whole mounts showing p53∗/WT clones (green) under –NAC and +NAC treatments. Basal layer cells are shown. DAPI is shown in blue. Scale bars, 28 μm. (D) Percentage of p53∗/WT basal cells in mice exposed to 50 mGy × 5 and treated with NAC or left untreated. Points show mean values from individual mice. ∗∗∗p < 0.001 (t test), n = 6 mice per condition. (E) Heatmaps showing clone sizes in 0 and 50 mGy × 5 irradiated mice treated with NAC. Black dots and dashed lines indicate geometric median clone size. (F) Frequency change of NAC-treated versus non-treated mice exposed to 50 mGy × 5 LDIR. ∗∗∗∗p < 0.0001 (Peacock’s test), n = 300 clones per condition. (G) Top-down views of confocal z stacks of typical EE whole mounts showing p53∗/WT clones (green), Ki67+ basal cells (white), and EdU+ basal cells (red) after 50 mGy × 5 LDIR without or with NAC treatment. Basal layer cells are shown (DAPI, blue). Scale bars, 40 μm. (H and I) Comparison of p53∗/WT clones with adjacent p53WT/WT EE in the same irradiated animal treated with NAC. Shown are the percentages of EdU+ suprabasal cells (H) and Ki67+ basal cells (I). Points show mean values from 3 mice, and lines link the same animal. ∗∗p < 0.01, p < 0.05 (paired t test). (J) Summary. 30 days after 5 doses of 50 mGy, p53∗/WT clones have expanded through the tissue, replenishing empty space left by p53WT/WT clones when they differentiate. When animals are co-treated with the same 5 doses of 50 mGy plus NAC, p53∗/WT clones are displaced from the tissue by p53WT/WT clones. See also Figures S1 and S6 and Tables S2 and S4.

Comment in

References

    1. Alcolea M.P., Jones P.H. Tracking cells in their native habitat: lineage tracing in epithelial neoplasia. Nat. Rev. Cancer. 2013;13:161–171. - PubMed
    1. Alcolea M.P., Jones P.H. Cell competition: winning out by losing notch. Cell Cycle. 2015;14:9–17. - PMC - PubMed
    1. Alcolea M.P., Greulich P., Wabik A., Frede J., Simons B.D., Jones P.H. Differentiation imbalance in single oesophageal progenitor cells causes clonal immortalization and field change. Nat. Cell Biol. 2014;16:615–622. - PMC - PubMed
    1. Anders S., Pyl P.T., Huber W. HTSeq--a Python framework to work with high-throughput sequencing data. Bioinformatics. 2015;31:166–169. - PMC - PubMed
    1. Azzam E.I., Jay-Gerin J.P., Pain D. Ionizing radiation-induced metabolic oxidative stress and prolonged cell injury. Cancer Lett. 2012;327:48–60. - PMC - PubMed

Publication types

MeSH terms