. 2019 Jun;66(6):960-968.
doi: 10.1109/TNS.2019.2917144. Epub 2019 May 15.

Pulse pileup analysis for a double-sided silicon strip detector using variable pulse shapes

Affiliations

Pulse pileup analysis for a double-sided silicon strip detector using variable pulse shapes

Jinghui Wang et al. IEEE Trans Nucl Sci. 2019 Jun.

Abstract

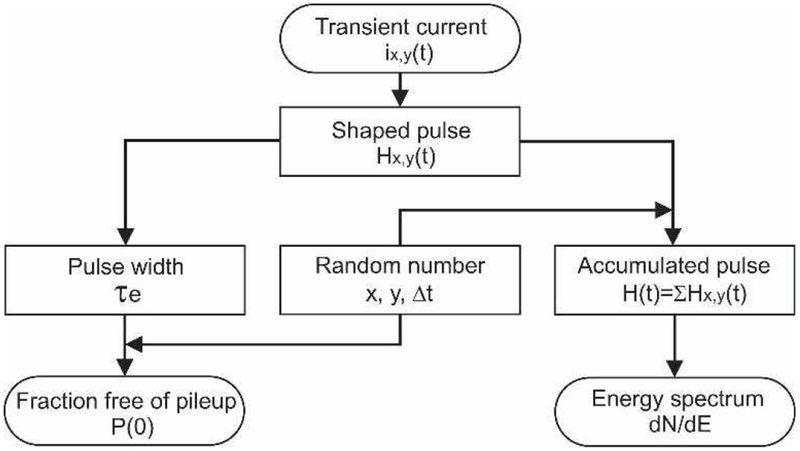
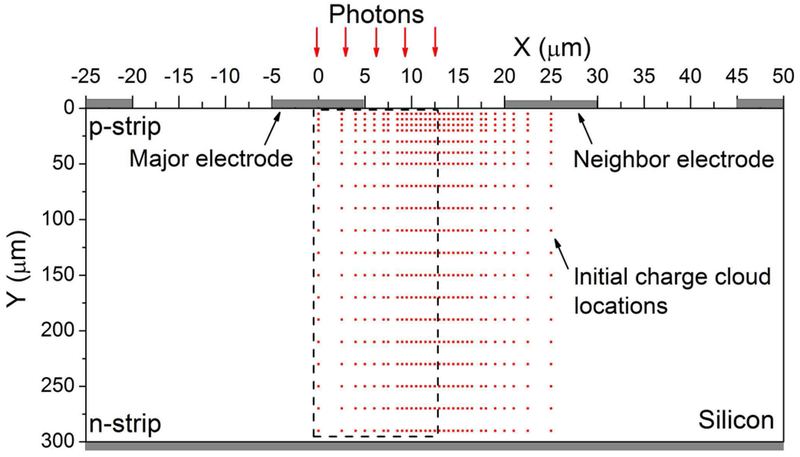
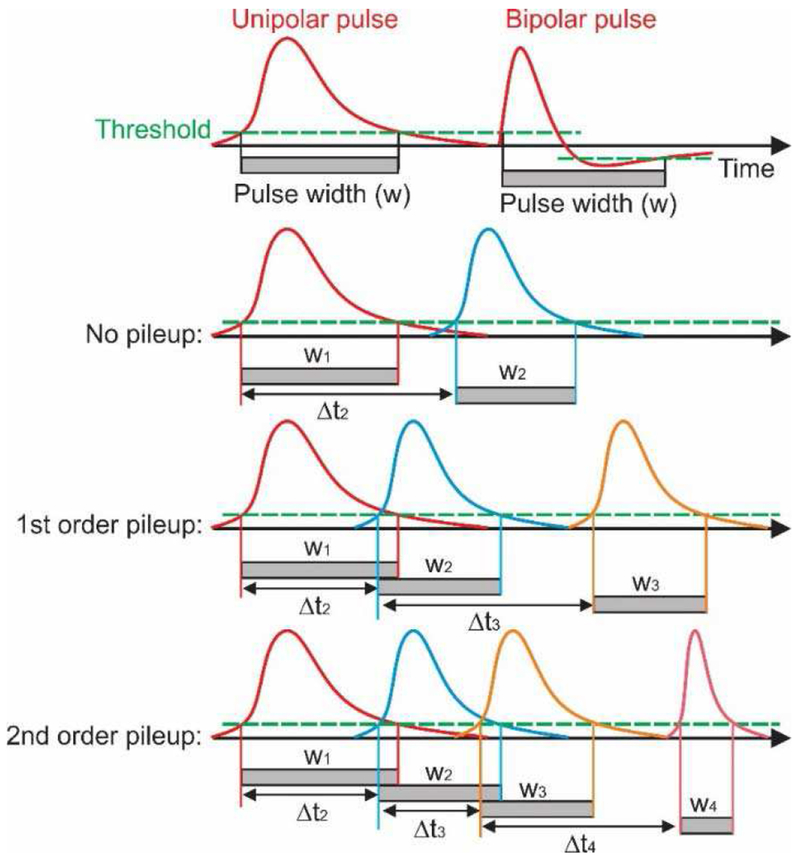
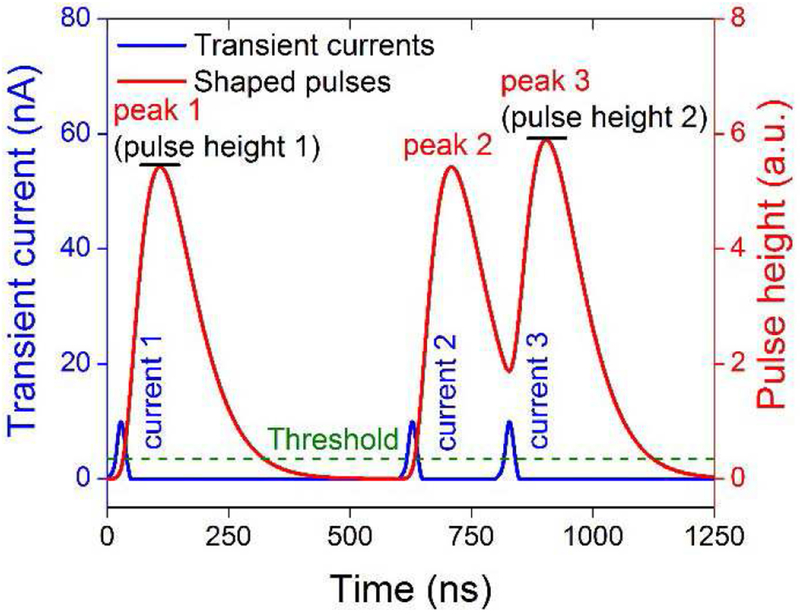
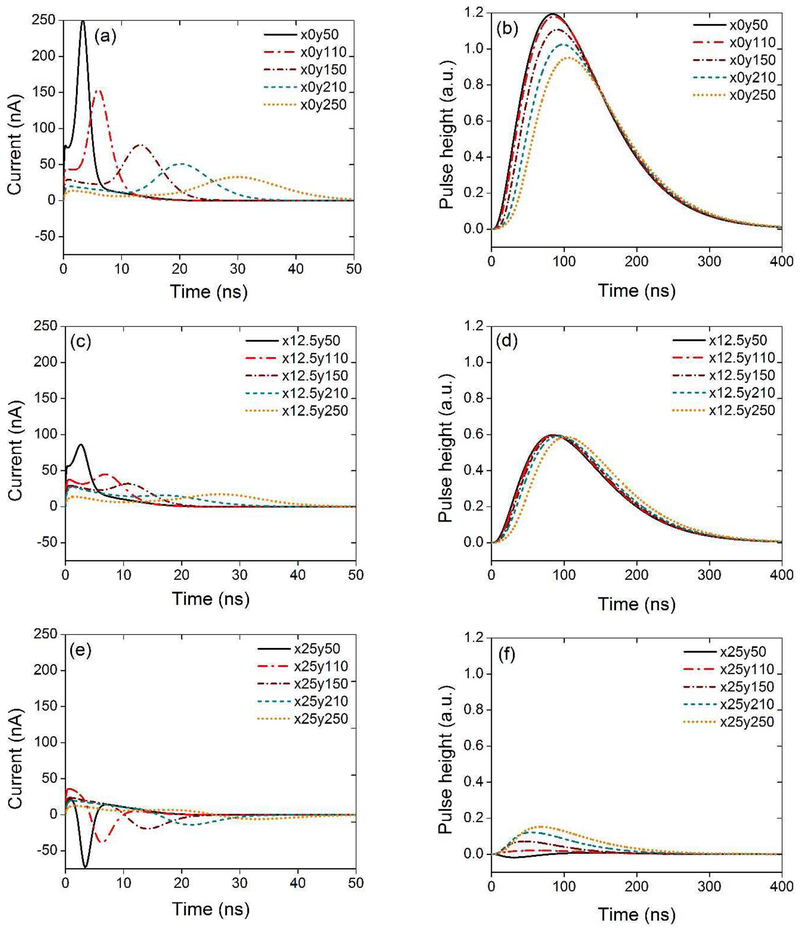
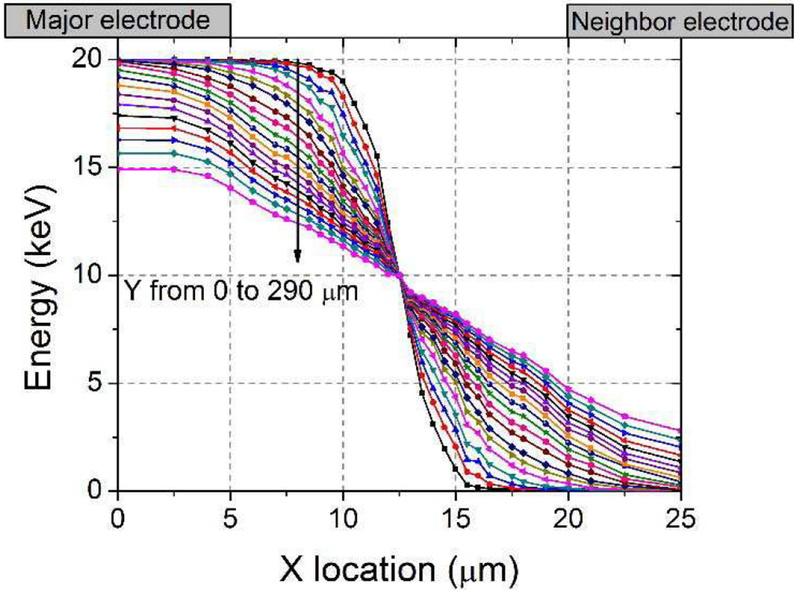
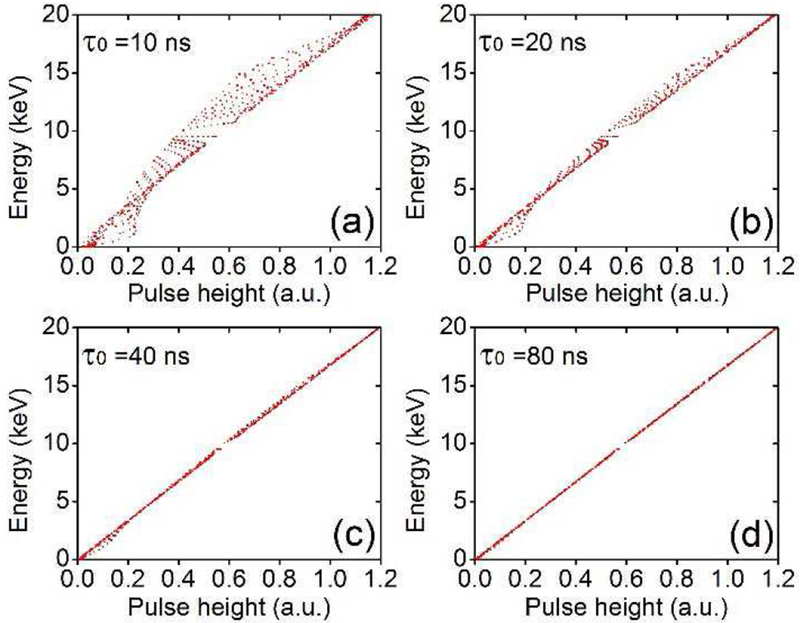
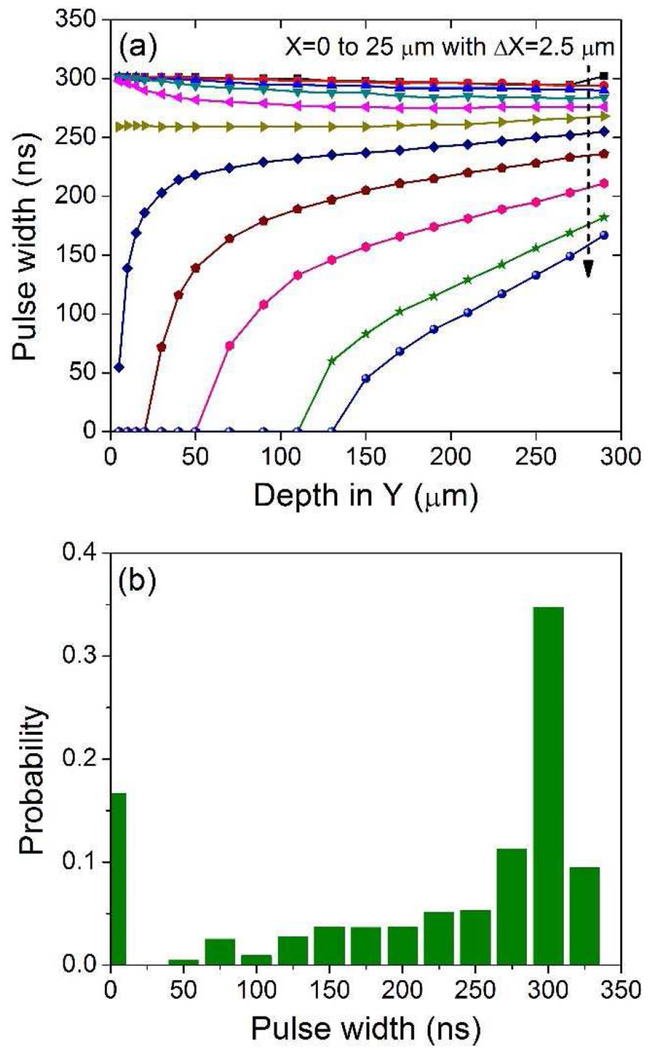
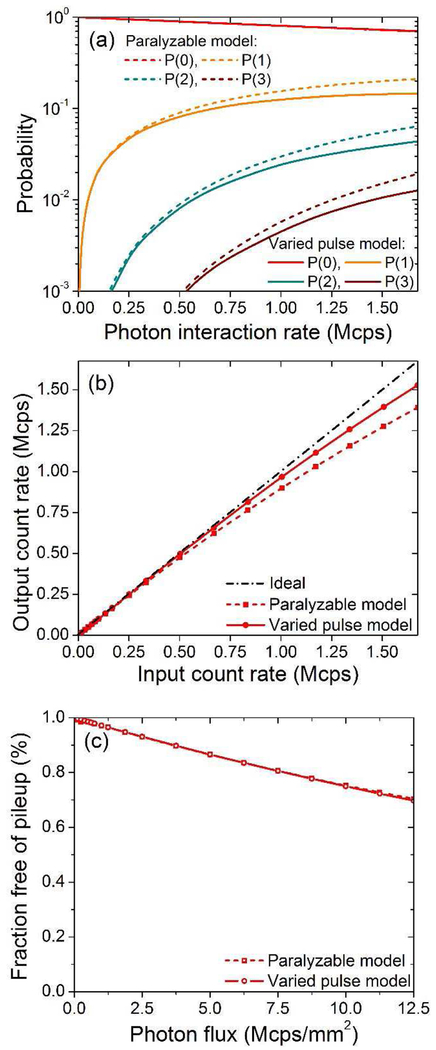
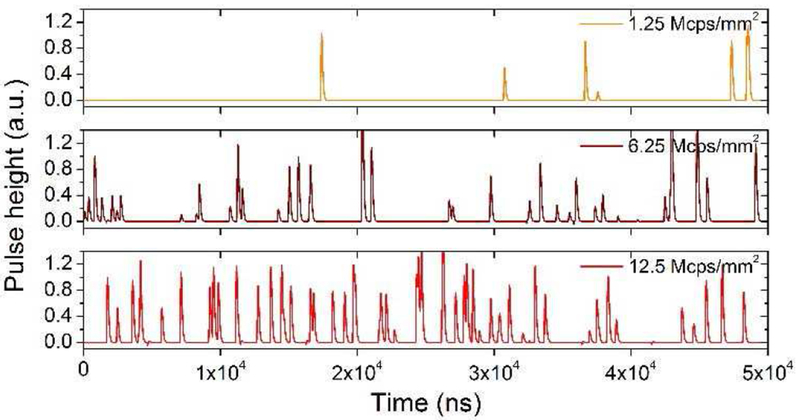
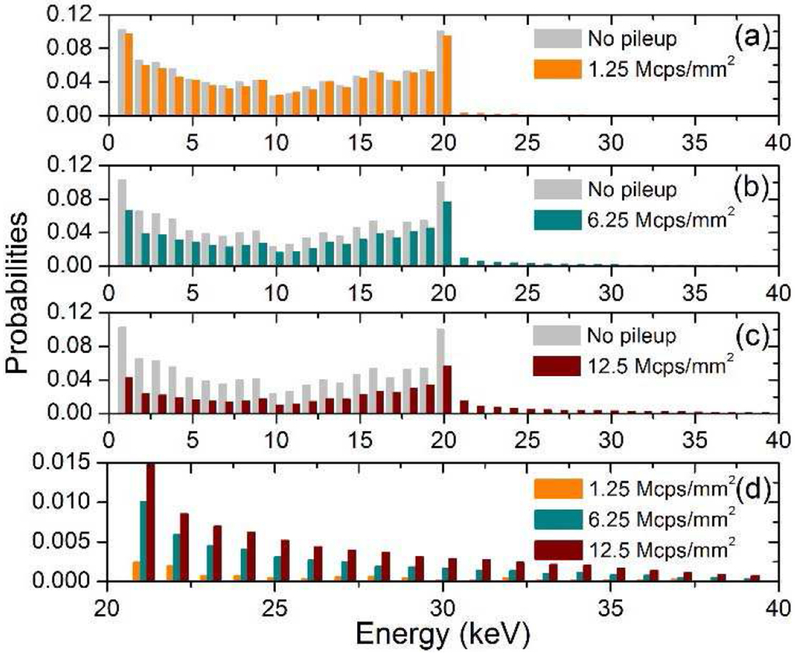
Due to pulse pileup, photon counting detectors (PCDs) suffer from count loss and energy distortion when operating in high count rate environments. In this paper, we studied the pulse pileup of a double-sided silicon strip detector (DSSSD) to evaluate its potential application in a mammography system. We analyzed the pulse pileup using pulses of varied shapes, where the shape of the pulse depends on the location of photon interaction within the detector. To obtain the shaped pulses, first, transient currents for photons interacting at different locations were simulated using a Technology Computer-Aided Design (TCAD) software. Next, the currents were shaped by a CR-RC2 shaping circuit, calculated using Simulink. After obtaining these pulses, both the different orders of pileup and the energy spectrum were calculated by taking into account the following two factors: 1) spatial distribution of photon interactions within the detector, and 2) time interval distribution between successive photons under a given photon flux. We found that for a DSSSD with thickness of 300 μm, pitch of 25 μm and strip length of 1 cm, under a bias voltage of 50 V, the variable pulse shape model predicts the fraction free of pileup can be > 90 % under a photon flux of 3.75 Mcps/mm2. The double-sided silicon-strip detector is a promising candidate for digital mammography applications.

Keywords: double-sided silicon strip detector; paralyzable detection model; photon counting detector; pulse pileup.


Conflict of interest statement

Disclosure of conflicts of interest M.P. discloses financial interests in Prismatic Sensors AB. All other authors have no relevant conflicts of interest to disclose.

Figures

Fig. 1.
Fig. 1.
Flowchart of pulse pileup analysis process.
Fig. 2.
Fig. 2.
Schematic cross section of the DSSSD for TCAD transient current simulation. The simulated device is 300 μm thick with a pitch of 25 μm. The silicon substrate has n-type doping of 5.6×1011 cm−3. The transient currents collected on both the major and neighbor electrodes are calculated. The major collecting electrode is the electrode with a shorter distance from the initial charge cloud compared to the neighboring collecting electrode. Detailed simulation setup can be found from [18].
Fig. 3.
Fig. 3.
Different orders of pulse pileup. The pulse width is obtained from the shaped pulse by choosing a threshold. Pileup occurs when the time interval (Δt) between pulses of the first and the following photon is shorter than the pulse width (w1) of the first photon. Note that the pulse width of the bipolar pulse should take into account the undershoot part.
Fig. 4.
Fig. 4.
Accumulated shaped pulse and the corresponding transient currents. Three transient currents are shown in blue, and the corresponding three shaped pulses are in red with 3 peaks (1, 2, and 3). A threshold is set above which the highest peak value is registered as the pulse height.
Fig. 5.
Fig. 5.
Transient currents (left column) and the corresponding shaped pulses (right column) collected on the major electrode when placing the initial charge cloud at different locations: as an example, x12.5y50 indicates the charge cloud initiated at (x, y) = (12.5, 50) μm. The arbitrary units are scaled so that 1.2 a.u. corresponds to 20 keV.
Fig. 6.
Fig. 6.
Energy collected on the major electrode when placing the initial charge cloud at different locations. The collected charge is sensitive to lateral locations when the cloud is placed in the middle region that extends from 7.5 to 17.5 μm.
Fig. 7.
Fig. 7.
Energy deposited vs. pulse height under different time constants. The pulse height is obtained by passing the transient current through a CR-RC2 shaping circuit. The energy is obtained by integrating the transient current.
Fig. 8.
Fig. 8.
(a) Pulse widths of the shaped pulses when the charge cloud is initiated at different locations. (b) Pulse width histogram by taking into account the interaction probability along the depth in the detector.
Fig. 9.
Fig. 9.
(a) The probability of different orders of pulse pileup for paralyzable and varied pulse shape models. P(0) is the fraction free of pileup, P(1), P(2) and P(3) are the first, second, and third orders of pileup, respectively. (b) Count rate performance for paralyzable and varied pulse shape models. (c) Fraction free of pileup under different photon fluxes. To obtain good statistics, 1 million incident photons are simulated. The simulated detector has a thickness of 300 μm, pitch of 25 μm, strip length of 1 cm, and bias voltage of 50 V.
Fig. 10.
Fig. 10.
Accumulated pulse height signal under different photon incident fluxes. High flux results in high ratio of pileup. The simulated detector is 300 μm thick with pitch of 25 μm.
Fig. 11.
Fig. 11.
Energy histograms under different photon incident fluxes. The energy bin is 1 keV and 40 bins are used. The simulated detector has a thickness of 300 μm, pitch of 25 μm, strip length of 1 cm, and is biased at 50 V.
Fig. 12.
Fig. 12.
Waveforms of the pure signal (green dash), electronic noise (blue dot) and signal plus noise (red). Due to noise, both pulse width and pulse height are changed.

References

    1. Hsieh SS, and Pelc NJ, “Improving pulse detection in multibin photon-counting detectors. Journal of Medical Imaging,” J. Med. Imag, vol. 3, no. 2, pp. 023505-1–023505-7, 2016. - PMC - PubMed
    1. Cammin J, Kappler S, Weidinger T, and Taguchi K, “Evaluation of models of spectral distortions in photon-counting detectors for computed tomography,” J. Med. Imag, vol. 3, no. 2, pp.023503-1–023503-12, 2016 - PMC - PubMed
    1. Taguchi K, “Energy-sensitive photon counting detector-based X-ray computed tomography,” Radiol. Phys. and Technol, Vol. 10, no. 1, p. 8–22, 2017. - PubMed
    1. Taguchi K, Frey EC, Wang X, Iwanczyk JS, and Barber WC, “An analytical model of the effects of pulse pileup on the energy spectrum recorded by energy resolved photon counting x-ray detectors,” Med. Phys, 2010. vol. 37, no.8, pp. 3957–3969, 2010. - PMC - PubMed
    1. Persson M, Bujia R, Nowik P, Andersson H, Kull L, Andersson J et al., “Upper limits of the photon fluence rate on CT detectors: Case study on a commercial scanner,” Med. Phys, vol. 43, no. 7, pp. 4398–4411, 2016. - PubMed

LinkOut - more resources