. 2019 Jul 2:10:1511.
doi: 10.3389/fimmu.2019.01511. eCollection 2019.

Melatonin Attenuates LPS-Induced Acute Depressive-Like Behaviors and Microglial NLRP3 Inflammasome Activation Through the SIRT1/Nrf2 Pathway

Affiliations

Melatonin Attenuates LPS-Induced Acute Depressive-Like Behaviors and Microglial NLRP3 Inflammasome Activation Through the SIRT1/Nrf2 Pathway

Burak I Arioz et al. Front Immunol. .

Abstract

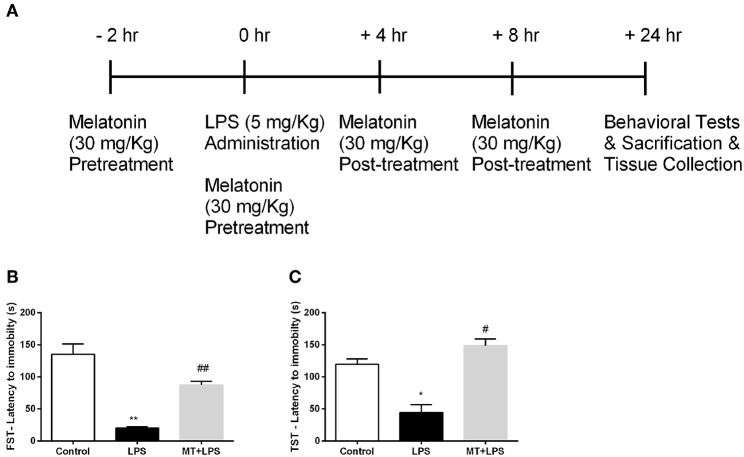
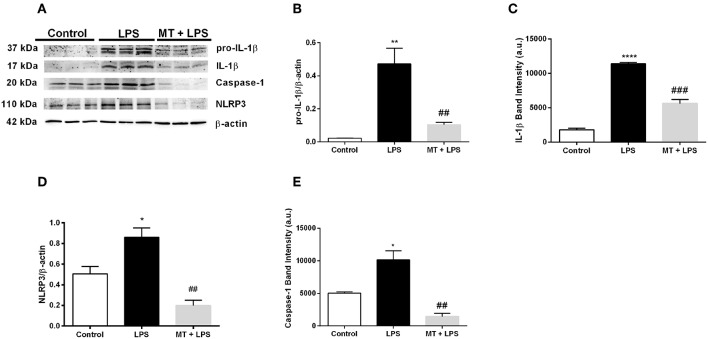
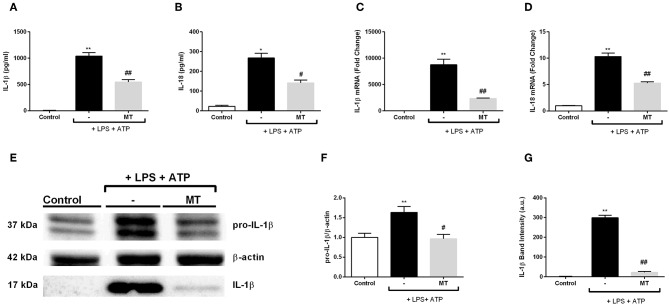
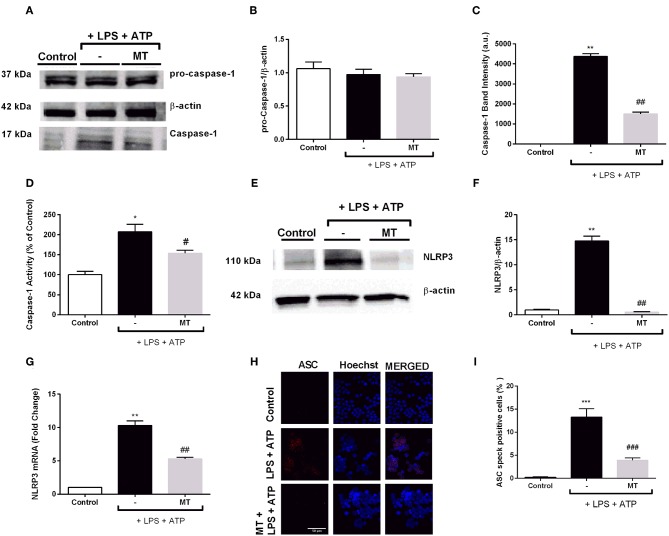
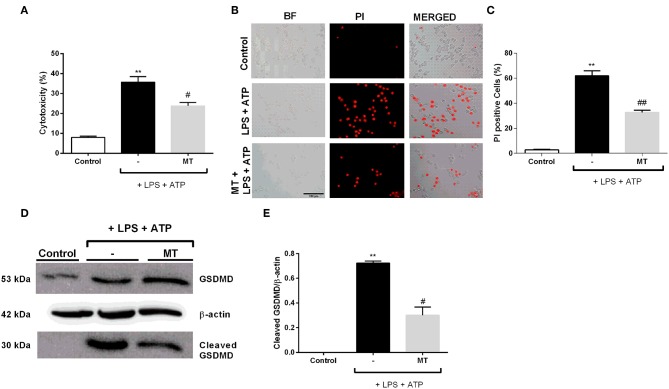
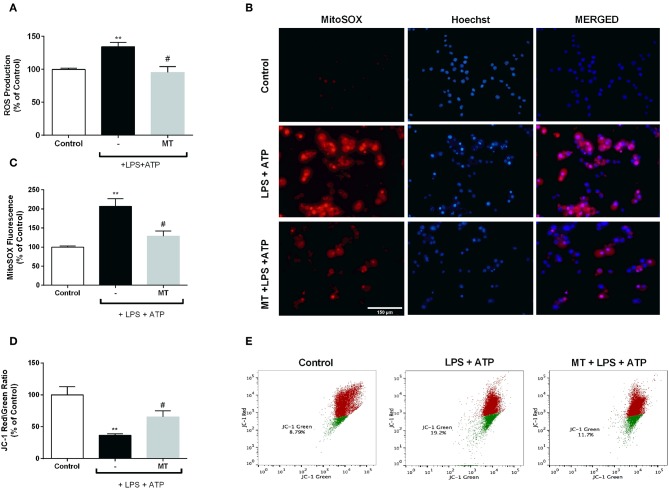
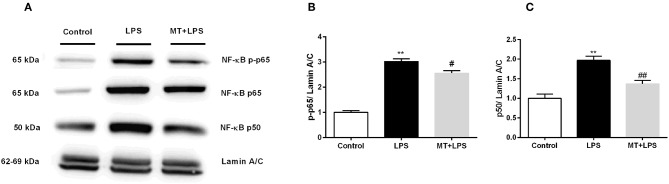
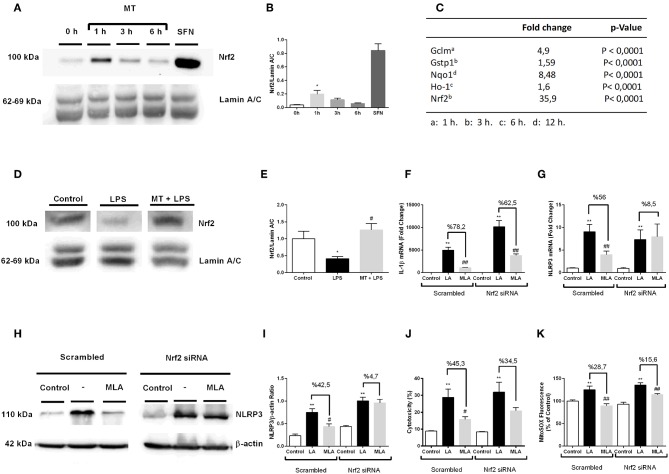
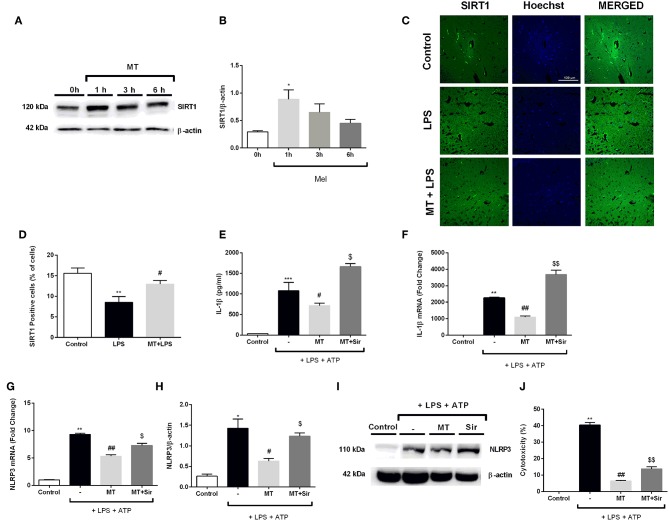
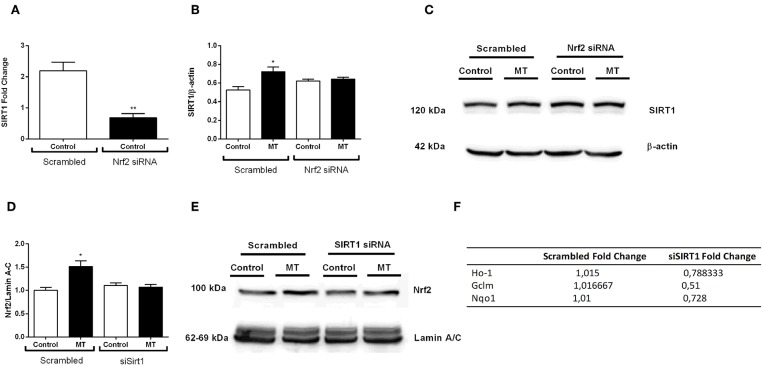
Inflammation is a crucial component of various stress-induced responses that contributes to the pathogenesis of major depressive disorder (MDD). Depressive-like behavior (DLB) is characterized by decreased mobility and depressive behavior that occurs in systemic infection induced by Lipopolysaccharide (LPS) in experimental animals and is considered as a model of exacerbation of MDD. We assessed the effects of melatonin on behavioral changes and inflammatory cytokine expression in hippocampus of mice in LPS-induced DLB, as well as its effects on NLR Family Pyrin Domain Containing 3 (NLRP3) inflammasome activation, oxidative stress and pyroptotic cell death in murine microglia in vitro. Intraperitoneal 5 mg/kg dose of LPS was used to mimic depressive-like behaviors and melatonin was given at a dose of 500 mg/kg for 4 times with 6 h intervals, starting at 2 h before LPS administration. Behavioral assessment was carried out at 24 h post-LPS injection by tail suspension and forced swimming tests. Additionally, hippocampal cytokine and NLRP3 protein levels were estimated. Melatonin increased mobility time of LPS-induced DLB mice and suppressed NLRP3 expression and interleukin-1β (IL-1β) cleavage in the hippocampus. Immunofluorescence staining of hippocampal tissue showed that NLRP3 is mainly expressed in ionized calcium-binding adapter molecule 1 (Iba1) -positive microglia. Our results show that melatonin prevents LPS and Adenosine triphosphate (ATP) induced NLRP3 inflammasome activation in murine microglia in vitro, evidenced by inhibition of NLRP3 expression, Apoptosis-associated speck-like protein containing a CARD (ASC) speck formation, caspase-1 cleavage and interleukin-1β (IL-1β) maturation and secretion. Additionally, melatonin inhibits pyroptosis, production of mitochondrial and cytosolic reactive oxygen species (ROS) and nuclear factor kappa-light-chain-enhancer of activated B cells (NF-κB) signaling. The beneficial effects of melatonin on NLRP3 inflammasome activation were associated with nuclear factor erythroid 2-related factor 2 (Nrf2) and Silent information regulator 2 homolog 1 (SIRT1) activation, which were reversed by Nrf2 siRNA and SIRT1 inhibitor treatment.

Keywords: NLRP3 inflammasome; Nrf2; SIRT1; depressive-like behaviors; lipopolysaccharide; melatonin; microglia.


Figures

Figure 1
Figure 1
Melatonin treatment ameliorated LPS-induced DLB. (A) Schematic representation of experimental design for the LPS-induced inflammasome model. (B) Melatonin restored DLB in LPS treated mice in FST, (C) Melatonin treated mice also exert less DLB in TST. Data are presented as mean ± S.E.M, n = 5. *p < 0.05 and **p < 0.01 compared to control group and #p < 0.05 and ##p < 0.01 compared to LPS-induced mice.
Figure 2
Figure 2
Treatment with melatonin decreased the expression of NLRP3 inflammasome markers in mice hippocampus. (A–C) Melatonin treatment decreased both pro-IL-1β and IL-1β levels induced by LPS treatment. (A,D) Melatonin suppressed NLRP3 protein levels. (A,E) Treatment with melatonin lowered the cleaved caspase-1 levels compared with LPS treated mice. Data are presented as mean ± S.E.M, n = 5. *p < 0.05, **p < 0.01 and ****p < 0.0001 compared to control group and ##p < 0.01 and ###p < 0.001 compared to LPS-induced mice.
Figure 3
Figure 3
Melatonin treatment inhibited microglial activation and expression of NLRP3. Hippocampal sections were stained with Iba1 as the microglia marker (green) and NLRP3 (red). Nuclei were stained with Hoechst (blue). (A) Hippocampal sections were double stained for Iba1 and NLRP3 to localize and assess microglial activation and NLRP3 protein levels. (B) Melatonin significantly decreased NLRP3 intensity. (C) Increased Iba1 intensity by LPS induction was lowered with melatonin treatment. (D) Decreased Iba1-NLRP3 co-localization in melatonin treated mice. (E) Number of activated microglia ameliorated by melatonin treatment. Data are presented as mean ± S.E.M, n = 5. *p < 0.05, ***p < 0.001 and ****p < 0.0001 compared to control group and #p < 0.05 and ###p < 0.001 compared to LPS-induced mice.
Figure 4
Figure 4
Melatonin reduced mRNA and protein levels of IL-1β and IL-18. N9 microglial cells were pretreated with melatonin (500 μM) for 1 h, then treated with LPS (1 μg) for 4 h and ATP (5 mM) for 1 h. (A,B) Suppressor effect of melatonin on secreted IL-1β and IL-18 was measured with ELISA. (C,D) mRNA levels of IL-1β and IL-18 reduced by melatonin pretreatment compared with that in LPS and ATP induced cells. (E–G) Protein levels of pro-IL-1β and secreted IL-1β were reduced by melatonin compared to LPS and ATP induced cells. Data are presented as mean ± S.E.M, n = 5. *p < 0.05, **p < 0.01 compared to control and #p < 0.05, ##p < 0.01 compared to LPS and ATP induced cells.
Figure 5
Figure 5
Melatonin reduced NLRP3, caspase-1 and ASC speck formation. N9 microglial cells were pretreated with melatonin (500 μM) for 1 h, then treated with LPS (1 μg) for 4 h and ATP (5 mM) for 1 h. (A,B) Pro-caspase-1 show no difference among groups. (A,C) Melatonin reduced cleaved caspase-1 in melatonin pretreated cells compared with that in LPS and ATP induced cells. (D) Melatonin pretreatment decreased caspase-1 activity compared to LPS and ATP induced cells. (E–G) Melatonin suppressed NLRP3 on both protein and mRNA level compared with in that LPS and ATP induced cells. (H) ASC speck formation was determined by confocal microscopy. (I) Melatonin significantly prevented ASC speck formation compared to LPS and ATP induced cells. Data are presented as mean ± S.E.M, n = 5. *p < 0.05, **p < 0.01 and ***p < 0.001 compared to control and #p < 0.05, ##p < 0.01 and ###p < 0.001 compared to LPS and ATP induced cells.
Figure 6
Figure 6
Melatonin prevented pyroptotic cell death. N9 microglial cells were pretreated with melatonin (500 μM) for 1 h, then treated with LPS (1 μg) for 4 h and ATP (5 mM) for 1 h. (A) Pretreatment with melatonin inhibited pyroptotic cell death. (B,C) Melatonin reduced pyroptotic cell death and decreased PI positive cells. (D,E) Melatonin ameliorated GSDMD cleavage induced by inflammasome activation. All the data are presented as mean ± S.E.M, n = 5. **p < 0.01 compared to control and #p < 0.05 and ##p < 0.01 compared to LPS and ATP induced cells.
Figure 7
Figure 7
Melatonin inhibited intracellular and mitochondrial ROS production and restored mitochondrial membrane potential. N9 microglial cells were pretreated with melatonin (500 μM) for 1 h, then treated with LPS (1 μg) for 4 h and ATP (5 mM) for 1 h. (A) Melatonin pretreatment reduced intracellular ROS production. (B,C) Melatonin also decreased mitochondrial ROS production in melatonin pretreated cells compared with LPS and ATP induced cells. (D,E) Melatonin pretreatment restored mitochondrial membrane potential. Data are presented as mean ± S.E.M, n = 5. **p < 0.01 compared to control and #p < 0.05 compared to LPS and ATP induced cells.
Figure 8
Figure 8
Melatonin inhibited activation of NF-κB. N9 microglial cells were pretreated with melatonin (500 μM) for 1 h, then treated with LPS (1 μg) for 30 min. (A,B) Melatonin pretreatment reduced phosphorylation of p65 subunit of NF-κB. (A,C) Melatonin pretreatment significantly reduced p50 subunit of NF-κB. Data are presented as mean ± S.E.M, n = 5. **p < 0.01 compared to control and #p < 0.05 and ##p < 0.01 compared to LPS-induced cells.
Figure 9
Figure 9
Nrf2 transcription factor is translocated to nucleus by melatonin and involved in protection against NLRP3 inflammasome activation. N9 microglial cells were treated with melatonin (500 μM) for 0–6 h. (A,B) Melatonin induced translocation of Nrf2 transcription factor to nucleus. Sulforaphane was used as positive control. (C) Nrf2 target genes were upregulated with melatonin treatment. (D,E) Melatonin increased translocation of Nrf2 in hippocampus. siRNA-mediated Nrf2 knockdown reversed the protective effect of melatonin against (F) Il-1β mRNA level, (G) NLRP3 mRNA level, (H,I) NLRP3 protein level, (J) pyroptotic cell death, (K) mitochondrial ROS production. Data are presented as mean ± S.E.M, n = 5. *p < 0.05 and **p < 0.01 compared to control, #p < 0.05, ##p < 0.01, compared to LPS and ATP induced cells.
Figure 10
Figure 10
Inhibition of SIRT1 activation by sirtinol reversed melatonin effects on NLRP3 inflammasome activation. N9 microglial cells were treated with melatonin (500 μM) for 0–6h. (A,B) Melatonin significantly increased SIRT1 expression. (C,D) SIRT1 immunofluorescence staining showed that melatonin increased SIRT1 positive cells in hippocampus (E,F) Inhibition of SIRT1 reversed the melatonin's effect on IL-1β mRNA and protein production. (G) Sirtinol also increased mRNA levels of NLRP3. (H,I) Pretreatment with sirtinol promoted the production of NLRP3 (J) melatonin's protective effects against pyroptotic cell death were reversed with inhibition of SIRT1. Data are presented as mean ± S.E.M, n = 5. *p < 0.05, **p < 0.01 ***p < 0.001 and compared to control, #p < 0.05 and ##p < 0.01 compared to LPS and ATP induced cells and $p < 0.05 and $$p < 0.01 compared to melatonin pretreated cells.
Figure 11
Figure 11
Nrf2 and SIRT1 pathways are co-modulate melatonin effects. N9 microglial cells were treated with melatonin (500 μM) for 1 h. (A) siRNA-mediated Nrf2 knockdown significantly decreased SIRT1 expression N9 microglial cells. (B,C) Inhibition of Nrf2 reversed the melatonin's effect on SIRT1 protein expression. (D,E) siRNA-mediated SIRT1 knockdown significantly decreased Nrf2 translocation. (F) Inhibition of SIRT1 significantly downregulated Nrf2 target genes expression. Data are presented as mean ± S.E.M, n = 5. *p < 0.05, **p < 0.01 compared to control.

References

    1. Malhi GS, Mann JJ. Depression. Lancet. (2018) 392:2299–312. 10.1016/S0140-6736(18)31948-2 - DOI - PubMed
    1. Lim GY, Tam WW, Lu Y, Ho CS, Zhang MW, Ho RC. Prevalence of depression in the community from 30 countries between 1994 and 2014. Sci Rep. (2018) 8:2861. 10.1038/s41598-018-21243-x - DOI - PMC - PubMed
    1. Johnston KM, Powell LC, Anderson IM, Szabo S, Cline S. The burden of treatment-resistant depression: a systematic review of the economic and quality of life literature. J Affect Disord. (2019) 242:195–210. 10.1016/j.jad.2018.06.045 - DOI - PubMed
    1. Czarny P, Wigner P, Galecki P, Sliwinski T. The interplay between inflammation, oxidative stress, DNA damage, DNA repair and mitochondrial dysfunction in depression. Prog Neuropsychopharmacol Biol Psychiatry. (2018) 80:309–21. 10.1016/j.pnpbp.2017.06.036 - DOI - PubMed
    1. Thase ME. Managing medical comorbidities in patients with depression to improve prognosis. J Clin Psychiatry. (2016) 77(Suppl 1):22–7. 10.4088/JCP.14077su1c.04 - DOI - PubMed

Publication types

MeSH terms