

An autocrine ActivinB mechanism drives TGFβ/Activin signaling in Group 3 medulloblastoma
- PMID: 31328883
- PMCID: PMC6685082
- DOI: 10.15252/emmm.201809830
An autocrine ActivinB mechanism drives TGFβ/Activin signaling in Group 3 medulloblastoma
Abstract
Medulloblastoma (MB) is a pediatric tumor of the cerebellum divided into four groups. Group 3 is of bad prognosis and remains poorly characterized. While the current treatment involving surgery, radiotherapy, and chemotherapy often fails, no alternative therapy is yet available. Few recurrent genomic alterations that can be therapeutically targeted have been identified. Amplifications of receptors of the TGFβ/Activin pathway occur at very low frequency in Group 3 MB. However, neither their functional relevance nor activation of the downstream signaling pathway has been studied. We showed that this pathway is activated in Group 3 MB with some samples showing a very strong activation. Beside genetic alterations, we demonstrated that an ActivinB autocrine stimulation is responsible for pathway activation in a subset of Group 3 MB characterized by high PMEPA1 levels. Importantly, Galunisertib, a kinase inhibitor of the cognate receptors currently tested in clinical trials for Glioblastoma patients, showed efficacy on orthotopically grafted MB-PDX. Our data demonstrate that the TGFβ/Activin pathway is active in a subset of Group 3 MB and can be therapeutically targeted.
Keywords: Smad2; Smad3; TGFbeta; activin; medulloblastoma.
© 2019 The Authors. Published under the terms of the CC BY 4.0 license.
Conflict of interest statement
The authors declare that they have no conflict of interest.
Figures
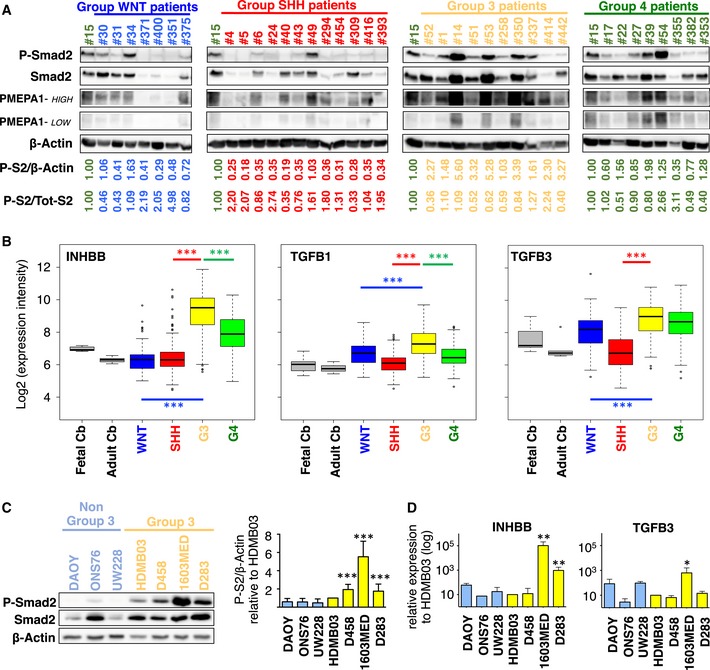
- A
Immunoblot analysis of phosphorylated Smad2 (P‐Smad2) and PMEPA1 (high and low exposures displayed) in MB patient sample lysates from different groups: WNT (blue), SHH (red), Group 3 (yellow), or Group 4 (green). β‐Actin was used as a loading control. Relative quantification of P‐Smad2 signal to β‐actin (P‐S2/β‐Actin) and total Smad2 (P‐S2/Tot‐S2) are indicated below the blots.
- B
Boxplots summarizing the expression of INHBB, TGFB1, and TGFB3 ligands of the TGFβ/Activin pathway in the different groups of MB (blue WNT, red SHH, yellow Group 3, and green Group 4) and in fetal and adult cerebellum (gray) in the dataset of Cavalli et al (Data ref: Cavalli et al, 2017b).
- C
Immunoblot analysis of phosphorylated Smad2 (P‐Smad2) in non‐Group 3 (blue) and Group 3 (yellow) MB cell lines on the left panel. The level of total Smad2 (Smad2) was assessed, and β‐actin was used as a loading control. On the right panel, relative level of P‐Smad2 (P‐S2) was quantified to total β‐actin. P‐Smad2 to total Smad normalization is also provided on Appendix Fig S5.
- D
RT–qPCR was performed on RNA extracted from non‐Group 3 (blue) and Group 3 (yellow) MB cell lines to compare expression levels of INHBB (left) and TGFB3 (right).
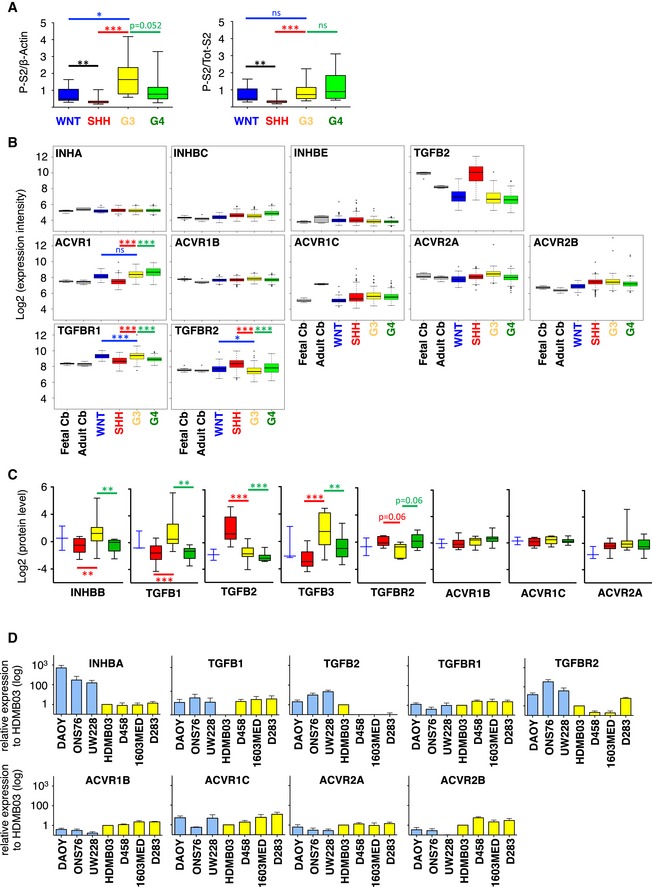
- A
Boxplots represent the quantification of P‐Smad2 normalized to β‐actin levels on the left and total Smad2 on the right.
- B
Boxplots summarizing the expression of major actors of the TGFβ/Activin pathway in the different groups of MB (blue WNT, red SHH, yellow Group 3, and green Group 4) in the dataset from Cavalli et al (Data ref: Cavalli et al, 2017b).
- C
Boxplots summarizing the protein level of major actors of the TGFβ/Activin pathway detected by mass spectrometry in the different groups of MB (blue WNT, red SHH, yellow Group 3, and green Group 4) in the dataset from Archer et al (Data ref: Archer et al, 2018b).
- D
RT–qPCR was performed on RNA extracted from non‐Group 3 (blue) and Group 3 (yellow) MB cell lines to compare expression levels of INHBA, TGFB1, TGFB2, TGFBR1, TGFBR2, ACVR1B, ACVR1C, ACVR2A, and ACVR2B. The expression level relative to that of found in HDMB03 is presented.
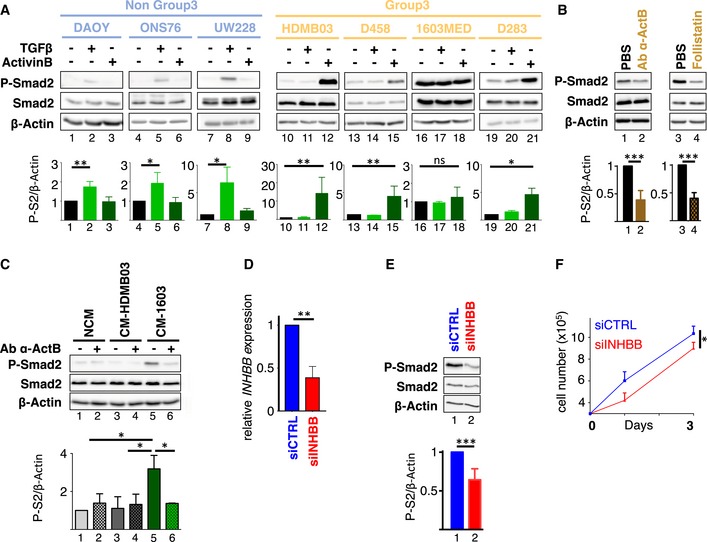
- A–C
The level of phosphorylated Smad2 (P‐Smad2) and total Smad2 (Smad2) was assessed by immunoblotting, and β‐actin was used as a loading control. Lower bar graphs show WB quantification of P‐Smad2 (P‐S2) normalized to β‐actin. (A) Activation of the pathway was assessed in non‐Group 3 (blue) and Group 3 (yellow) MB cell lines in response to TGFβ or ActivinB stimulation for 1 h. (B) 1603MED cells were treated with PBS (vehicle) or a blocking antibody targeting ActivinB (Ab α‐ActB) or follistatin. (C) Conditioned media experiments were performed on the HDMB03 MB cell line. Phosphorylation of Smad2 was analyzed by immunoblot upon treatment with either non‐conditioned media (NCM), media conditioned with HDMB03 cells (CM‐HDMB03), or media conditioned with 1603MED cells (CM‐1603). Pre‐incubation with blocking antibody against ActivinB (Ab α‐ActB) or vehicle (PBS) was performed before HDMB03 cell‐line treatment as indicated. Relative level of P‐Smad2 (P‐S2) was quantified to β‐actin (below).
- D
RT–qPCR was performed on total RNA extracted from 1603MED cells 48 h after transfection with siRNA targeting INHBB. Relative INHBB expression was assessed. siCTRL condition was set at 1.
- E
1603MED cells were transfected with the indicated control siRNA (siCTRL, blue) or targeting INHBB (siINHBB, red). Lysates were prepared 48 h after transfection. The level of phosphorylated Smad2 (P‐Smad2) and total Smad2 (Smad2) was assessed by immunoblotting, and β‐actin was used as a loading control. Lower bar graphs represent the quantification of the relative level of P‐Smad2 (P‐S2) to β‐actin.
- F
Growth curve of 1603MED cells after transfection with either siCTRL (blue) or siINHBB (red).
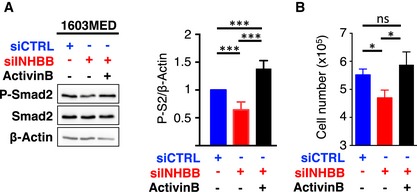
- A, B
The level of phosphorylated Smad2 (P‐Smad2) and total Smad2 (Smad2) was assessed by immunoblot, and β‐actin was used as a loading control in 1603MED cells transfected with the indicated control siRNA (siCTRL) or targeting INHBB (siINHBB). Rescue experiment was performed by adding exogenous ActivinB. Lysates were prepared 48 h after transfection. Right panel represents relative quantifications of the P‐S2/β‐actin ratio. Note that P‐Smad2/β‐actin quantification is identical to that of in Fig 2D. P‐Smad2 to total Smad normalization is provided on Appendix Fig S5. (B) Number of viable 1603MED cells 2 days after transfection with either siCTRL (blue) or siINHBB (red). Rescue was assessed upon ActivinB stimulation (black). The P‐values were determined by unpaired t‐test. *P < 0.05, ***P < 0.001. Bars represent the mean ± SD. Number of replicates is n ≥ 3. The exact P‐values and number of replicates are indicated in Appendix Table S5.
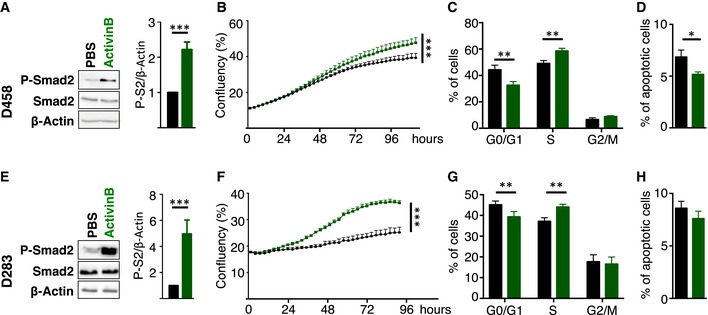
- A–H
D458 (A–D) or D283 (E–H) cell lines were treated with PBS (vehicle, black) or with ActivinB (green). (A and E) Immunoblot of phosphorylated Smad2 (P‐Smad2), total Smad2, and β‐actin in response to ActivinB stimulation for 24 h. Quantification of P‐Smad2 (P‐S2) to β‐actin is shown on right panels. (B and F) P‐Smad2 to total Smad normalization is provided on Appendix Fig S5. Growth curve experiments showing cell proliferation upon ActivinB treatment. (C and G) Cell cycle analysis by FACS measuring BrdU incorporation and 7AAD labeling at 48 h upon ActivinB stimulation. The percentage of cells in the different phases of the cell cycle is represented (G0/G1, S, and G2/M phases). (D and H) Percentage of apoptotic cells measured by FACS analysis of cleaved caspase‐3 48 h after treatment with ActivinB. The P‐values were determined by unpaired t‐test and two‐way ANOVA for (B and F). *P < 0.05, **P < 0.01, ***P < 0.001. Bars represent the mean ± SD. Number of replicates is n ≥ 3. The exact P‐values and number of replicates are indicated in Appendix Table S5.

- A–H
1603MED (A‐D) or D283 (E‐H) cells were treated with DMSO (vehicle, black), with LY364947 (red), or with SB431542 (orange). (A and E) Immunoblot of phosphorylated Smad2 (P‐Smad2), total Smad2, and β‐actin upon inhibition of TGFβ/Activin signaling using LY364947 and SB431542 inhibitors for 24 h. Bar graphs on the right panel represent the quantification of the relative level of P‐Smad2 (P‐S2) to β‐actin. (B and F) P‐Smad2 to total Smad normalization is provided on Appendix Fig S5. Growth curve experiments showing cell proliferation upon TGFβ/Activin signaling inhibition. (C and G) Cell cycle analysis by FACS measuring BrdU incorporation and 7AAD labeling at 48 h upon inhibition. The percentage of cells in the different phases of the cell cycle is represented (G0/G1, S, and G2/M phases). (D and H) Percentage of apoptotic cells measured by FACS analysis of cleaved caspase‐3 48 h after TGFβ/Activin signaling inhibition. The P‐values were determined by unpaired t‐test and two‐way ANOVA for (B and F). *P < 0.05, **P < 0.01, ***P < 0.001. Bars represent the mean ± SD. Number of replicates is n ≥ 3. The exact P‐values and number of replicates are indicated in Appendix Table S5.
- A
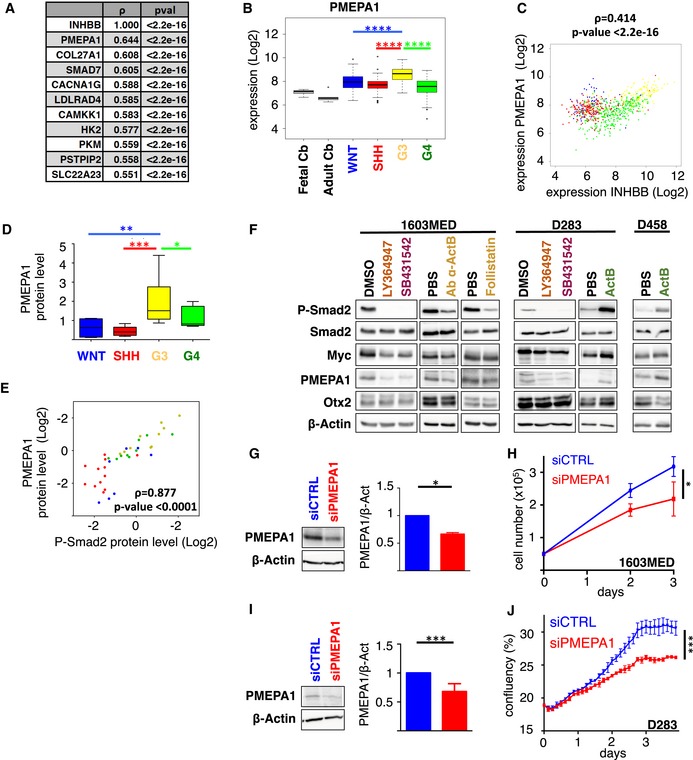
Ranking of top genes whose expression is correlated with INHBB in Group 3 MB patient samples. Spearman's rank correlation coefficient ρ and P‐value are indicated.
- B
Boxplots representing PMEPA1 expression levels in the different MB groups (WNT in blue, SHH in red, Group 3 in yellow, and Group 4 in green) and in fetal and adult cerebellum (gray) in the dataset of Cavalli et al (Data ref: Cavalli et al, 2017b). Only P‐values corresponding to comparisons between Group 3 and the other groups are indicated. Full statistics can be found in Appendix Table S1.
- C
Scatter plot of INHBB and PMEPA1 gene expression levels in all MB groups. Colored dots represent each patient samples, and colors represent the MB groups (WNT in blue, SHH in red, Group 3 in yellow, and Group 4 in green).
- D
Boxplot represents the quantification of PMEPA1 protein level normalized to β‐actin levels across groups.
- E
Scatter plot represents log2 relative protein level of P‐Smad2 (x‐axis) and PMEPA1 (Y‐axis) normalized to β‐actin in each individual samples.
- F
Immunoblots of phosphorylated Smad2 (P‐Smad2), total Smad2, MYC, PMEPA1, OTX2, and β‐actin were performed on extracts from 1603MED or D283 or D458 cells treated with either DMSO (vehicle), LY364947, SB431542, blocking antibody against ActivinB (Ab α‐ActB), follistatin, PBS, or ActivinB (ActB) for 24 h. Blot quantification to β‐actin is presented in Appendix Fig S3D.
- G
Immunoblot analysis of PMEPA1 levels in 1603MED cells 48 h after transfection with either siCTRL (blue) or siPMEPA1 (red). Bar graphs on the right represent the quantification of the relative level of PMEPA1 protein level normalized to β‐actin. P‐Smad2 to total Smad normalization is provided on Appendix Fig S5.
- H
Growth curves of 1603MED cells after transfection with either siCTRL (blue) or siPMEPA1 (red).
- I
Immunoblot analysis of PMEPA1 levels in D283 cells 48 h after transfection with either siCTRL (blue) or siPMEPA1 (red). Bar graphs on the right represent the quantification of the relative level of PMEPA1 protein level normalized to β‐actin. P‐Smad2 to total Smad normalization is provided on Appendix Fig S5.
- J
Growth curves of D283 cells after transfection with either siCTRL (blue) or siPMEPA1 (red).
- A
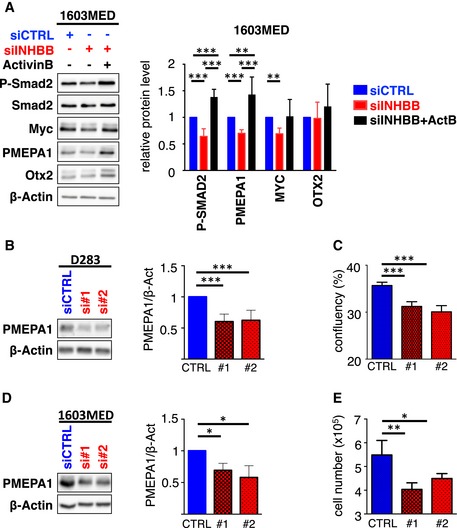
Immunoblots of phosphorylated Smad2 (P‐Smad2), total Smad2, MYC, PMEPA1, OTX2, and β‐actin were performed on cell extracts from 1603MED transfected with control siRNA control (siCTRL, blue) or targeting INHBB (siINHBB, red). 1603MED cells transfected with siINHBB were also treated with ActivinB to investigate a potential rescue (black). Lysates were prepared 48 h after transfection. Right panel represents WB quantification. The relative level to β‐actin is presented for the different proteins. Note that P‐Smad2/β‐actin quantification is identical to that of in Figs 2D and EV2A. The level in control conditions (siCTRL) was set at 1.
- B–E
D283 (B and C) and 1603MED (D and E) cell lines were transfected with siCTRL (blue) or individual siRNAs targeting PMEPA1 (siPMEPA1#1 or siPMEPA1#2 red). D283 (B) and 1603MED (D) lysates were prepared 48 h after transfection. Right panel represents WB quantifications performed as above. (C and E) Viable D283 (C) and 1603MED (E) cells measured 2 days after transfection with either siCTRL (blue) or siPMEPA1#1 and #2 (red).
- A
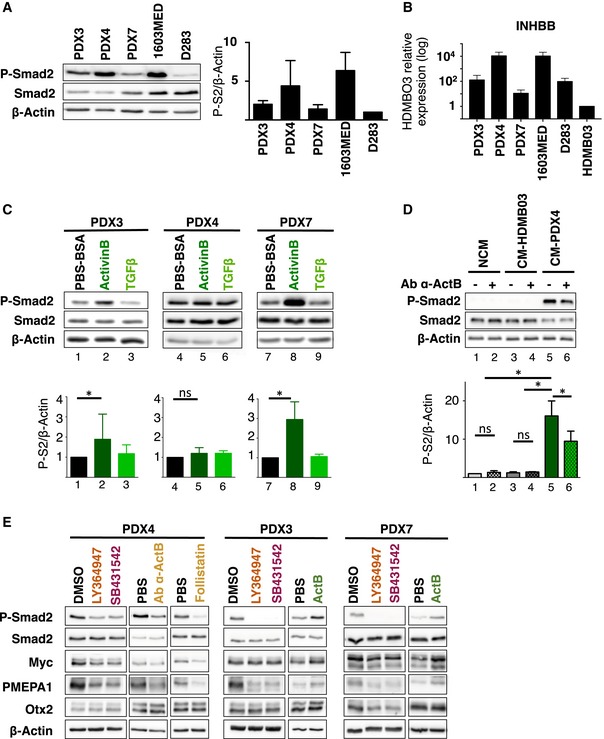
Immunoblot analysis of phosphorylated Smad2 (P‐Smad2) in Group 3 MB cell lines and PDXs. The level of total Smad2 (Smad2) was assessed, and β‐actin was used as a loading control. Quantification of P‐Smad2 (P‐S2) to β‐actin is shown on right panel.
- B
Expression of INHBB in Group 3 MB cell lines and PDXs relative to HDMB03 (set at 1) by RT–qPCR.
- C
Immunoblot of phosphorylated Smad2 (P‐Smad2), total Smad2, and β‐actin upon ActivinB or TGFβ stimulation for 1 h. Quantification of P‐Smad2 (P‐S2) to β‐actin is shown below.
- D
Conditioned media experiments were performed on HDMB03 MB cell line. Phosphorylation of Smad2 (P‐Smad2) was analyzed by immunoblot upon treatment with either non‐conditioned media (NCM), media conditioned with HDMB03 cells (CM‐HDMB03), or media conditioned on PDX4 cells (CM‐PDX4). Pre‐incubation with blocking antibody against ActivinB (Ab α‐ActB) or with vehicle was performed before HDMB03 cell‐line treatment as indicated. Quantification of P‐Smad2 (P‐S2) to β‐actin is shown below.
- E
Immunoblots of phosphorylated Smad2 (P‐Smad2), total Smad2, MYC, PMEPA1, OTX2, and β‐actin were performed on extracts from cell cultures of PDX4, PDX3, and PDX7 treated with either DMSO (vehicle), LY364947, SB431542, blocking antibody against ActivinB (Ab α‐ActB), follistatin, PBS, or ActivinB for 24 h. WB quantification is depicted in Appendix Fig S4C.
- A
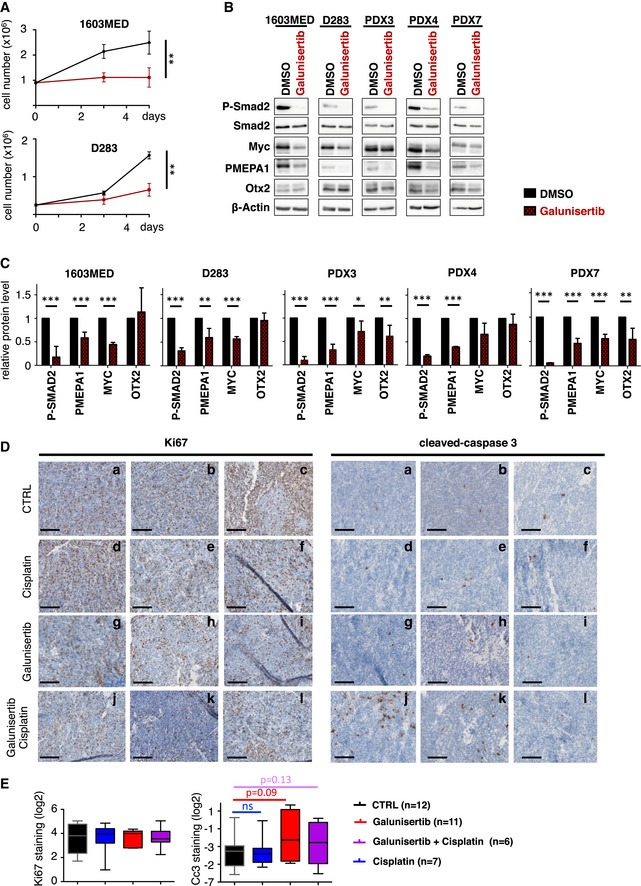
Growth curve experiments showing cell proliferation upon TGFβ/Activin signaling inhibition by Galunisertib (LY2157299) in 1603MED (top panel) and D283 (bottom panel) cell lines.
- B
Immunoblots of phosphorylated Smad2 (P‐Smad2), total Smad2, MYC, PMEPA1, OTX2, and β‐actin were performed on extracts from 1603MED and D283 cell lines and PDX3, PDX4, and PDX7 cell cultures treated with Galunisertib for 24 h.
- C
WB quantifications. The relative level to β‐actin is presented for the different proteins. P‐Smad2 to total Smad normalization is provided on Appendix Fig S5. The level in control conditions was set at 1.
- D
Ki67 and cleaved caspase‐3 staining by IHC of 3 representative tumors per group of mice (Vehicle, Cisplatin, Galunisertib, and Galunisertib + Cisplatin). Scale bars indicate 100 μm.
- E
Boxplots represent quantification of Ki67 and cleaved caspase‐3 (Cc3) staining on tumor (IHC).
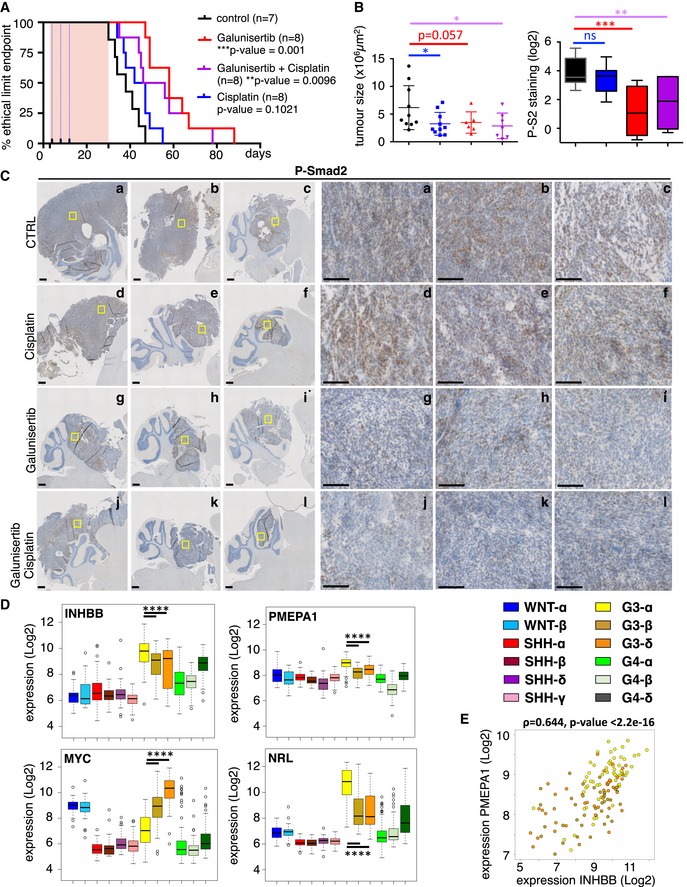
- A
Kaplan–Meier representing survival of mice treated with either vehicle (black) or Galunisertib (LY2157299, red) or Cisplatin (blue) or a combination of Galunisertib and Cisplatin (purple) after orthotopic grafting of PDX4 cells into the cerebellum. The pink rectangle represents Galunisertib treatment duration, while the blue dotted lines represent the 3 Cisplatin administrations.
- B
Boxplot of tumor area after 25 days of treatment. On the right, boxplots represent quantification of P‐Smad2 staining on tumor (IHC). The code color is similar to panel (A).
- C
P‐Smad2 staining by IHC in 3 representative tumors per group after 25 days of treatment. The scale bars represent 500 and 100 μm on the left and right panels, respectively.
- D
Boxplots representing the expression level of INHBB, PMEPA1, MYC, and NRL in the different MB subtypes, as defined in Cavalli et al (2017a). Only P‐values corresponding to comparisons between Group 3 subtypes are indicated. Detailed statistics are presented in Appendix Table S3. Patient samples are colored by subtypes as indicated.
- E
Scatter plot of INHBB and PMEPA1, expression levels in Group 3 patient samples. Colored dots represent each patient sample, and colors represent the group 3 MB subtypes (α in yellow, β in brown, and δ in orange). Note that this panel is identical to that shown in Appendix Fig S3A (yellow) except for the color code.
References
-
- Anido J, Sáez‐Borderías A, Gonzàlez‐Juncà A, Rodón L, Folch G, Carmona MA, Prieto‐Sánchez RM, Barba I, Martínez‐Sáez E, Prudkin L et al (2010) TGF‐β receptor inhibitors target the CD44(high)/Id1(high) glioma‐initiating cell population in human glioblastoma. Cancer Cell 18: 655–668 - PubMed
-
- Antsiferova M, Werner S (2012) The bright and the dark sides of activin in wound healing and cancer. J Cell Sci 125: 3929–3937 - PubMed
-
- Archer TC, Ehrenberger T, Mundt F, Gold MP, Krug K, Mah CK, Mahoney EL, Daniel CJ, LeNail A, Ramamoorthy D et al (2018b). MassIVE: MSV000082644 (https://massive.ucsd.edu/ProteoSAFe/dataset.jsp?accession=MSV000082644) [DATASET]
-
- Brown S, Teo A, Pauklin S, Hannan N, Cho CH‐H, Lim B, Vardy L, Dunn NR, Trotter M, Pedersen R et al (2011) Activin/Nodal signaling controls divergent transcriptional networks in human embryonic stem cells and in endoderm progenitors. Stem Cells 29: 1176–1185 - PubMed
Publication types
MeSH terms
Substances
Associated data
- Actions
Grants and funding
LinkOut - more resources
Full Text Sources
Other Literature Sources
Molecular Biology Databases
Research Materials
Miscellaneous
