. 2019 Jul 22;129(8):3387-3400.
doi: 10.1172/JCI125316.

ATP-binding cassette A1 deficiency causes cardiolipin-driven mitochondrial dysfunction in podocytes

Affiliations

ATP-binding cassette A1 deficiency causes cardiolipin-driven mitochondrial dysfunction in podocytes

G Michelle Ducasa et al. J Clin Invest. .

Abstract

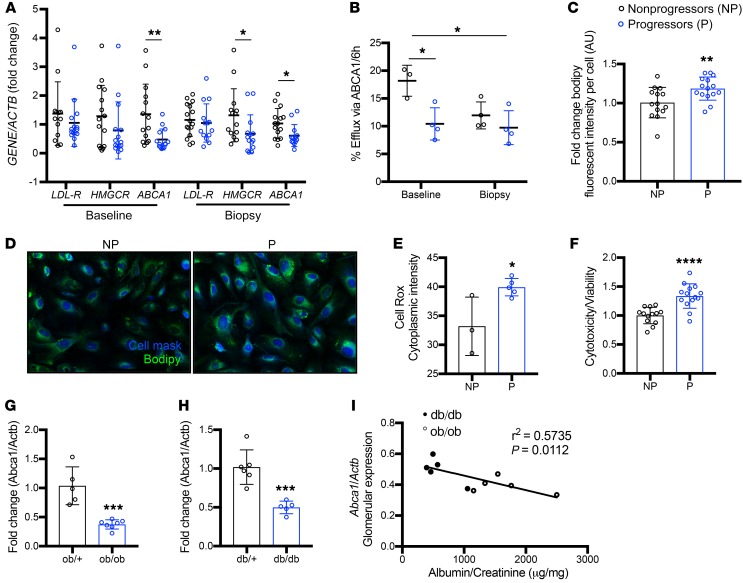
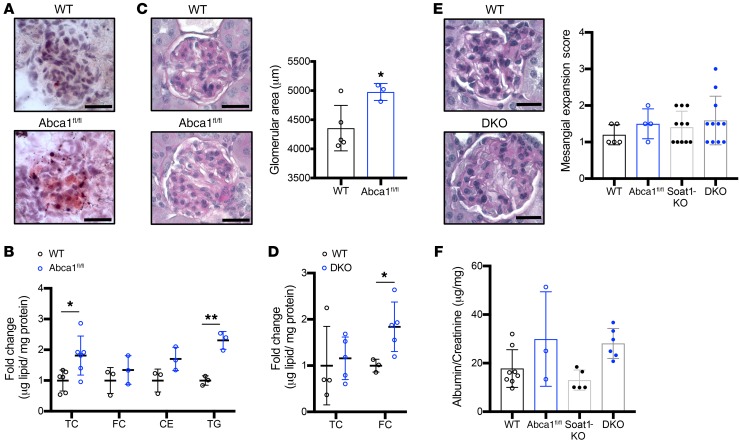
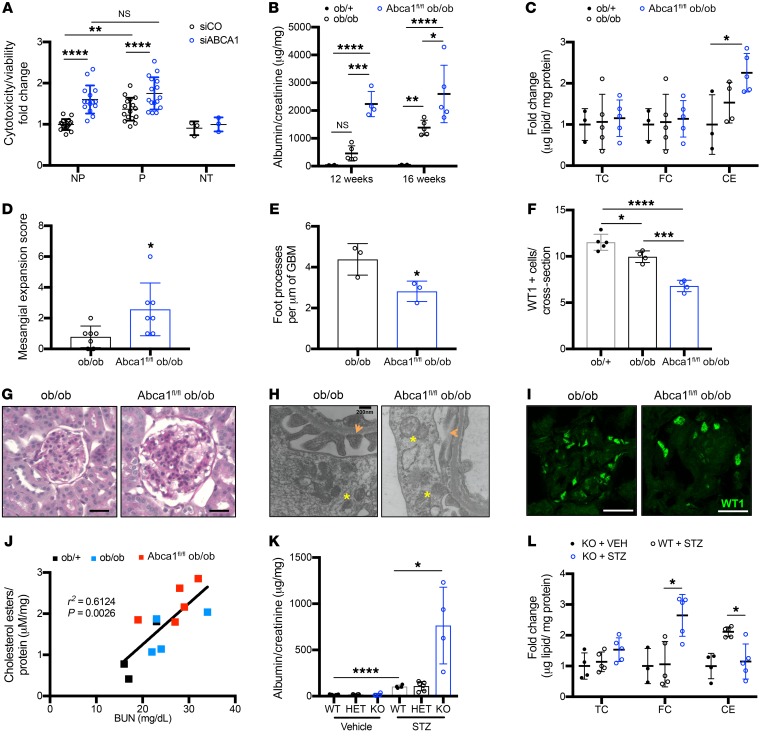
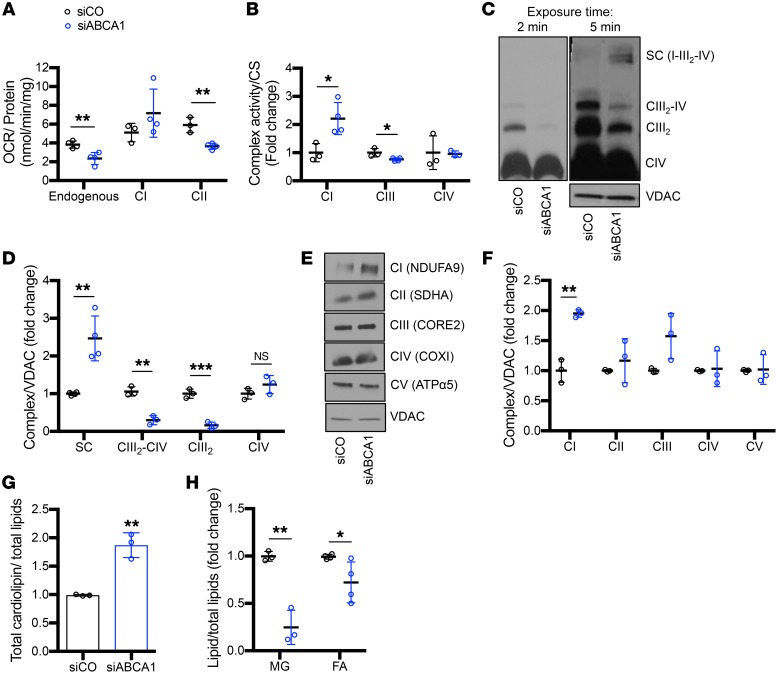
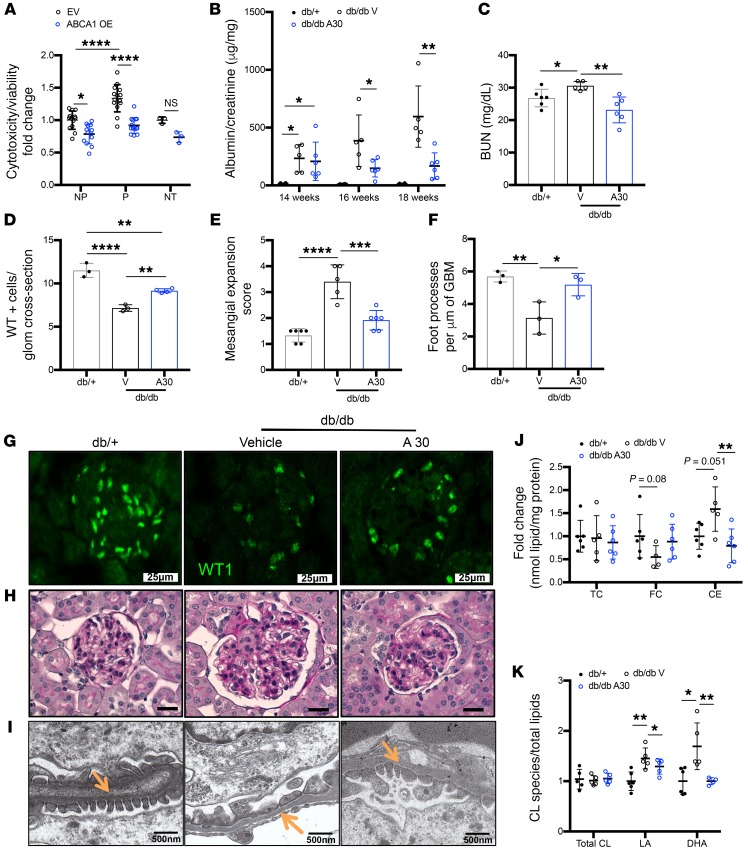
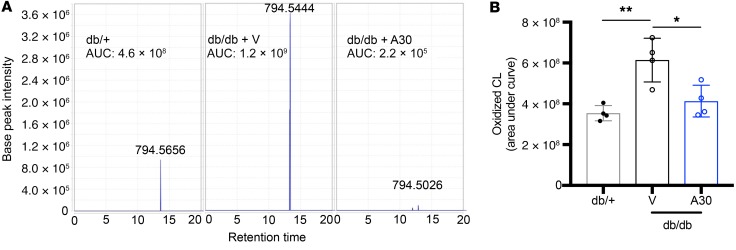
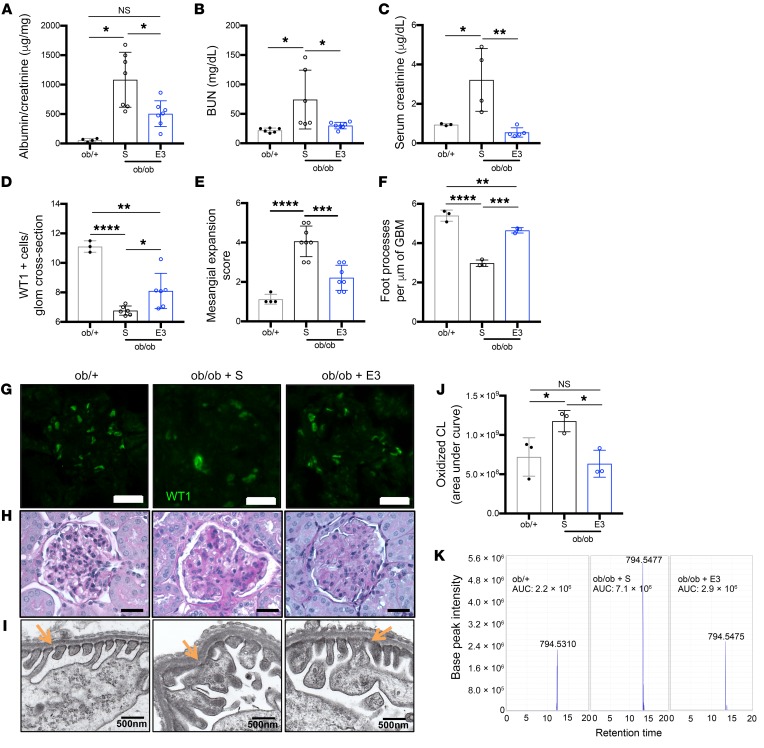
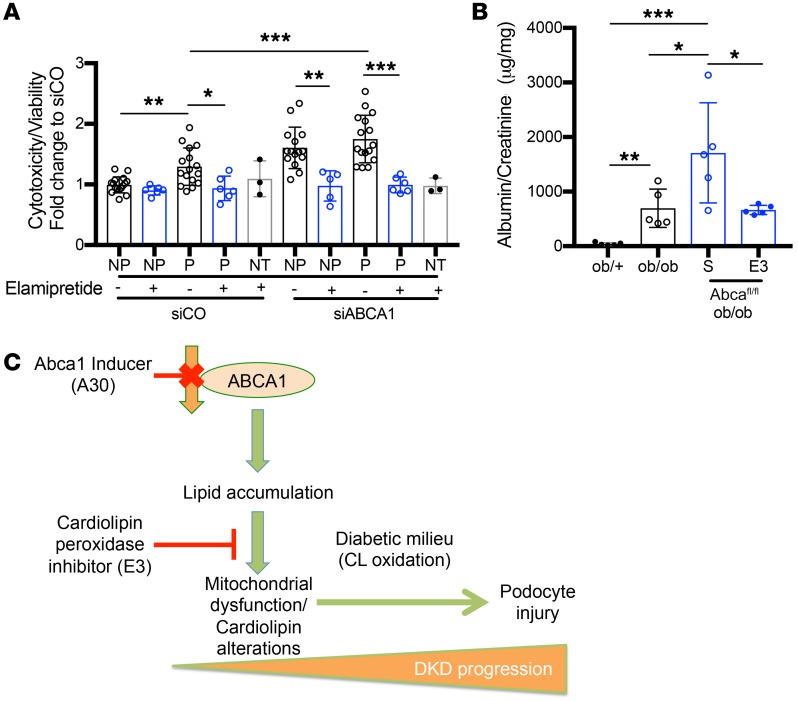
Fibroblasts from patients with Tangier disease carrying ATP-binding cassette A1 (ABCA1) loss-of-function mutations are characterized by cardiolipin accumulation, a mitochondrial-specific phospholipid. Suppression of ABCA1 expression occurs in glomeruli from patients with diabetic kidney disease (DKD) and in human podocytes exposed to DKD sera collected prior to the development of DKD. We demonstrated that siRNA ABCA1 knockdown in podocytes led to reduced oxygen consumption capabilities associated with alterations in the oxidative phosphorylation (OXPHOS) complexes and with cardiolipin accumulation. Podocyte-specific deletion of Abca1 (Abca1fl/fl) rendered mice susceptible to DKD, and pharmacological induction of ABCA1 improved established DKD. This was not mediated by free cholesterol, as genetic deletion of sterol-o-acyltransferase-1 (SOAT1) in Abca1fl/fl mice was sufficient to cause free cholesterol accumulation but did not cause glomerular injury. Instead, cardiolipin mediates ABCA1-dependent susceptibility to podocyte injury, as inhibition of cardiolipin peroxidation with elamipretide improved DKD in vivo and prevented ABCA1-dependent podocyte injury in vitro and in vivo. Collectively, we describe a pathway definitively linking ABCA1 deficiency to cardiolipin-driven mitochondrial dysfunction. We demonstrated that this pathway is relevant to DKD and that ABCA1 inducers or inhibitors of cardiolipin peroxidation may each represent therapeutic strategies for the treatment of established DKD.

Keywords: Cholesterol; Chronic kidney disease; Metabolism; Mitochondria; Nephrology.


Conflict of interest statement

Conflict of interest: GWB, AF, and SM are inventors on pending or issued patents (US 10,183,038 and US 10,052,345) aimed at diagnosing or treating proteinuric kidney diseases. They stand to gain royalties from the future commercialization of these patents. AF is Chief Scientific Officer of L&F Health LLC and is a consultant for Variant Pharmaceuticals. Variant Pharmaceuticals has licensed worldwide rights from L&F Research to develop and commercialize hydroxypropyl-beta-cyclodextrin for the treatment of kidney disease. AF is Chief Medical Officer of LipoNexT LLC. SM holds equity interest in a company presently commercializing the form of cyclodextrin referenced in this paper. AF and SM are supported by Hoffman-La Roche. AF is supported by Boehringer Ingelheim.

Figures

Figure 1
Figure 1. P sera–treated podocytes show reduced ABCA1 expression and function associated with increased cytotoxicity.
(A) Expression of several genes important in lipid metabolism was assessed by real-time PCR in NP (n = 13–16) and P (n = 14–15) sera–treated podocytes, at baseline and at time of biopsy. (B) Quantification of the percentage of radiolabeled cholesterol effluxed via the ABCA1 transporter after treatment with sera from patients obtained at baseline and at time of biopsy. Sera from NP and P patients were used in the analysis (n = 4 pooled sera for all groups). (C) Quantification of the lipid droplet content in human podocytes treated with NP and P patient sera via bodipy fluorescent intensity per cell (n = 14–15). (D) Representative images (original magnification ×20) showing bodipy staining of normal human podocytes treated with the sera from patients with NP and P DKD. (E and F) Bar graph analysis showing CellRox cytoplasmatic intensity (n = 3 for NP, n = 5 for P; pooled sera) (E) and cytotoxicity normalized to viability (n = 13 for NP, n = 14 for P) (F) in human podocytes treated with baseline P sera– compared with NP sera–treated podocytes. (G) Glomerular Abca1 expression of ob/ob mice (n = 7) compared with their heterozygous controls, ob/+ (n = 4) quantified via qRT-PCR. (H) Glomerular Abca1 expression of db/db mice (n = 5) compared with their heterozygous controls, db/+ (n = 6) quantified via qRT-PCR. (I) Correlation analysis between albumin-to-creatinine ratios (μg/mg) and glomerular Abca1 expression in db/db and ob/ob mice. Two-tailed t test (all panels except I) and linear regression used for correlation analyses (I) with r2 and P values shown. *P < 0.05; **P < 0.01; ***P < 0.001; ****P < 0.0001.
Figure 2
Figure 2. Podocyte-specific Abca1 deficiency leads to lipid accumulation, and concomitant Soat1 deficiency leads to free cholesterol accumulation in the absence of albuminuria.
(A) Representative images of oil red O–stained kidney cortex sections for the detection of glomerular lipid droplets in WT and Abca1fl/fl mice (n = 3 per group). (B) Bar graph analysis showing the quantification of total cholesterol (TC), free cholesterol (FC), cholesterol esters (CEs), and triglyceride (TG) levels extracted from kidney cortex of WT (n = 3) and podocyte-specific Abca1fl/fl mice (n = 3) (fold change in microgram lipid per milligram of protein). (C) Representative images of PAS-stained sections utilized for quantification shown for glomerular area (μm) of WT (n = 5) and Abca1fl/fl (n = 3) mice. (D) Bar graph analysis showing the quantification of TC and CE content extracted from kidney cortex of WT (n = 3–4) and Abca1fl/fl Soat1–/– (DKO) mice (n = 5). (E) Representative images for PAS-stained sections of WT (n = 5) and DKO (n = 11) mice and quantification of the mesangial expansion score. (F) Albumin-to-creatinine ratios determined in 1-year-old WT (n = 8), Abca1fl/fl (n = 3), Soat1–/– (Soat1-KO, n = 5), Abca1fl/+ Soat1–/+ (DHET, n = 4), and Abca1fl/fl Soat1–/– (DKO, n = 6) mice. Scale bars: 25 μm. Two-tailed t test (B–D) or 1-way ANOVA followed by Tukey’s multiple comparisons test (E and F). *P < 0.05; **P < 0.01.
Figure 3
Figure 3. ABCA1 deficiency is a susceptibility factor for podocyte injury contributing to worsened DKD.
(A) Quantification for cytotoxicity normalized to viability for NP (n = 16) and P (n = 15) sera–treated, or untreated (NT, n = 3) siRNA ABCA1 knockdown podocytes (siABCA1) compared with scramble control (siCO) podocytes. (BF) Ob/+, ob/ob, and Abca1fl/fl ob/ob mice were analyzed for the following: (B) albumin-to-creatinine ratios at 12 and 16 weeks (time of sacrifice) (n = 4–5 per group); (C) TC, FC, and CEs (n = 3–5 per group); (D) mesangial expansion score using PAS-stained kidney cortex sections (n = 7 per group); (E) podocyte foot processes (marked with orange arrows in H) per μm of GBM (n = 3 per group); and (F) podocyte number per glomerular cross section as determined via WT1 antibody. (GI) Representative images for (G) PAS-stained kidney cortex (scale bars: 25 μm); (H) TEM podocyte foot process measurements (mitochondria marked with yellow asterisks; scale bars: 200 nm); and (I) WT1-stained kidney cortex sections (scale bars: 25 μm). (J) Correlation analysis between BUN and kidney cortex CEs (μM cholesterol/mg protein) (n = 3–5 per group). (K) Quantification of albumin-to-creatinine ratios comparing WT (n = 4–5), Abca1fl/+ (HET) (n = 4–6), and Abcafl/fl (KO) (n = 4) mice injected with vehicle or STZ. (L) Quantification of kidney cortex TC, FC, and CEs content in KO and STZ-treated WT and KO mice (n = 3–5 per group). Two-tailed t test (A, D, E) or 1-way ANOVA followed by Tukey’s multiple comparisons test (B, C, F, K, L) and linear regression used for correlation analyses (J) with r2 and P values shown. *P < 0.05; **P < 0.01; ***P < 0.001; ****P < 0.0001.
Figure 4
Figure 4. ABCA1 deficiency leads to cardiolipin accumulation associated with reduced mitochondrial function and oxygen consumption.
(A and B) siABCA1 compared with siCO podocytes were analyzed for (A) endogenous (unpermeabilized cells) and substrate-driven (permeabilized cells + glutamate-malate [CI] or succinate [CII]) oxygen consumption rates (OCR; nmol oxygen consumed per minute normalized to mg protein) (n = 3–4 per group); (B) maximal enzymatic activity for complex I (CI), complex III (CIII), and complex IV (CIV) (n = 3–4 per group). (C) Representative Western blot image of BN-PAGE analysis of mitochondrial extracts obtained with digitonin sequentially probed for core 2 antibody (CIII), Cox I antibody (CIV), and SDHA (CII). Samples were also resolved by SDS-PAGE and probed with VDAC as loading control. (D) Densiometric quantification of Western blot analysis of digitonin extract shown in C (n = 3–4 per group). (E) Representative Western blot images of BN-PAGE analysis of mitochondrial extracts obtained with lauryl maltoside and probed for NDUFA9 (CI), SDHA (CII), CORE2 (CIII), COXI (CIV), and ATPα5 (CV). Samples were also resolved by SDS-PAGE and VDAC was detected as loading control. (F) Densiometric quantification of Western blot analysis of lauryl maltoside extraction shown in E (n = 3 per group). (G) Quantification of the relative cardiolipin and (H) monoglycerides (MG) and fatty acids (FA) content normalized to total lipids extracted from isolated mitochondria of siABCA1 compared with siCO podocytes (n = 3 per group). Two-tailed t test. *P < 0.05; **P < 0.01; ***P < 0.001.
Figure 5
Figure 5. Treatment with an Abca1 inducer (A30) ameliorates podocyte injury and DKD.
(A) Quantification of cytotoxicity normalized to viability for NP (n = 13) and P (n = 14) sera–treated, or untreated (NT, n = 3) ABCA1-overexpressing (ABCA1 OE) podocytes compared with empty vector transfected (EV) podocytes. (BF) Db/+, vehicle-treated db/db, and Abca1 inducer–treated (A30-treated) db/db mice were analyzed for (B) albumin-to-creatinine ratios determined at start of treatment (14 weeks), after 2 weeks of treatment (16 weeks), and at time of sacrifice after 4 weeks of treatment (18 weeks) (n = 5–6 per group); (C) BUN (n = 5–6 per group); (D) podocyte number per glomerular cross section (n = 3–4 per group) determined by WT1 staining; (E) mesangial expansion score quantification determined from PAS staining (n = 5–6 per group); and (F) podocyte foot processes per μm of GBM (n = 3 per group) determined from TEM images. (GI) Representative images of (G) WT1 staining (scale bars: 25 μm); (H) PAS staining (scale bars: 25 μm); and (I) TEM to identify podocyte foot processes (marked with orange arrows) per μm of GBM (scale bars: 500 nm). (J) Kidney cortex cholesterol content determination in form of TC, FC, and CEs (n = 5–6 per group). (K) Quantification of the relative cardiolipin species rich in linoleic acid (LA) or docosahexaenoic acid (DHA) analyzed via mass spectrometry and normalized to total lipids extracted from db/+, db/db vehicle, and db/db A30 kidney cortex (n = 5–6 per group). Two-tailed t test (A) or 1-way ANOVA followed by Tukey’s test (all other panels). *P < 0.05; **P < 0.01; ***P < 0.001; ****P < 0.0001.
Figure 6
Figure 6. A30 treatment results in reduced cardiolipin oxidation.
(A) Representative images of peak intensity for the specific cardiolipin species found at the m/z 794.5 (number showcased above the peak), comparing db/+ (first panel), db/db vehicle-treated mice (second panel), and db/db A30-treated mice (third panel). AUC for each representative peak is annotated. (B) Bar graph analysis of total oxidized cardiolipin species comparing db/+ controls, db/db vehicle-treated, and A30-treated mice (n = 4 per group). One-way ANOVA followed by Tukey’s test. *P < 0.05; **P < 0.01.
Figure 7
Figure 7. Inhibition of cardiolipin peroxidation ameliorates podocyte injury and DKD in ABCA1 deficient models.
(AF) Saline treated (S) Ob/+ and ob/ob mice, and E3-treated ob/ob mice were analyzed for (A) albumin-to-creatinine ratios determined after 4 weeks of treatment (20 weeks, time of sacrifice) (n = 4–7 per group); (B) BUN (n = 6–7 per group); (C) serum creatinine (n = 3–5 per group); (D) podocyte number per glomerular cross section (n = 3–6 per group) determined by WT1 staining; (E) mesangial expansion score quantification determined from PAS staining (n = 4–8 per group); and (F) podocyte foot processes per μm of GBM (n = 3 per group) determined from TEM images. (GI) Representative images of (G) WT1 staining (scale bars: 25 μm); (H) PAS staining (scale bars: 25 μm); and (I) TEM to identify podocyte foot processes (marked with orange arrows) per μm of GBM (scale bars: 500 nm). (J) Bar graph analysis of total oxidized cardiolipin species comparing ob/+ controls, ob/ob saline-treated, and E3-treated mice (n = 3 per group). (K) Representative images of peak intensity for the specific cardiolipin species found at the m/z 794.5 (number showcased above the peak), comparing ob/+ (first panel), ob/ob saline-treated mice (second panel), and ob/ob E3-treated mice (third panel). AUC for each representative peak is annotated. One-way ANOVA followed by Tukey’s test. *P < 0.05; **P < 0.01; ***P < 0.001; ****P < 0.0001.
Figure 8
Figure 8. Inhibition of cardiolipin peroxidation reverts ABCA1 deficiency–mediated podocyte injury.
(A) Quantification of cytotoxicity normalized to viability in siABCA1 and siCO podocytes treated with NP and P sera and cotreated with E3, or not treated with E3 (n=5-16 pooled sera per group). (B) Albumin-to-creatinine ratios determined after 4 weeks of treatment in 16-week-old ob/+, ob/ob, Abca1fl/fl ob/ob saline-treated (S) and Abca1fl/fl ob/ob E3-treated mice (n = 5 per group). (C) Schematic representation of the current working model and major conclusions drawn from this study. One-way ANOVA followed by Tukey’s test. *P < 0.05;**P < 0.01; ***P < 0.001.

Comment in

References

    1. US Renal Data System 2016 Annual Data Report: Epidemiology of Kidney Disease in the United States Am J Kidney Dis. 2017;69(3S1):A4 - PubMed
    1. Patney V, Whaley-Connell A, Bakris G. Hypertension management in diabetic kidney disease. Diabetes Spectr. 2015;28(3):175–180. doi: 10.2337/diaspect.28.3.175. - DOI - PMC - PubMed
    1. de Borst MH, Navis G. Diabetes: Risks of strict glycaemic control in diabetic nephropathy. Nat Rev Nephrol. 2015;11(1):5–6. doi: 10.1038/nrneph.2014.209. - DOI - PubMed
    1. Anders HJ, Huber TB, Isermann B, Schiffer M. CKD in diabetes: diabetic kidney disease versus nondiabetic kidney disease. Nat Rev Nephrol. 2018;14(6):361–377. doi: 10.1038/s41581-018-0001-y. - DOI - PubMed
    1. Pagtalunan ME, et al. Podocyte loss and progressive glomerular injury in type II diabetes. J Clin Invest. 1997;99(2):342–348. doi: 10.1172/JCI119163. - DOI - PMC - PubMed

Publication types