Meta-Analysis
. 2020 Jan 15;36(2):487-495.
doi: 10.1093/bioinformatics/btz561.

GSMA: an approach to identify robust global and test Gene Signatures using Meta-Analysis

Affiliations
Meta-Analysis

GSMA: an approach to identify robust global and test Gene Signatures using Meta-Analysis

Adib Shafi et al. Bioinformatics. .

Abstract

Motivation: Recent advances in biomedical research have made massive amount of transcriptomic data available in public repositories from different sources. Due to the heterogeneity present in the individual experiments, identifying reproducible biomarkers for a given disease from multiple independent studies has become a major challenge. The widely used meta-analysis approaches, such as Fisher's method, Stouffer's method, minP and maxP, have at least two major limitations: (i) they are sensitive to outliers, and (ii) they perform only one statistical test for each individual study, and hence do not fully utilize the potential sample size to gain statistical power.

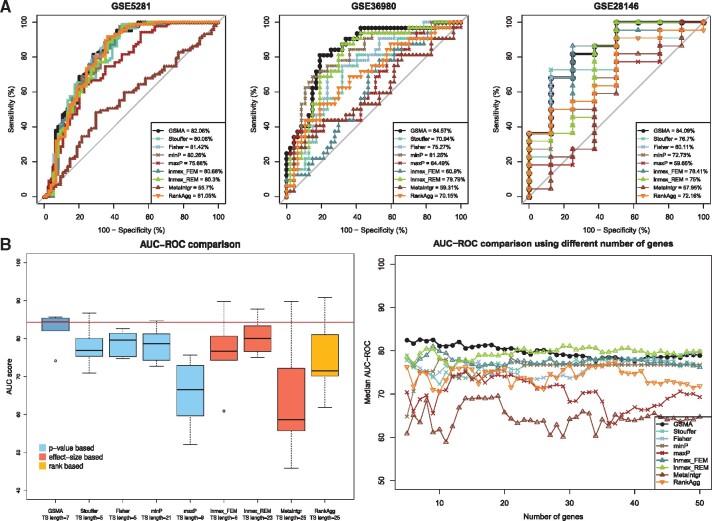
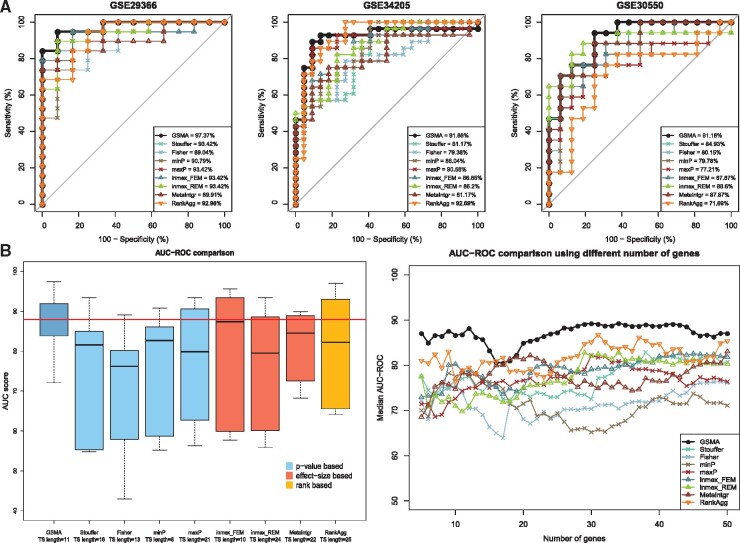
Results: Here, we propose a gene-level meta-analysis framework that overcomes these limitations and identifies a gene signature that is reliable and reproducible across multiple independent studies of a given disease. The approach provides a comprehensive global signature that can be used to understand the underlying biological phenomena, and a smaller test signature that can be used to classify future samples of a given disease. We demonstrate the utility of the framework by constructing disease signatures for influenza and Alzheimer's disease using nine datasets including 1108 individuals. These signatures are then validated on 12 independent datasets including 912 individuals. The results indicate that the proposed approach performs better than the majority of the existing meta-analysis approaches in terms of both sensitivity as well as specificity. The proposed signatures could be further used in diagnosis, prognosis and identification of therapeutic targets.

Supplementary information: Supplementary data are available at Bioinformatics online.


Figures

Fig. 1.
Fig. 1.
The overall pipeline of the proposed framework. The framework takes multiple independent gene expression studies of the same condition as input and performs gene level meta-analysis in two stages: intra-level analysis and inter-level analysis. In the intra-level analysis, each dataset is divided into smaller datasets such that each smaller dataset consists of all the control samples and a subset of the disease samples (the algorithm is shown in the Supplementary Fig. S1). For each gene, P-values are calculated using moderated t-test and later combined using addCLT. In the inter-level analysis, intra-level P-values coming from individual datasets are combined using the same technique in order to compute meta-P-value for each gene. Concurrently, a LOO analysis is carried out to avoid the influence from a single study. The final output of the framework is a list of DE genes that are robust and reproducible across the independent studies of a given disease (referred as the global signature in this manuscript)
Fig. 2.
Fig. 2.
Comparison of the AUC-ROC scores across the six independent validation datasets based on the test signature, identified by the proposed meta-analysis framework–GSMA versus using one given discovery dataset at a time. Here, the median AUC-ROC score obtained by GSMA is significantly higher (P-value = 0.0003) than all other median AUC-ROC scores obtained on any individual dataset. This comparison shows that the proposed meta-analysis yield better results that any single analysis
Fig. 3.
Fig. 3.
A comparison between the proposed meta-analysis framework—GSMA and eight other existing meta-analysis approaches—Stouffer’s method, Fisher’s method, minP, maxP, inmex_FEM, inmex_REM, MetaIntegrator and RankAggreg, using AD datasets. PanelA shows the AUC plots across three (out of six) independent validation datasets based on the test signature identified by each framework. For each of these three datasets, GSMA achieved higher AUC-ROC score compared to other approaches. The left plot in panelB shows the comparison of the AUC-ROC scores across all six validation datasets. The median AUC-ROC score obtained by using GSMA is significantly higher than the median AUC-ROC scores obtained by each category of approach(es) (P-value = 0.009 for four other P-value-based approaches, P-value = 0.045 for three other effect-size based approaches, P-value = 0.047 for the rank aggregation based approach, using Wilcoxon rank sum test). Finally, the right plot in panel B shows that, regardless of the length of the test signature, GSMA achieved higher average AUC-ROC scores compared to the others approaches in most of the cases
Fig. 4.
Fig. 4.
A comparison between the proposed meta-analysis framework—GSMA and the eight other existing meta-analysis approaches—Stouffer’s method, Fisher’s method, minP, maxP, inmex_FEM, inmex_REM, MetaIntegrator and RankAggreg, using influenza disease datasets. PanelA shows the AUC plots across three (out of six) independent validation datasets based on the test signature identified by each framework. In two out of these three datasets, GSMA achieved higher AUC-ROC score compared to other approaches. The left plot in panelB shows the comparison of the AUC-ROC scores across all six validation datasets. The median AUC-ROC score obtained by GSMA is significantly higher (P-value = 0.032) than all other median AUC-ROC scores obtained by the other P-value based approaches. Finally, the right plot in panel B shows that, regardless of the length of the test signature, GSMA achieved higher average AUC-ROC scores compared to the others approaches in most of the cases

References

    1. Barrett T. et al. (2005) NCBI GEO: mining millions of expression profiles–database and tools. Nucleic Acids Res., 33(Database Issue), D562–D566. - PMC - PubMed
    1. Bedse G. et al. (2015) The role of endocannabinoid signaling in the molecular mechanisms of neurodegeneration in Alzheimer’s disease. J. Alzheimer’s Dis., 43, 1115–1136. - PubMed
    1. Benjamin D.J. et al. (2018) Redefine statistical significance. Nat. Human Behav., 2, 6. - PubMed
    1. Drăghici S. et al. (2006) Reliability and reproducibility issues in DNA microarray measurements. Trends Genet., 22, 101–109. - PMC - PubMed
    1. Edgington E.S. (1972) An additive method for combining probability values from independent experiments. J. Psychol., 80, 351–363.

Publication types