. 2019 Jul 22;15(7):e1007186.
doi: 10.1371/journal.pcbi.1007186. eCollection 2019 Jul.

Why do eukaryotic proteins contain more intrinsically disordered regions?

Affiliations

Why do eukaryotic proteins contain more intrinsically disordered regions?

Walter Basile et al. PLoS Comput Biol. .

Abstract

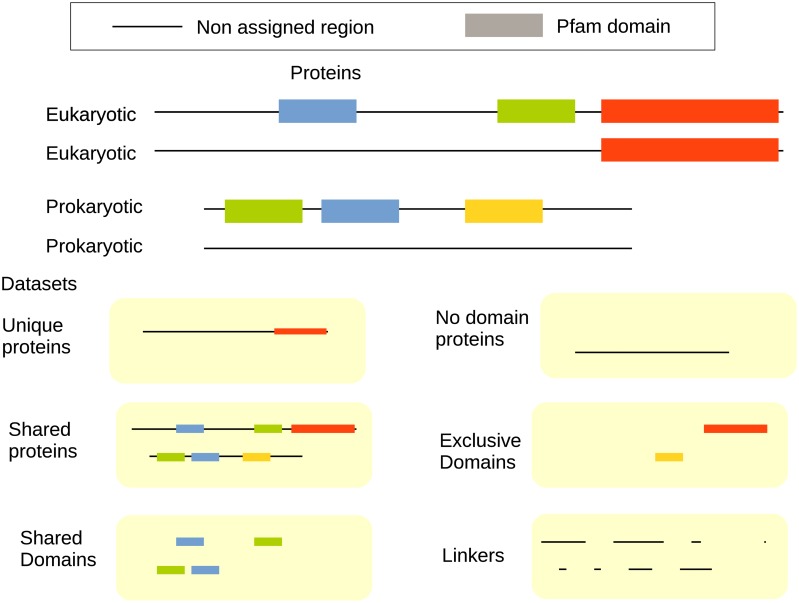
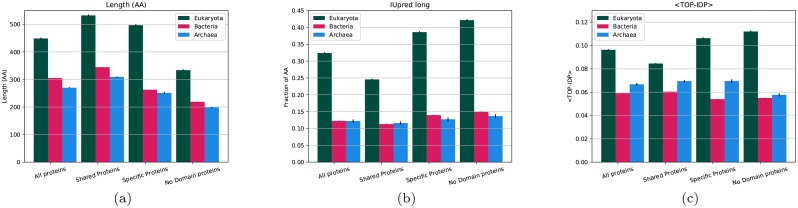
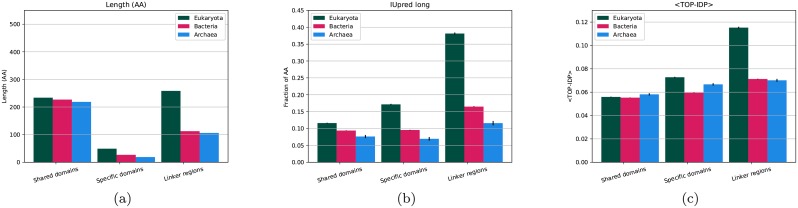
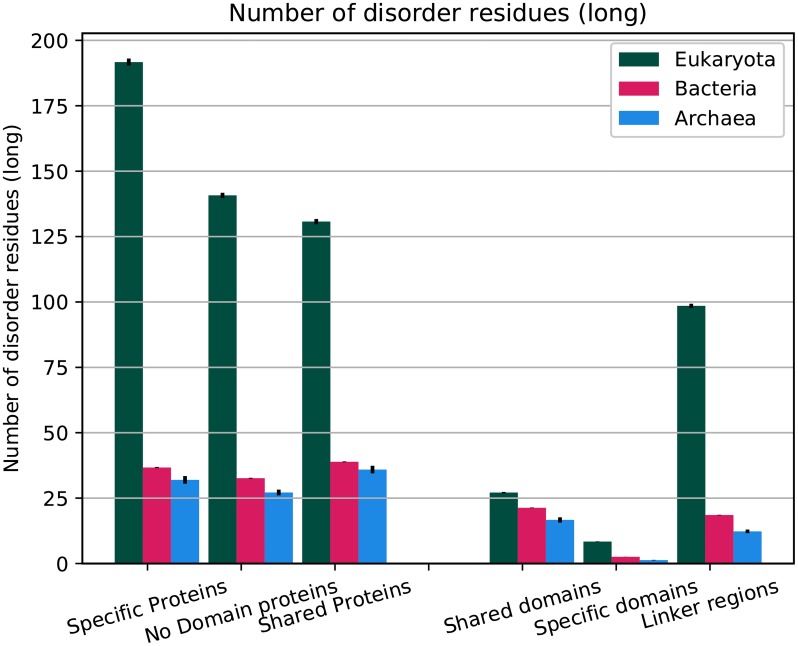
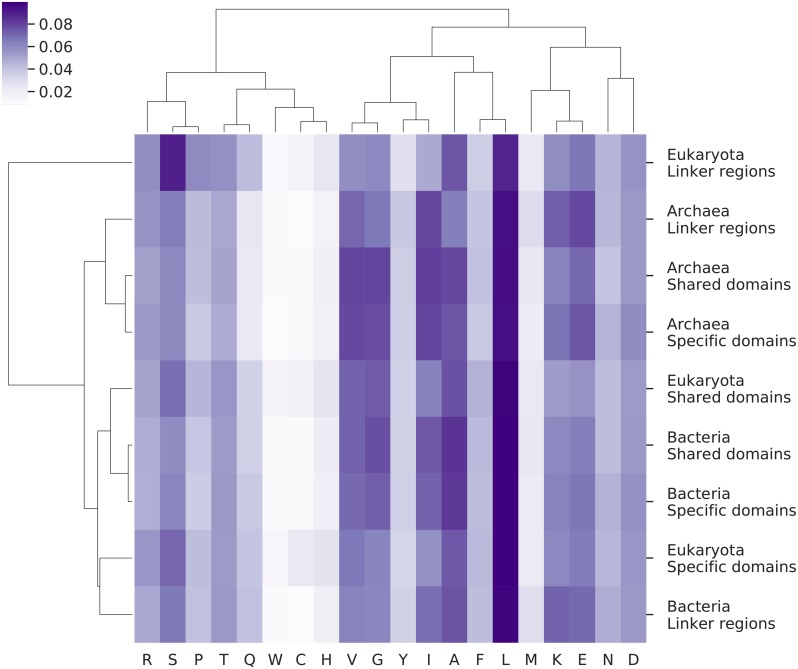
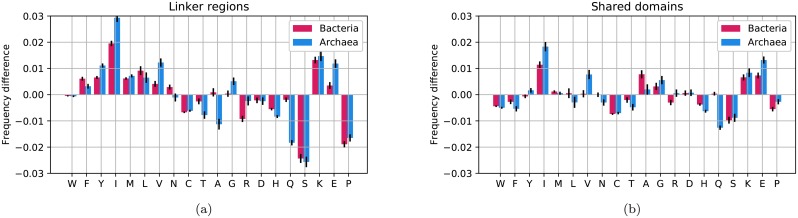
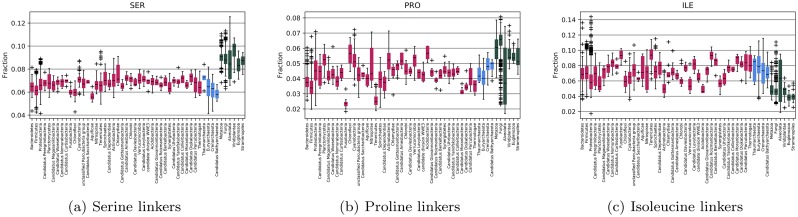
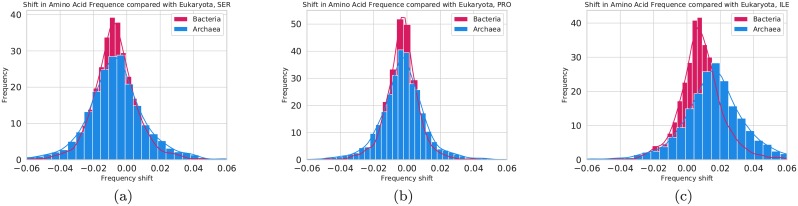
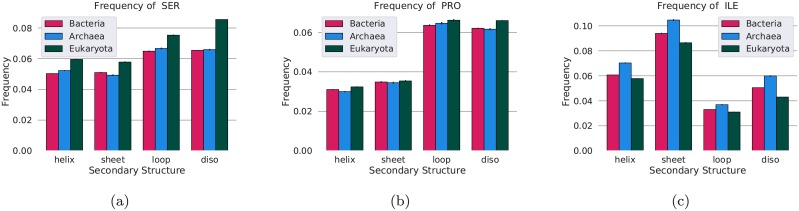
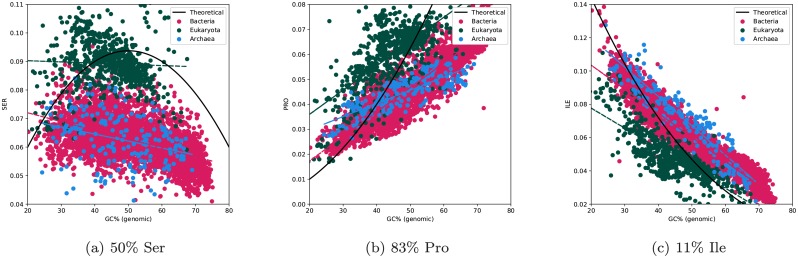
Intrinsic disorder is more abundant in eukaryotic than prokaryotic proteins. Methods predicting intrinsic disorder are based on the amino acid sequence of a protein. Therefore, there must exist an underlying difference in the sequences between eukaryotic and prokaryotic proteins causing the (predicted) difference in intrinsic disorder. By comparing proteins, from complete eukaryotic and prokaryotic proteomes, we show that the difference in intrinsic disorder emerges from the linker regions connecting Pfam domains. Eukaryotic proteins have more extended linker regions, and in addition, the eukaryotic linkers are significantly more disordered, 38% vs. 12-16% disordered residues. Next, we examined the underlying reason for the increase in disorder in eukaryotic linkers, and we found that the changes in abundance of only three amino acids cause the increase. Eukaryotic proteins contain 8.6% serine; while prokaryotic proteins have 6.5%, eukaryotic proteins also contain 5.4% proline and 5.3% isoleucine compared with 4.0% proline and ≈ 7.5% isoleucine in the prokaryotes. All these three differences contribute to the increased disorder in eukaryotic proteins. It is tempting to speculate that the increase in serine frequencies in eukaryotes is related to regulation by kinases, but direct evidence for this is lacking. The differences are observed in all phyla, protein families, structural regions and type of protein but are most pronounced in disordered and linker regions. The observation that differences in the abundance of three amino acids cause the difference in disorder between eukaryotic and prokaryotic proteins raises the question: Are amino acid frequencies different in eukaryotic linkers because the linkers are more disordered or do the differences cause the increased disorder?


Conflict of interest statement

The authors have declared that no competing interests exist.

Figures

Fig 1
Fig 1
Division of proteins into six subsets: First all proteins are divided into three groups: “kingdom specific proteins” that only contain domains unique to one of the kingdoms, “no domain proteins” without any domains and “shared proteins” that contains at least one of the “shared domains”. The last group is then further divided into three regions: “shared domains”, “specific domains”, and “linkers”
Fig 2
Fig 2. Average properties of proteins from different kingdoms; (a) average length, (b) fraction of residues predicted to be disordered by IUPred and (c) average TOP-IDP scores.
Error bars represent the standard error for each property.
Fig 3
Fig 3. Average properties of proteins regions from different kingdoms; (a) average length, (b) fraction of residues predicted to be disordered by IUPred and (c) average TOP-IDP scores.
Error bars represent the standard error for each property.
Fig 4
Fig 4. Average number of residues predicted to be disordered in different protein groups and regions.
Error bars represent the standard error for each property.
Fig 5
Fig 5. Heat map showing the similarity of amino acid frequency profiles in different regions as measured by the Pearson correlation coefficient.
The colour of each cell represents the frequency of each amino acid in that region, according to the reference colour bar.
Fig 6
Fig 6. Differences in amino acid frequency between eukaryotes and prokaryotes (red for bacteria, blue for Archaea) for “linker regions” (a) and “shared domains” (b).
All comparisons are made using the eukaryotic frequencies as a baseline, i.e. if an amino acid (such as serine) is more abundant in eukaryotes; the shift is downwards as this amino acid is less frequent in prokaryotes. Error bars represent the standard error for each amino acid.
Fig 7
Fig 7. Distribution of differences in amino acids frequencies in Pfam families.
Only Pfam families that contain at least 100 members in bacteria and eukaryotes are included in the comparison. The differences are measured as the shift from the observed amino acid frequency in eukaryotes. Blue bars represent Archaea and red bacteria. Differences are for (a) serine, (b) proline, and (c) isoleucine.
Fig 8
Fig 8. Frequency of (a) serine, (b) proline, and (c) isoleucine in linker regions in proteomes grouped by phylum. Bacterial groups are red, eukaryotic dark green, and archaeal blue.
Fig 9
Fig 9. Frequency of (a) serine, (b) proline, and (c) isoleucine in different secondary structures in proteins from eukaryotes (dark green), bacteria (red) and Archaea (blue).
Fig 10
Fig 10. Frequency of (a) serine, (b) proline, and (c) isoleucine vs. GC of the “linker regions” in the genomes.
The amino acids are sorted after the GC content of their codons. The number represents the fraction of GC among the codons. The black line represents the expected frequency from codon usage only. Here, all genomes before the filtering on GC are included for clarity.

References

    1. Jacob E, Horovitz A, Unger R. Different mechanistic requirements for prokaryotic and eukaryotic chaperonins: a lattice study. Bioinformatics. 2007. July;23(13):i240–8. 10.1093/bioinformatics/btm180 - DOI - PubMed
    1. Apic G, Gough J, Teichmann SA. Domain combinations in archaeal, eubacterial and eukaryotic proteomes. J Mol Biol. 2001;310(2):311–325. 10.1006/jmbi.2001.4776 - DOI - PubMed
    1. Gerstein M, Levitt M. Comprehensive assessment of automatic structural alignment against a manual standard, the SCOP classification of proteins. Protein Sci. 1998;7:445–456. 10.1002/pro.5560070226 - DOI - PMC - PubMed
    1. Liu J, Rost B. CHOP proteins into structural domain-like fragments. PROTEINS: Structure, Function and Bioinformatics. 2004;55:678–688. 10.1002/prot.20095 - DOI - PubMed
    1. Ekman D, Bjorklund AK, Frey-Skott J, Elofsson A. Multi-domain proteins in the three kingdoms of life: orphan domains and other unassigned regions. J Mol Biol. 2005. April;348(1):231–243. 10.1016/j.jmb.2005.02.007 - DOI - PubMed

Publication types