. 2019 Jul 22;13(7):e0007566.
doi: 10.1371/journal.pntd.0007566. eCollection 2019 Jul.

Unveil the transcriptional landscape at the Cryptococcus-host axis in mice and nonhuman primates

Affiliations

Unveil the transcriptional landscape at the Cryptococcus-host axis in mice and nonhuman primates

Hailong Li et al. PLoS Negl Trop Dis. .

Abstract

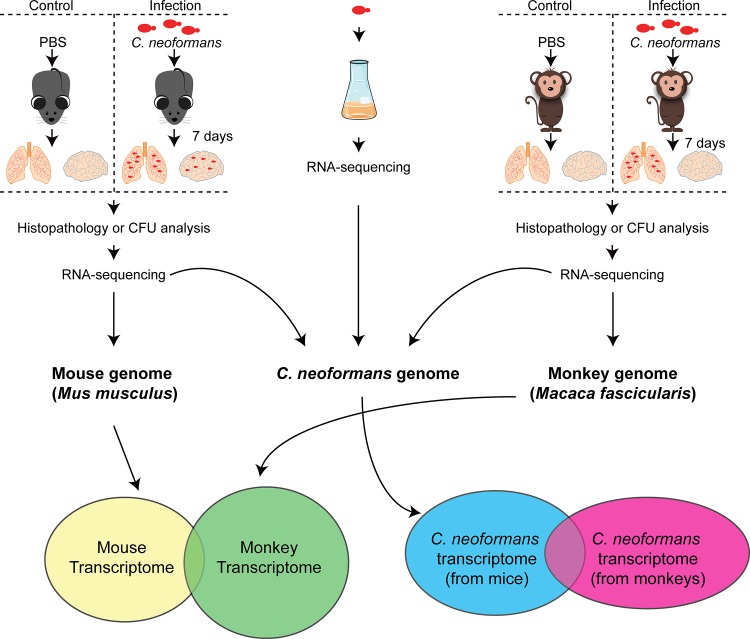
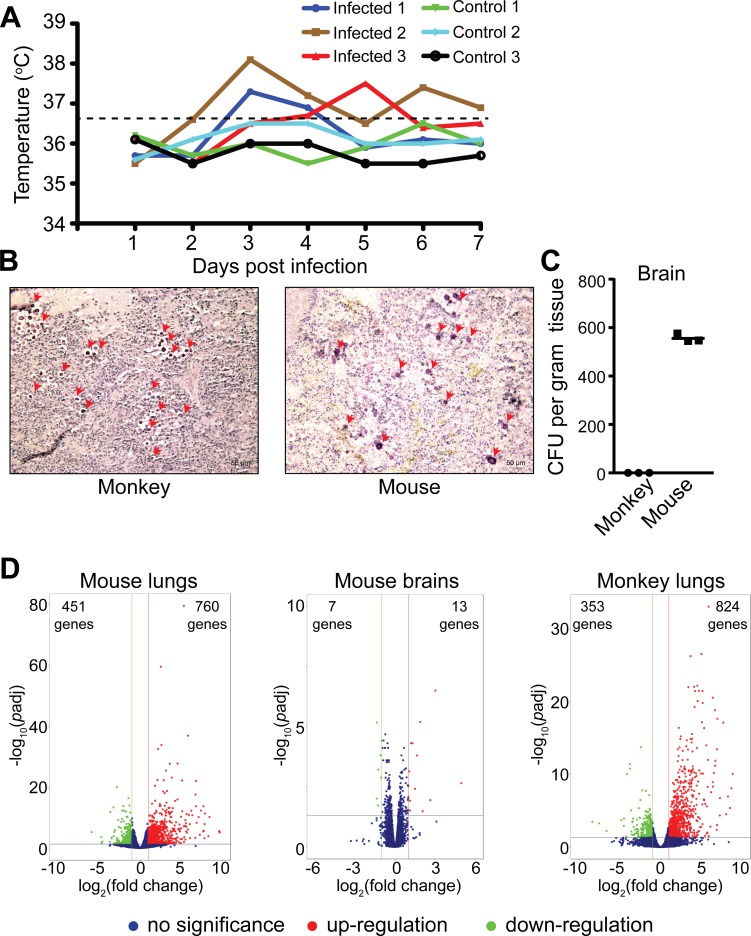
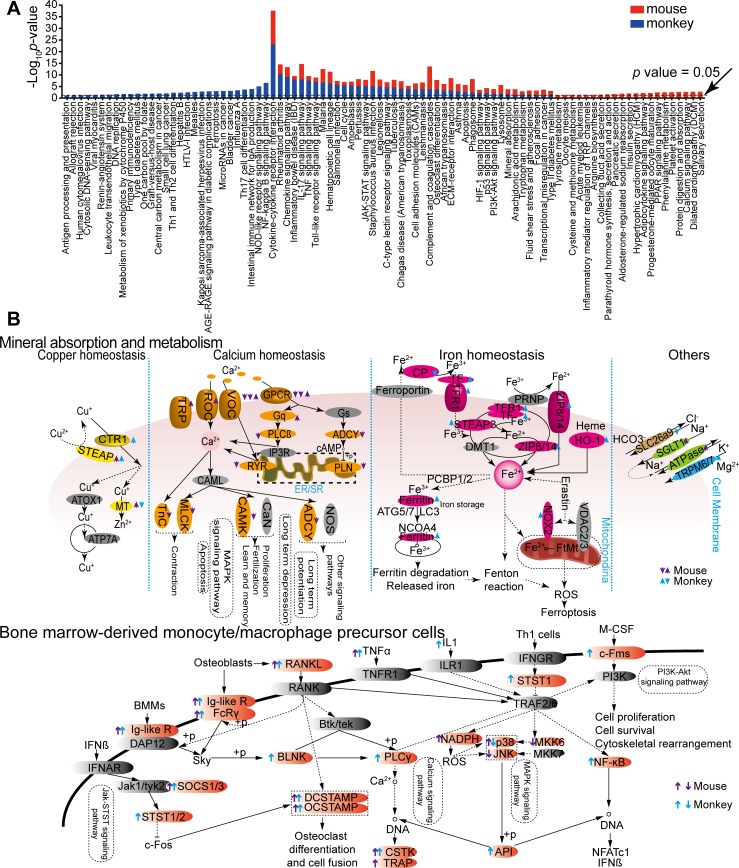
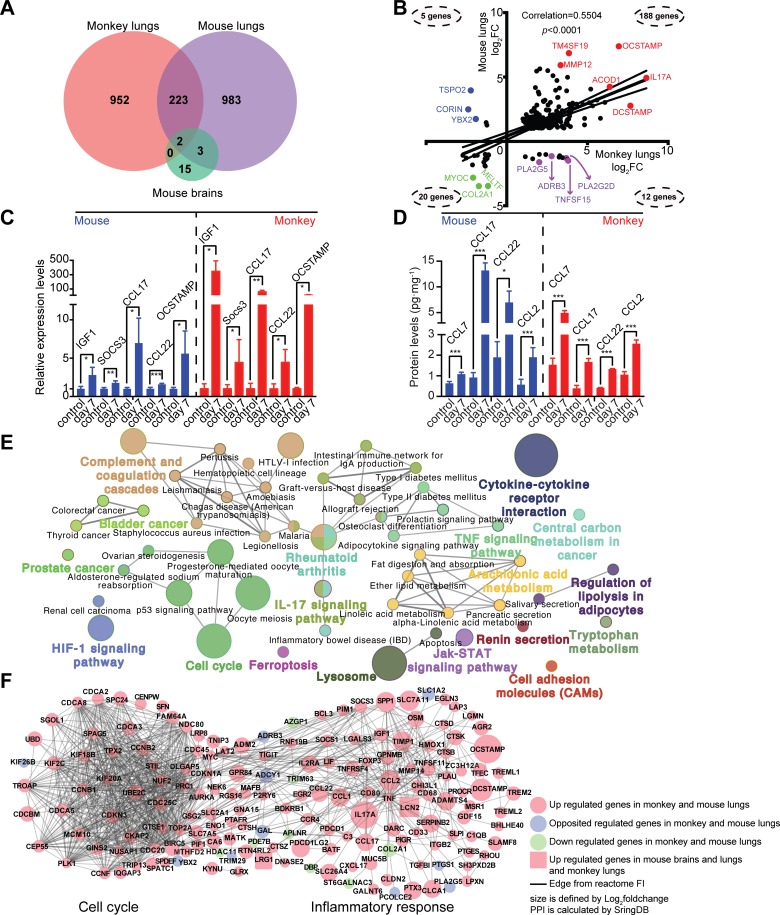
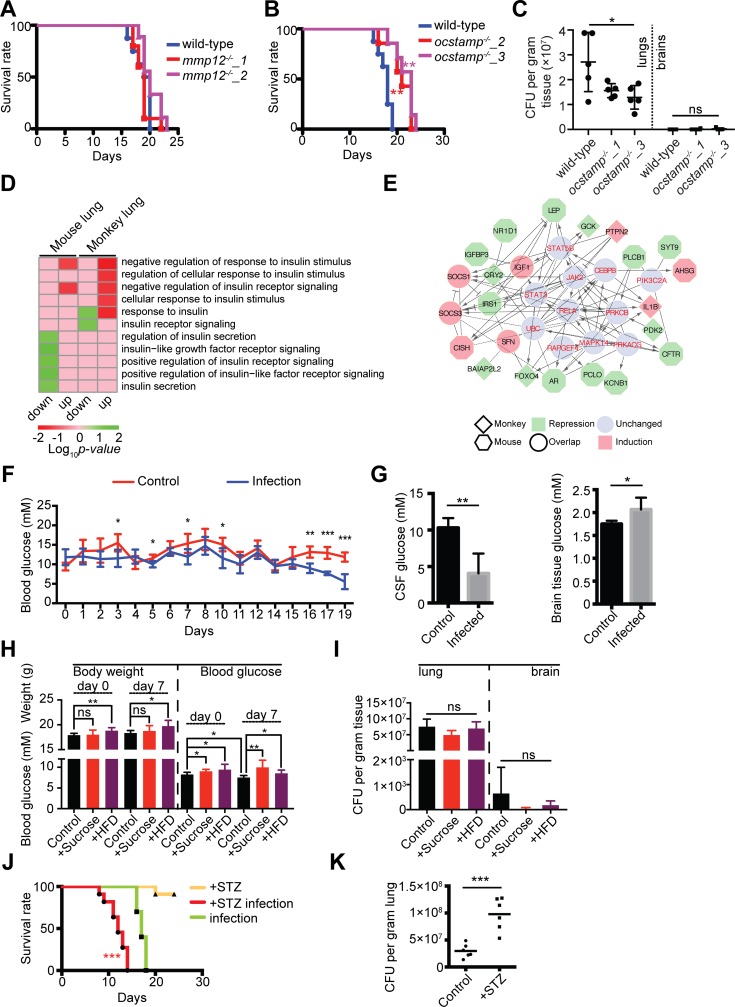
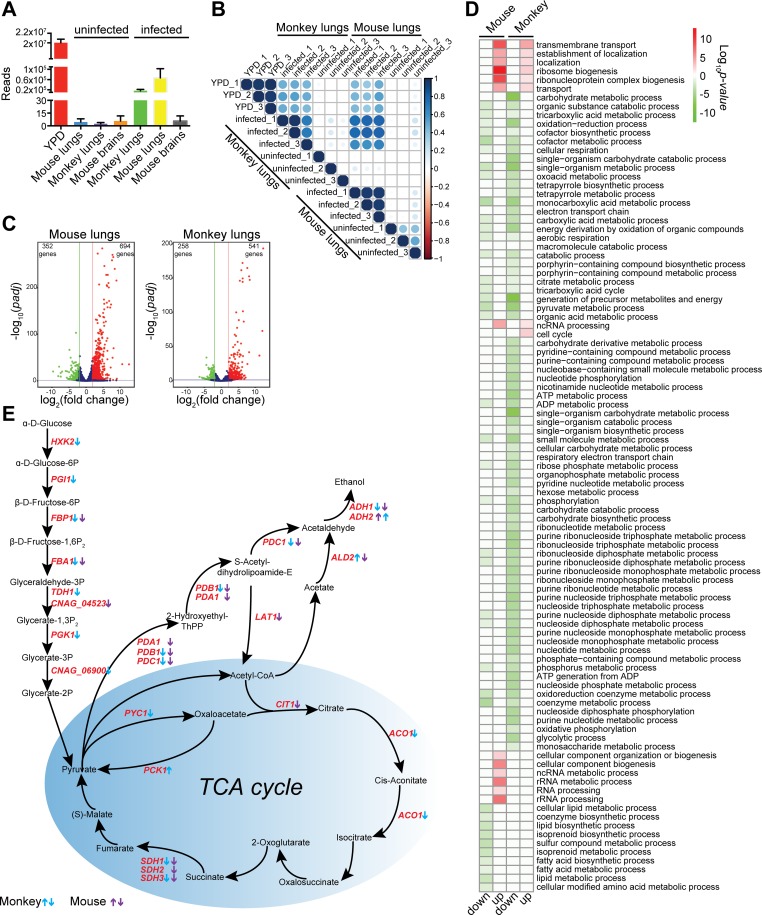
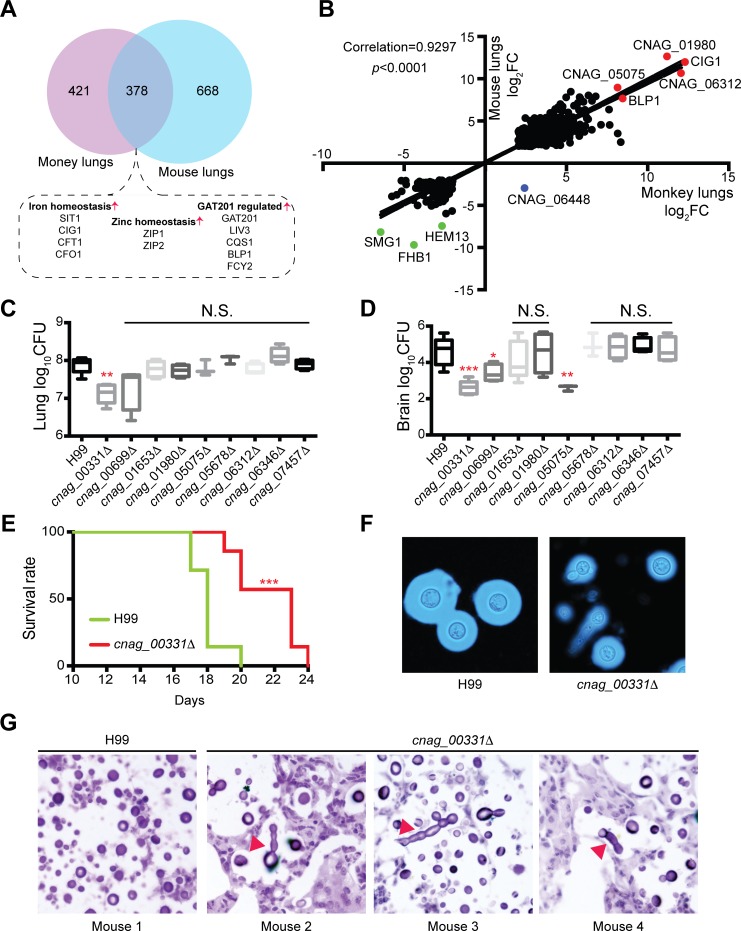
Pathogens and hosts require rapid modulation of virulence and defense mechanisms at the infection axis, but monitoring such modulations is challenging. In studying the human fungal pathogen Cryptococcus neoformans, mouse and rabbit infection models are often employed to shed light on the disease mechanisms but that may not be clinically relevant. In this study, we developed an animal infection model using the non-human primate cynomolgus monkey Macaca fascicularis. In addition, we systematically profiled and compared transcriptional responses between the infected mice and the cynomolgus monkey, using simultaneous or dual RNA next-generation sequencing. We demonstrated that there are shared but distinct transcriptional profiles between the two models following C. neoformans infection. Specifically, genes involved in immune and inflammatory responses are all upregulated. Osteoclastogenesis and insulin signaling are also significantly co-regulated in both models and disrupting an osteoclastogenesis-associated gene (OC-STAMP) or the insulin-signaling process significantly altered the host tolerance to C. neoformans. Moreover, C. neoformans was shown to activate metal sequestration, dampen the sugar metabolism, and control cell morphology during infection. Taking together, we described the development of a non-human primate model of cryptococcosis that allowed us to perform an in-depth analysis and comparison of transcriptome profiles during infections of two animal models and conceptually identify host genes important in disease responses. This study provides new insights in understanding fungal pathogenesis mechanisms that potentially facilitate the identification of novel drug targets for the treatment of cryptococcal infection.


Conflict of interest statement

The authors have declared that no competing interests exist.

Figures

Fig 1
Fig 1. Experimental flow chart.
The wild type C. neoformans strain H99 was grown in YPD medium. Cells were then washed and counted, and divided into three groups: YPD control group, mouse infection group, and monkey infection group. For the control group, fungal cells were grown in YPD medium at 37°C and 200 rpm for 12 hours, washed, and maintained in RNAlater at -80°C. Animals were infected via intratracheal injection in three C57BL/6 female mice and three female Macaca fascicularis. Three mice and three monkeys were also infected with PBS buffer as controls. Animal tissues were collected and processed for either library construction, histology observation, or CFU determination.
Fig 2
Fig 2. RNA-Seq of mice and monkeys infected with C. neoformans.
(A) Back temperature was used to indicate body temperature in monkeys and that was measured every 24 hours following infection. (B) Histopathology studies of infected mouse and monkey lung tissues fixed and sectioned at 10 μm thickness, then stained with mucicarmine. Cryptococcus neoformans cells are indicated by red arrows (scale bar = 50 μm). (C)Cryptococcus neoformans colony forming units (CFUs) in mouse and monkey brain tissues. Infected brain samples were homogenized and plated onto YPD agar plates. Five random monkey brain samples were pooled to maximize detection of fungal cells. The YPD agar plates were incubated at 30°C for 3 days. Fungal cell colonies were counted, and CFUs were calculated. (D) Volcano plots of detected transcripts. Normalized transcripts from infected mouse lung and brain tissues and infected monkey lung tissues are plotted. When transcript changes are at least 2-fold with p-adj < 0.05, the genes were considered significantly differentially expressed. Red dots indicate induced transcripts, and green dots indicate repressed transcripts. The numbers of differentially expressed transcripts are indicated.
Fig 3
Fig 3. KEGG analyses of C. neoformans-infected lung tissues from mice and monkeys.
(A) Significantly expressed transcripts were subjected to KEGG analyses using Clusterprofiler 3.6.0 and plotted. Values in blue are for monkey lungs and values in red are for mice lung tissues. The dashed line separates values that meet the significance test (p < 0.05) from those that do not. (B) Differentially expressed metal and bone homeostasis genes (arrows). Upward arrows indicate induction of gene expression, and downward arrows indicate repression of gene expression. Monkey genes are indicated by blue arrows, and mouse genes are indicated by purple arrows.
Fig 4
Fig 4. Correlations between C. neoformans-infected mouse and monkey tissues.
(A) Differentially expressed mouse and monkey genes analyzed using a Venn diagram. (B) Correlations and p values for gene expression patterns of 225 overlapping genes. The number of genes in each group are indicated. (C) RT-qPCR assays were performed for IGF1, SOCS3, CCL17, CCL22 and OC-STAMP. Three biological replicates were performed for each gene. Student t test was performed. *p < 0.05, ** p < 0.01, or ***p < 0.005. (D) The production of chemokines was quantified using ELISA. Three biological replicates were performed for each gene. Student t test was performed. *p < 0.05, ** p < 0.01, or ***p < 0.005. (E) The gene ontology (GO) regulation network of 225 genes. After identifying the human orthologs of 225 genes using Biomart (http://www.biomart.org), the enriched GO terms were calculated using Cytoscape 3.6.0 and ClueGO v2.5.2 employing medium network specificity. (F) Regulation network of overlapping genes. The regulation relationships between 225 overlapping genes were calculated using StringDB version 10.5 (https://string-db.org). Of those, 167 gene products (nodes) were mapped, and 976 relationships (edges) were located in the network. The network was constructed using Cytoscape. Pink circles indicate induced genes in monkey and mouse lungs. Blue circles indicate genes that are reciprocally expressed between mice and monkeys. Green circles indicate repressed genes in monkey and mouse lungs. Pink squares indicate genes that are up-regulated under all conditions.
Fig 5
Fig 5. Host OC-STAMP and insulin-signaling play important roles in Cryptococcus neoformans infection.
(A) Survival curve of C. neoformans-infected MMP12-/- mice. Cryptococcus neoformans strain H99 was used to infect wild-type C57BL/6 mice (n = 10) and two lines of MMP12-/- female mice (MMP12-/-_1 mice, n = 7; MMP12-/-_2 mice, n = 8). The intranasal route of infection was employed, and animals were monitored daily for signs of infection. Statistical analysis was performed using the log-rank test. (B) Survival curve of C. neoformans-infected OC-STAMP12-/- mice. The H99 strain was used to infect the wild-type C57BL/6 mice (n = 8), and two lines of OC-STAMP-/- female mice (OC-STAMP-/-_2 mice, n = 8; OC-STAMP -/-_3 mice, n = 7) via the intranasal route of infection was applied, and animals were monitored for signs of infection. Statistical analysis was performed using the log-rank test (**p < 0.01). (C) Mouse lung tissues of C. neoformans-infected OC-STAMP -/- mice were assayed for CFUs. Infections were performed as described in Fig 5C (n = 5). Lung and brain tissues were removed 14 days postinfection, then homogenized and plated onto YPD agar plates. Fungal cells were counted, and CFUs were calculated. Statistical analysis was performed using one-way ANOVA (*p < 0.05). (D) Gene ontology for insulin-associated biological processes was calculated. Terms related to insulin action are shown. (E) Gene regulation network for genes significantly enriched based on GO (Fig 5D). Human orthologs were identified, and the reactome network was constructed using the human reactome database. (F) Blood glucose tests in C. neoformans infected mice. Ten C57BL/6 mice were intranasally inoculated with the H99 strain. Ten additional mice were used as controls, sham infected with PBS buffer. Glucose levels were measured using blood samples from tail veins. The Student t test was performed (**p < 0.01, ***p < 0.005). (G) Glucose alterations in the cerebrospinal fluid (CSF) and brain tissues from infected mice. Controls (n = 4) and infected mice (n = 4) were humanely killed 19 days postinfection, and CSF samples were isolated. Brain tissues were homogenized. Glucose levels were measured. The Student t test was performed (**p < 0.01, *p < 0.05). (H) Mice were treated with high sugar- or fat-diet. Mice were divided into three groups (n = 7 each group): control group (normal chow and water), high sugar group (normal chow and 30% w/v sucrose), and high fat group (high fat-diet, HFD and normal water). Body weights and blood sugar levels were measured. (I) CFU analysis of high sugar- and fat-diet treated mice. Mice from Fig 5H was used for CFU assays. ns indicates no significant change. (J) Infection survival assays in insulin-deficient mice. C57BL/6 female mice were divided into three groups: the STZ group, STZ infection group, and infection group (n = 10 each). In the first two, STZ (150 mg/kg) was injected, and blood glucose levels were monitored. When the glucose level was greater than 300 mg/dL the mouse was used for further analysis. The two infection groups were infected with the H99 strain of C. neoformans via the intranasal route. Animals were monitored for sickness and signs of infection. Statistical analysis was performed using the log-rank test (***p < 0.005). (K) The CFU analysis of STZ-treated mice. The infection experiment was performed as described in Fig 5H (n = 6). Animals were humanely killed 11 days postinfection, and CFUs from lung tissues were counted and calculated. The Student t test was performed (*** p < 0.005).
Fig 6
Fig 6. Cryptococcus neoformans transcriptional profiles from lung tissues of mice and monkeys.
(A)Read counts of C. neoformans dual RNA sequences mapped to the C. neoformans genome. Genome-matched reads were counted and plotted, showing an average of three replicates. Standard deviations are as shown. (B) Correlations between C. neoformans dual RNA data. Cryptococcus neoformans genome-matched reads were compared, and correlations were determined using the corrplot package version 0.84. (C) Volcano plots of normalized C. neoformans transcripts from infected mouse lung and monkey lung tissues. Transcripts induced or repressed at least 4-fold with p-adj < 0.05 were considered significantly differentially expressed. Red dots represent induced transcripts, and green dots indicate repressed transcripts. The numbers of differentially expressed transcripts are indicated. (D)Gene ontology analysis of C. neoformans genes from mouse and monkey lung tissues. Significantly enriched GO terms are shown. (E) Gene regulation of glycolysis and the TCA cycle during pulmonary C. neoformans infection of mice and monkeys. Gene regulation patterns are indicated by arrows, indicating mouse genes in purple and monkey genes in blue.
Fig 7
Fig 7. Identification of novel virulence factors in Cryptococcus neoformans.
(A) Comparative transcriptome analysis of pulmonary C. neoformans in mice and monkeys. Cryptococcus neoformans genes from mouse and monkey lungs were analyzed using dual RNA sequencing, compared, and summarized using a Venn diagram. Important virulence modulators were identified and included genes involved in iron and zinc homeostasis and GAT201 regulation. (B) Correlation of C. neoformans genes that overlap between mouse and monkey lungs. The differentially expressed C. neoformans genes from mice and monkeys were plotted based on gene expression, and correlations and p-values were calculated. The most significantly induced and repressed genes are indicated, the former in red and the latter in green. (C) Lung CFU analysis of C. neoformans knockout mutants. Female C57BL/6 mice (n = 5) were intranasally infected with C. neoformans strains. Lung tissues were isolated 14 days postinfection, and CFUs were calculated. The Student t test was performed (**p < 0.01; N.S. indicates that significance was not found). (D) Brain CFU analysis of C. neoformans knockout mutants. Brain tissues from Fig 7C were isolated 14 days postinfection, and CFUs were calculated. The Student t test was performed (***p < 0.005, **p < 0.01, *p < 0.05; N.S. indicates that significance was not found). (E) Survival curve of animals infected with the cnag_00331Δ mutant. The experiment was performed as described in Fig 7C (n = 8). Animals were monitored for signs of infection. Statistical analysis was performed using the log-rank test (***p < 0.005). (F) Capsule production in cnag_00331Δ mutant cells. Cryptococcus neoformans strains were incubated in Dulbecco’s Modified Eagle supplemented with 10% FBS for 3 days. (G) Histopathology of infected mouse lung sections. Lung tissues from Fig 7C were fixed and stained with hematoxylin and eosin, then examined. Abnormal morphology in C. neoformans cells is indicated by red arrows.

Similar articles

Cited by

References

    1. Kronstad J, Saikia S, Nielson ED, Kretschmer M, Jung W, Hu G, et al. Adaptation of Cryptococcus neoformans to mammalian hosts: integrated regulation of metabolism and virulence. Eukaryot Cell. 2012;11(2):109–18. 10.1128/EC.05273-11 - DOI - PMC - PubMed
    1. Kronstad JW, Attarian R, Cadieux B, Choi J, D'Souza CA, Griffiths EJ, et al. Expanding fungal pathogenesis: Cryptococcus breaks out of the opportunistic box. Nature reviews Microbiology. 2011;9(3):193–203. 10.1038/nrmicro2522 - DOI - PMC - PubMed
    1. Butler G, Rasmussen MD, Lin MF, Santos MA, Sakthikumar S, Munro CA, et al. Evolution of pathogenicity and sexual reproduction in eight Candida genomes. Nature. 2009;459(7247):657–62. 10.1038/nature08064 - DOI - PMC - PubMed
    1. Campuzano A, Wormley FL. Innate Immunity against Cryptococcus, from Recognition to Elimination. J Fungi (Basel). 2018;4(1). Epub 2018/03/10. 10.3390/jof4010033 - DOI - PMC - PubMed
    1. Casadevall A, Coelho C, Alanio A. Mechanisms of Cryptococcus neoformans-Mediated Host Damage. Front Immunol. 2018;9:855 Epub 2018/05/16. 10.3389/fimmu.2018.00855 - DOI - PMC - PubMed

Publication types

MeSH terms