. 2019 Jul 22;14(7):e0219006.
doi: 10.1371/journal.pone.0219006. eCollection 2019.

Preservation of cellular nano-architecture by the process of chemical fixation for nanopathology

Affiliations

Preservation of cellular nano-architecture by the process of chemical fixation for nanopathology

Xiang Zhou et al. PLoS One. .

Abstract

Transformation in chromatin organization is one of the most universal markers of carcinogenesis. Microscale chromatin alterations have been a staple of histopathological diagnosis of neoplasia, and nanoscale alterations have emerged as a promising marker for cancer prognostication and the detection of predysplastic changes. While numerous methods have been developed to detect these alterations, most methods for sample preparation remain largely validated via conventional microscopy and have not been examined with nanoscale sensitive imaging techniques. For these nanoscale sensitive techniques to become standard of care screening tools, new histological protocols must be developed that preserve nanoscale information. Partial Wave Spectroscopic (PWS) microscopy has recently emerged as a novel imaging technique sensitive to length scales ranging between 20 and 200 nanometers. As a label-free, high-throughput, and non-invasive imaging technique, PWS microscopy is an ideal tool to quantify structural information during sample preparation. Therefore, in this work we applied PWS microscopy to systematically evaluate the effects of cytological preparation on the nanoscales changes of chromatin using two live cell models: a drug-based model of Hela cells differentially treated with daunorubicin and a cell line comparison model of two cells lines with inherently distinct chromatin organizations. Notably, we show that existing cytological preparation can be modified in order to maintain clinically relevant nanoscopic differences, paving the way for the emerging field of nanopathology.


Conflict of interest statement

I have read the journal's policy and the authors of this manuscript have the following competing interests: Drs. Backman and Subramanian are cofounders/shareholders of Nanocytomics LLC. This does not alter our adherence to PLOS ONE policies on sharing data and materials.

Figures

Fig 1
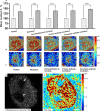
Fig 1. Molecularly distinct structural models of nanoscopic changes to chromatin topology.
(A) Representative Σ maps of HeLa cells before and 15 min after daunorubicin treatment. (B) M248 and A2780. (C) Quantification of mean nuclear Σ change in HeLa model before and 15 min after daunorubicin treatment (HeLa-control = 201 cells, HeLa-daunorubicin = 200 cells), and in the A2780/M248 cell line model (M248 = 240 cells, A2780 = 228 cells) with SE bars. All scale bars are 14μm. **** p<0.001.
Fig 2
Fig 2. Preservation of ΔΣ by 95% ethanol fixation in two structural cell line models.
(A) Control and daunorubicin treated HeLa cells before and after 95% ethanol fixation. (B) M248 and A2780 cells before and after 95% ethanol fixation. (C) Quantification of mean nuclear Σ difference in HeLa cell model (HeLa-control = 141 cells, HeLa-daunorubicin = 145 cells), and in the A2780/M248 cell line model after 95% ethanol fixation (M248 = 110 cells, A2780 = 115 cells) with SE bars. All scale bars are 10μm. **** p<0.001.
Fig 3
Fig 3. Commonly used fixatives and their effects on ΔΣ in HeLa model.
(A) Quantification of mean nuclear Σ in HeLa-control (grey columns) and HeLa-daunorubicin (black columns) before and after fixation using five different fixatives: 1. acetic acid: ethanol = 1:3 (v/v%), HeLa-control = 78 cells, HeLa-daunorubicin = 77 cells; 2. Carnoy's fixative (Ethanol : chloroform : acetic acid = 6:3:1 (v/v%)), HeLa-control = 29 cells, HeLa-daunorubicin = 35 cells; 3. FAA fixative (Ethanol : formaldehyde : acetic acid = 16:3:1 (v/v%)), HeLa-control = 40 cells, HeLa-daunorubicin = 39 cells; 4. 4% formaldehyde in PBS solution (pH~7.4), HeLa-control = 91 cells, HeLa-daunorubicin = 89 cells; 5. 2.5% glutaraldehyde and 2% formaldehyde in PBS solution (pH~7.4), HeLa-control = 92 cells, HeLa-daunorubicin = 96 cells. (B) Representative PWS images of HeLa-control (top row), HeLa-daunorubicin (bottom row) fixed by different fixatives. All scale bars are 8μm. **** p<0.001.
Fig 4
Fig 4. The effects of rehydration on ΔΣ in the HeLa cell model.
Quantification of Σ in (A) HeLa-control (grey columns; 125 cells) and HeLa-daunorubicin (black columns; 125 cells) after each step of serial rehydration with SE bars. The ΔΣ was preserved during serial rehydration. Representative PWS images of the same HeLa cells [control (B) and daunorubicin treated (C)] after each step of serial rehydration. Scale bars are 10μm. (D) Direct rehydration was performed on HeLa model, and the same cells were imaged by PWS before and after direct hydration with DI water. Scale bars are 22μm.(E) Quantification of Σ in HeLa-control (grey columns; 42 cells) and HeLa-daunorubicin (black columns; 46 cells) showing the loss of ΔΣ after direct rehydration. **** p<0.001.
Fig 5
Fig 5. Preservation of ΔΣ after air drying from trehalose solution in two structural cell line models.
(A) HeLa model and (B) the A2780/M248 cell line model imaged by PWS after air drying. (C) Quantification of mean nuclear Σ in HeLa cell model (HeLa-control; 151 cells, HeLa-daunorubicin; 140 cells), and in the A2780/M248 cell line model (M248; 62 cells, A2780; 60 cells) with SE bars. All scale bars are 9μm. **** p<0.001.
Fig 6
Fig 6. Effects of Hematoxylin and Cyto-Stain on ΔΣ in two structural cell line models.
Representative PWS images of HeLa model (A) and the A2780/M248 cell line model (B) after staining. (C) Quantification of mean nuclear Σ in HeLa model (HeLa-control; 82 cells, HeLa-daunorubicin; 75 cells), and in the A2780/M248 cell line model (M248; 73 cells, A2780; 76 cells) with SE bars. All scale bars are 7μm. **** p<0.001.
Fig 7
Fig 7. Effects of immunofluorescence staining on ΔΣ.
HeLa cells were stained using antibody for H3K9me3 (Alexa Fluor 488). (A) Quantification of Σ in HeLa cell model (HeLa-control; 72 cells, HeLa-daunorubicin; 78 cells) at each step of immunofluorescent staining. Representative PWS (left) and fluorescent images (right) of HeLa-control (B) and HeLa-daunorubicin (C) at each step of immunofluorescent staining. (D) Colocalization using PWS and fluorescent microscopy. Each nucleus was segmented into 10 subdivisions based on their fluorescent intensity rankings. Regions with 0–30% and 70–100% fluorescent intensity rankings were shown on both fluorescent and PWS images. (E) Relationship between relative average Σ and fluorescent intensity, with standard error. For each nucleus, we calculated the relative Σ of each fluorescent subdivision by normalizing its Σ to the average Σ of the whole nucleus. The graph shows the averaged relative Σ for each fluorescent subdivision across 316 nucleus. All scale bars are 5μm. **** p<0.001.
Fig 8
Fig 8. Effects of STORM preparation on chromatin ultrastructure.
A2780 and M248 cells were stained using antibody for mRNA polymerase II (Alexa Fluor 546). (A) Quantification of Σ (M248; 63 cells, A2780; 71 cells) at each step of super resolution immunofluorescent labeling. Representative PWS images of M248 (B) and A2780 (C) at each step of fluorescent labeling. Scale bars are 6 μm. Representative STORM (D) and PWS image (E) for the same A2780 cell nuclei for verification of the nanoscopic labeling process. Scale bar is 2.5μm. Similar nuclear features can be seen on both PWS and STORM images. Arrows indicate nucleolus. **** p<0.001.

References

    1. Etzioni R, Urban N, Ramsey S, McIntosh M, Schwartz S, Reid B, et al. The case for early detection. Nat Rev Cancer. 2003;3(4):243–52. 10.1038/nrc1041 - DOI - PubMed
    1. Ludwig JA, Weinstein JN. Biomarkers in Cancer Staging, Prognosis and Treatment Selection. Nat Rev Cancer. 2005;5(11):845–56. 10.1038/nrc1739 - DOI - PubMed
    1. Creech MK, Wang J, Nan X, Gibbs SL. Superresolution Imaging of Clinical Formalin Fixed Paraffin Embedded Breast Cancer with Single Molecule Localization Microscopy. Sci Rep. 2017;7:40766 10.1038/srep40766 https://www.nature.com/articles/srep40766#supplementary-information. - DOI - PMC - PubMed
    1. Eldridge WJ, Steelman ZA, Loomis B, Wax A. Optical Phase Measurements of Disorder Strength Link Microstructure to Cell Stiffness. Biophys J. 2017;112(4):692–702. Epub 2017/03/04. 10.1016/j.bpj.2016.12.016 - DOI - PMC - PubMed
    1. Takabayashi M, Majeed H, Kajdacsy-Balla A, Popescu G. Tissue spatial correlation as cancer marker: SPIE; 2019. 6 p. - PMC - PubMed

Publication types