. 2019 Jul 22;14(7):e0219978.
doi: 10.1371/journal.pone.0219978. eCollection 2019.

Real-time PCR quantification of spliced X-box binding protein 1 (XBP1) using a universal primer method

Affiliations

Real-time PCR quantification of spliced X-box binding protein 1 (XBP1) using a universal primer method

Seung-Bin Yoon et al. PLoS One. .

Abstract

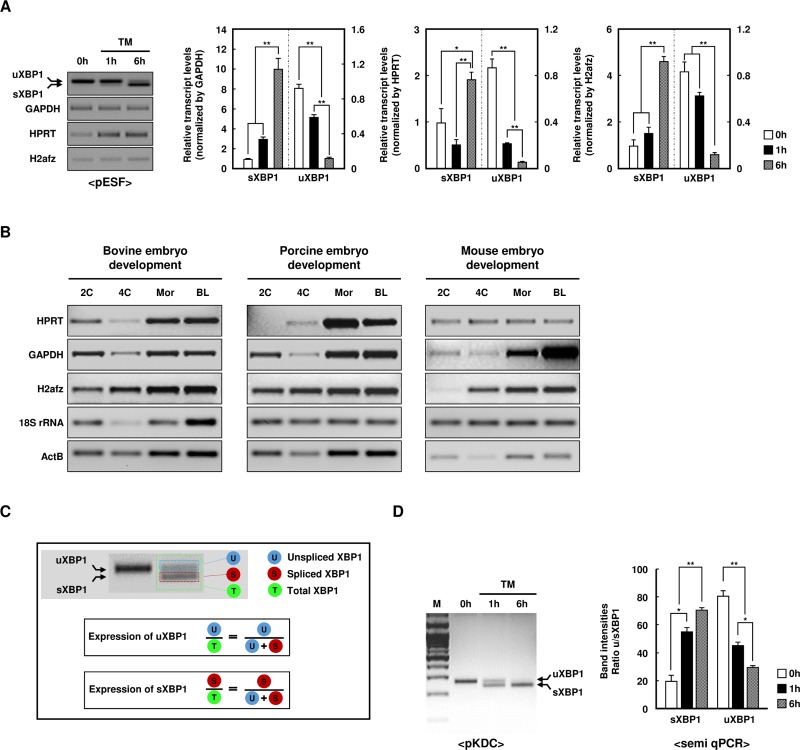
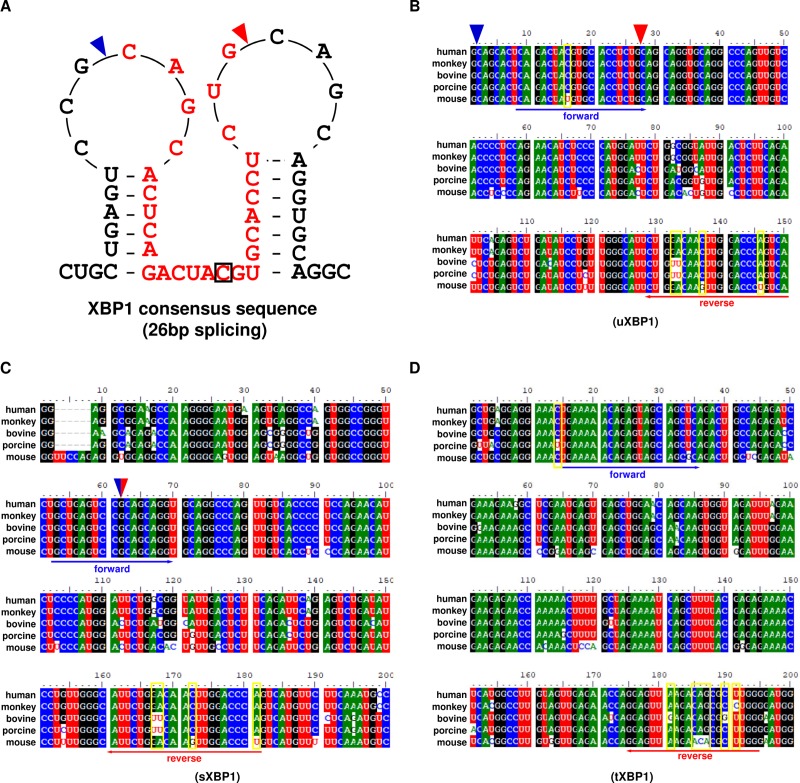
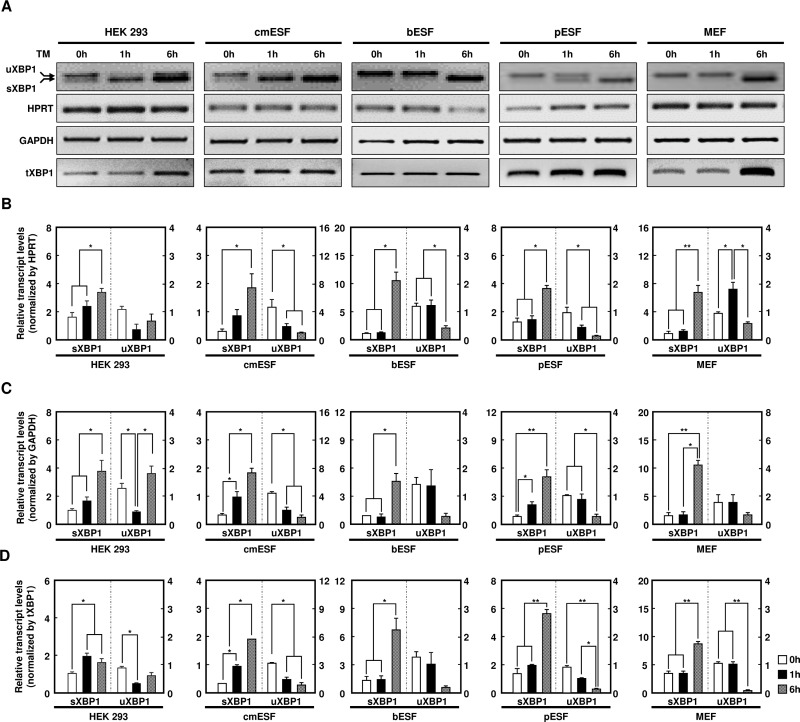
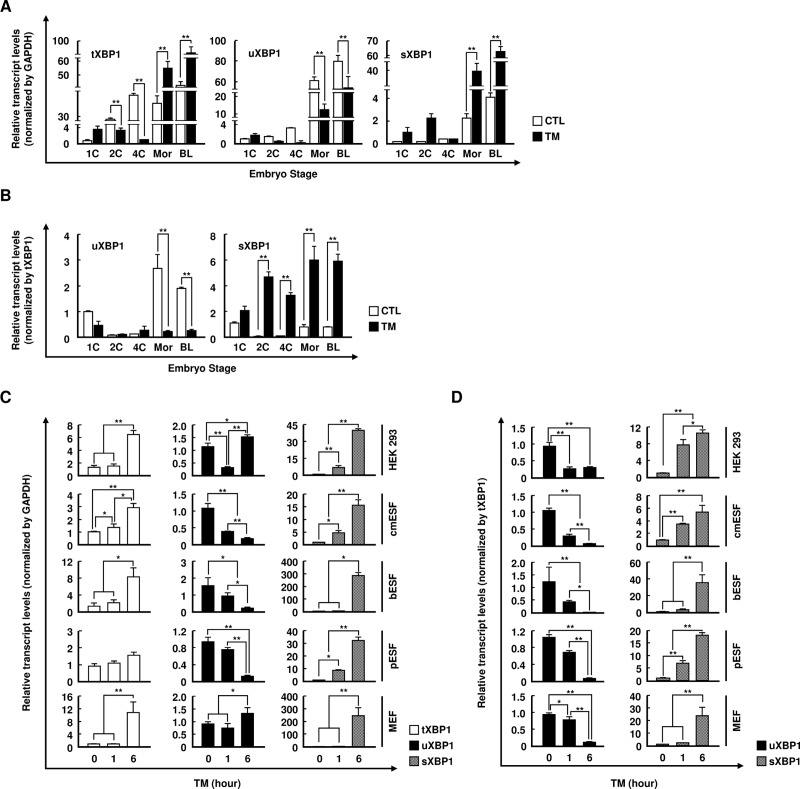
X-box binding protein 1 (XBP1) mRNA processing plays a crucial role in the unfolded protein response (UPR), which is activated in response to endoplasmic reticulum (ER) stress. Upon accumulation of the UPR-converted XBP1 mRNA splicing from an unspliced (u) XBP1 (inactive) isoform to the spliced (s) XBP1 (active) isoform, inositol-requiring enzyme 1 α (IRE1α) removes a 26-nucleotide intron from uXBP1 mRNA. Recent studies have reported the assessment of ER stress by examining the ratio of sXBP1 to uXBP1 mRNA (s/uXBP1 ratio) via densitometric analysis of PCR bands relative to increased levels of sXBP1 to uXBP1 using a housekeeping gene for normalization. However, this measurement is visualized by gel electrophoresis, making it very difficult to quantify differences between the two XBP1 bands and complicating data interpretation. Moreover, most commonly used housekeeping genes display an unacceptably high variable expression pattern of the s/uXBP1 ratio under different experimental conditions, such as various phases of development and different cell types, limiting their use as internal controls. For a more quantitative determination of XBP1 splicing activity, we measured the expression levels of total XBP1 (tXBP1: common region of s/uXBP1) and sXBP1 via real-time PCR using specific primer sets. We also designed universal real-time PCR primer sets capable of amplifying a portion of each u/s/tXBP1 mRNA that is highly conserved in eukaryotes, including humans, monkeys, cows, pigs, and mice. Therefore, we provide a more convenient and easily approachable quantitative real-time PCR method that can be used in various research fields to assess ER stress.


Conflict of interest statement

The authors have declared that no competing interests exist.

Figures

Fig 1
Fig 1. Detection of the XBP1 gene expression using the semi-quantitative polymerase chain reaction (semi-qPCR).
(A) Semi-qPCR analysis of unspliced/spliced (u/s) XBP1 and housekeeping genes (GAPDH, HPRT, or H2afz) using porcine ear skin fibroblast cells (pESF) following 0–6 h supplementation with tunicamycin at 2 μg/mL (TM; left panel). Densitometric analysis of the u/sXBP1 band intensities (right panel). GAPDH, HPRT, or H2afz was used as a normalization control (except in the first panel). Values represent the mean ± standard error (SE) (n = 3; *P < 0.05; **P < 0.01). (B) Semi-qPCR analysis of housekeeping genes (GAPDH, HPRT, H2afz, 18S rRNA, or ActB) during the early embryonic development stage (2-cell, 4-cell, morula, and blastocysts) in bovine, porcine, and mouse embryos. Three pools of 20 embryos were used for each developmental stage. (C) To measure the transcript levels of sXBP1, an indicator of endoplasmic reticulum (ER) stress, reverse transcription-PCR band intensities were densitometrically analyzed, and the levels of sXBP1 and uXBP1 relative to total XBP1 were calculated. (D) Semi-qPCR analysis of u/sXBP1 using porcine kidney-derived primary cells (pKDCs) following 6-h supplementation with TM (left panel). Densitometric analysis of the u/sXBP1 band intensity ratio (right panel). Values represent the mean ± SE (n = 3; *P < 0.05; **P < 0.01).
Fig 2
Fig 2. Primers targeting the u/s/total (t) XBP1-conserved sequence in various species.
(A) The consensus sequence of XBP1 in human, monkey, cow, pig, and mouse. The blue triangle represents the start, and the red triangle represents the end, of the spliced 26 bp intron. The red text indicates the splicing region of XBP1. Black squares indicate the difference sequence of C to U in mice. (B–D) Alignment of the u/s/tXBP1 gene among the five species and the location of each XBP1 primer. The blue triangle indicates the start, and the red triangle indicates the end, of the spliced 26 bp intron. The blue arrow indicates the forward primer and the red arrow indicates the reverse primer.
Fig 3
Fig 3. Analyses of XBP1 expression in various species using semi-qPCR.
(A) Semi-qPCR analysis of u/s/tXBP1 and housekeeping genes (HPRT or GAPDH) using human embryonic kidney 293 (HEK293), cynomolgus monkey ESF (cmESF), bovine ESF (bESF), porcine ESF (pESF), and mouse embryonic fibroblast (MEF) cells following 0, 1, 6 h supplementation with tunicamycin. (B–D) Densitometric analysis of u/sXBP1 band intensities. The tXBP1 employed for quantification was used as a universal primer, 181 bp in size, as shown in Fig 2D. HPRT, GAPDH, or tXBP1 was used as a normalization control. Values represent the mean ± SE (n = 3; *P < 0.05; **P < 0.01).
Fig 4
Fig 4. Examining the expression of u/s/tXBP1 during early embryonic development in various species using qPCR.
(A and B) qPCR analyses of the relative abundances of u/s/tXBP1 in porcine embryos at early developmental stages (1-cell, 2-cell, 4-cell, molura, and blastocyst) in the absence and presence of tunicamycin. GAPDH or tXBP1 was used as a normalization control. Values represent the mean ± SE (n = 3; **P < 0.01). (C and D) qPCR analyses of the relative abundances of u/s/tXBP1 in HEK293, cmESF, bESF, pESF, and MEF cells cultured for 0, 1, 6 h with TM. GAPDH or tXBP1 was used as a normalization control. Values represent the mean ± SE (n = 3; *P < 0.05; **P < 0.01).

References

    1. Cubillos-Ruiz JR, Silberman PC, Rutkowski MR, Chopra S, Perales-Puchalt A, Song M, et al. ER Stress Sensor XBP1 Controls Anti-tumor Immunity by Disrupting Dendritic Cell Homeostasis. Cell. 2015;161(7):1527–38. 10.1016/j.cell.2015.05.025 - DOI - PMC - PubMed
    1. Back SH, Schroder M, Lee K, Zhang K, Kaufman RJ. ER stress signaling by regulated splicing: IRE1/HAC1/XBP1. Methods. 2005;35(4):395–416. 10.1016/j.ymeth.2005.03.001 . - DOI - PubMed
    1. Bartoszewski R, Brewer JW, Rab A, Crossman DK, Bartoszewska S, Kapoor N, et al. The unfolded protein response (UPR)-activated transcription factor X-box-binding protein 1 (XBP1) induces microRNA-346 expression that targets the human antigen peptide transporter 1 (TAP1) mRNA and governs immune regulatory genes. J Biol Chem. 2011;286(48):41862–70. 10.1074/jbc.M111.304956 - DOI - PMC - PubMed
    1. Walter F, Schmid J, Dussmann H, Concannon CG, Prehn JH. Imaging of single cell responses to ER stress indicates that the relative dynamics of IRE1/XBP1 and PERK/ATF4 signalling rather than a switch between signalling branches determine cell survival. Cell Death Differ. 2015;22(9):1502–16. 10.1038/cdd.2014.241 - DOI - PMC - PubMed
    1. Pehar M, Jonas MC, Hare TM, Puglielli L. SLC33A1/AT-1 protein regulates the induction of autophagy downstream of IRE1/XBP1 pathway. J Biol Chem. 2012;287(35):29921–30. 10.1074/jbc.M112.363911 - DOI - PMC - PubMed

Publication types