. 2020 Jan 1;21(1):93-101.
doi: 10.1093/ehjci/jez074.

Magnetic resonance hyperpolarization imaging detects early myocardial dysfunction in a porcine model of right ventricular heart failure

Affiliations

Magnetic resonance hyperpolarization imaging detects early myocardial dysfunction in a porcine model of right ventricular heart failure

Peter Agger et al. Eur Heart J Cardiovasc Imaging. .

Abstract

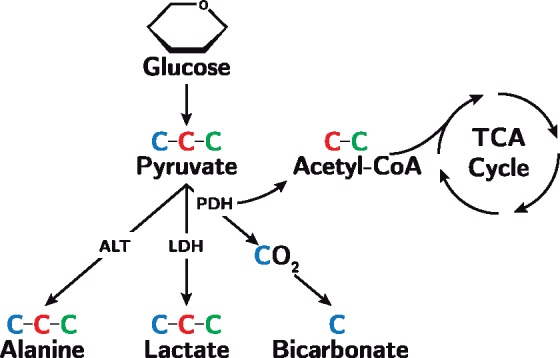
Aims: Early detection of heart failure is important for timely treatment. During the development of heart failure, adaptive intracellular metabolic processes that evolve prior to macro-anatomic remodelling, could provide an early signal of impending failure. We hypothesized that metabolic imaging with hyperpolarized magnetic resonance would detect the early development of heart failure before conventional echocardiography could reveal cardiac dysfunction.

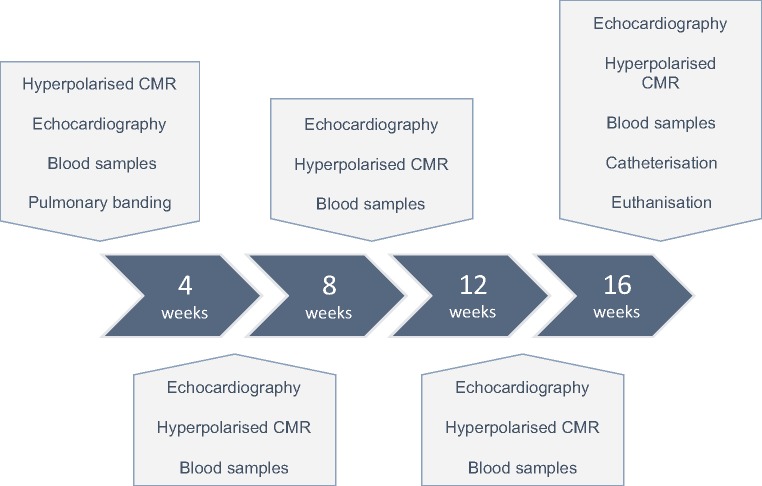
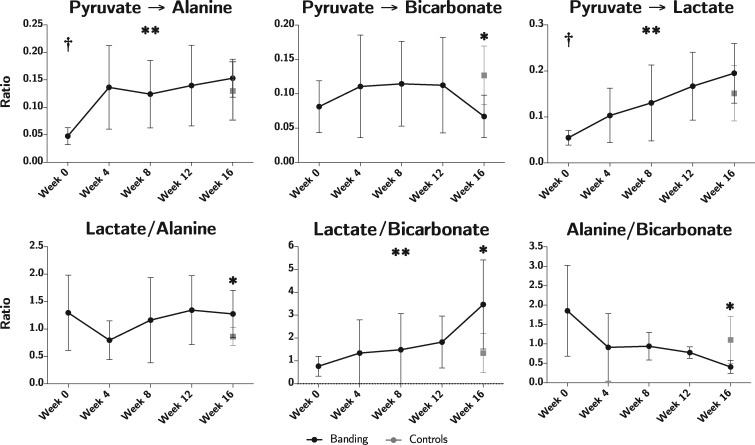
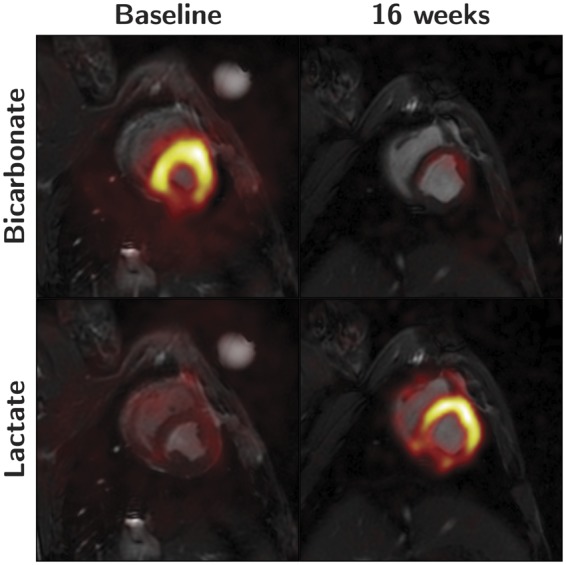
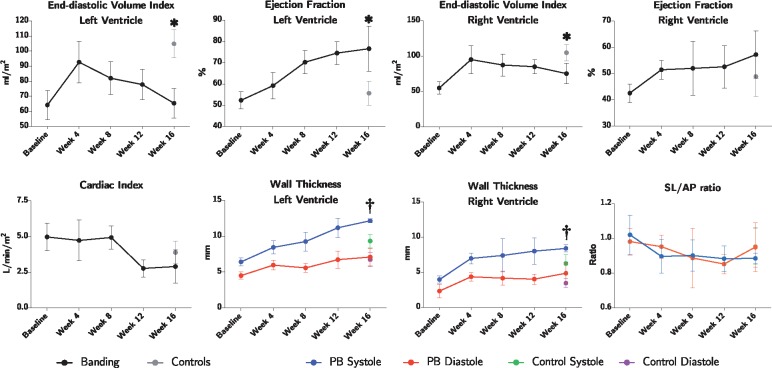
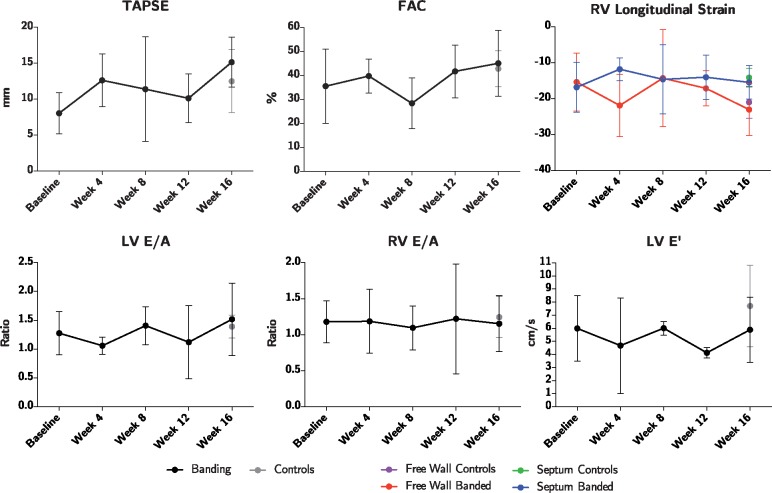
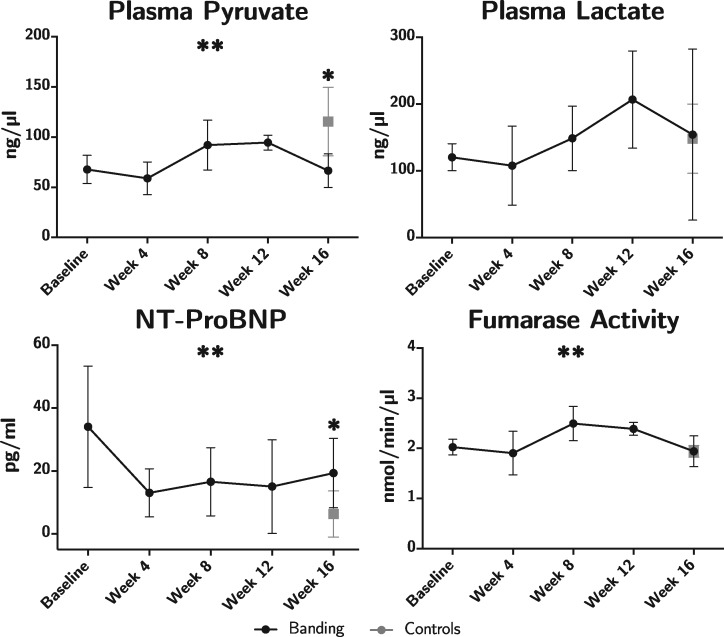
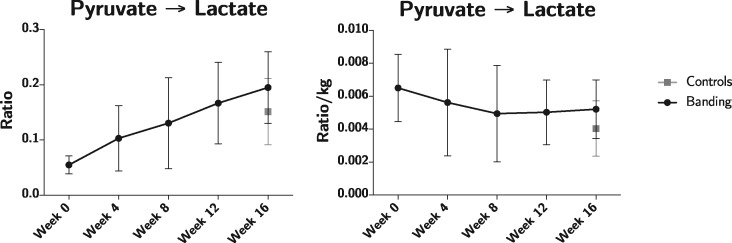
Methods and results: Five 8.5 kg piglets were subjected to pulmonary banding and subsequently examined by [1-13C]pyruvate hyperpolarization, conventional magnetic resonance imaging, echocardiography, and blood testing, every 4 weeks for 16 weeks. They were compared with a weight matched, healthy control group. Conductance catheter examination at the end of the study showed impaired right ventricular systolic function along with compromised left ventricular diastolic function. After 16 weeks, we saw a significant decrease in the conversion ratio of pyruvate/bicarbonate in the left ventricle from 0.13 (0.04) in controls to 0.07 (0.02) in animals with pulmonary banding, along with a significant increase in the lactate/bicarbonate ratio to 3.47 (1.57) compared with 1.34 (0.81) in controls. N-terminal pro-hormone of brain natriuretic peptide was increased by more than 300%, while cardiac index was reduced to 2.8 (0.95) L/min/m2 compared with 3.9 (0.95) in controls. Echocardiography revealed no changes.

Conclusion: Hyperpolarization detected a shift towards anaerobic metabolism in early stages of right ventricular dysfunction, as evident by an increased lactate/bicarbonate ratio. Dysfunction was confirmed with conductance catheter assessment, but could not be detected by echocardiography. Hyperpolarization has a promising future in clinical assessment of heart failure in both acquired and congenital heart disease.

Keywords: Metabolism; congenital heart disease; heart failure; magnetic resonance imaging.


Figures

Figure 1
Figure 1
The metabolic pathways of pyruvate. Pyruvate contains three carbon atoms and is formed from glucose through glycolysis. In this study, we hyperpolarize the first carbon atom (blue) making [1-13C]-pyruvate. Using hyperpolarization imaging, we thus follow the metabolic fate of the first carbon atom when pyruvate is metabolized to alanine via alanine transaminase (ALT), lactate via lactate dehydrogenase (LDH), and bicarbonate via pyruvate dehydrogenase (PDH). The second and third carbon atom (red and green) enters the tricarboxylic acid cycle (TCA) when incorporated into acetyl coenzyme A.
Figure 2
Figure 2
Outline of the study timeline. Animals were subjected to pulmonary banding at Week 0. Every 4 weeks they were subjected to hyperpolarized [1-13C]-pyruvate cardiac magnetic resonance (CMR), 4D echocardiography, and blood samples. Before termination at 16 weeks the animals were, moreover, subjected to biventricular conductance catheter assessment. At all-time points, the events were conducted in the order according to the figure. At Week 16, a weight matched control group was introduced.
Figure 3
Figure 3
Results on metabolic imaging displayed as pyruvate conversion ratios in the top row and metabolite ratios in the bottom row. Animals subjected to pulmonary banding (black) are compared with the endpoint control group (grey). Data plotted as means with whisker bars representing 95% confidence interval. *Statistically significant difference between the intervention and control group at Week 16. **Statistically significant repeated measures ANOVA in the intervention group. Statistically significant difference between baseline at Week 0 and the control group.
Figure 4
Figure 4
This figure shows the inverse relationship between the conversion of pyruvate to bicarbonate and lactate during the development of right heart failure. C signal overlay on conventional short-axis proton images of the heart. Left column is baseline images at Week 0. Right column is at 16 weeks. Top row shows the bicarbonate signal. Bottom row shows the lactate signal.
Figure 5
Figure 5
Results of magnetic resonance imaging. Data plotted as means with whisker bars representing 95% confidence interval. PB, pulmonary banding; SL/AP, septum-lateral/anterior-posterior ratio of the left ventricle. *Statistically significant difference between the intervention and control group at Week 16. Statistically significant one-way ANOVA between groups at 16 weeks.
Figure 6
Figure 6
Assessment of cardiac function by echocardiography. Strain is assessed in both the right ventricular free wall, and in the septum. Animals subjected to pulmonary banding (black) are compared with the endpoint control group (grey). Data plotted as means with whisker bars representing 95% confidence interval. FAC, fractional area change; LV, left ventricle; RV, right ventricle; TAPSE, tricuspid annular plane systolic excursion.
Figure 7
Figure 7
Biochemistry assessment. Animals subjected to pulmonary banding (black) are compared with the endpoint control group (grey). Data plotted as means with whisker bars representing 95% confidence interval. NT-ProBNP, N-terminal pro-hormone of brain natriuretic peptide. *Statistically significant difference between the intervention and control group at Week 16. **Statistically significant repeated measures ANOVA in the intervention group.
Figure 8
Figure 8
Pyruvate to lactate conversion ratios with (right) and without (left) body weight normalization. The pronounced difference between the curves underscores the age/weight related development in metabolic phenotype.

References

    1. Hinton RB, Ware SM.. Heart failure in pediatric patients with congenital heart disease. Circ Res 2017;120:978–94. - PMC - PubMed
    1. Voelkel NF, Quaife RA, Leinwand LA, Barst RJ, Mcgoon MD, Meldrum DR. et al. Right ventricular function and failure report of a national heart, lung, and blood institute working group on cellular and molecular mechanisms of right heart failure. Circulation 2006;114:1883–91. - PubMed
    1. Friedberg MK, Redington AN.. Right versus left ventricular failure: differences, similarities, and interactions. Circulation 2014;129:1033–44. - PubMed
    1. Stout KK, Broberg CS, Book WM, Cecchin F, Chen JM, Dimopoulos K. et al. Chronic heart failure in congenital heart disease: a scientific statement from the American Heart Association. Circulation 2016;133:770–801. - PubMed
    1. Bogaard HJ, Abe K, Noordegraaf AV, Voelkel NF.. The right ventricle under pressure: cellular and molecular mechanisms of right-heart failure in pulmonary hypertension. Chest 2009;135:794–804. - PubMed

Publication types